
- Canton consolidates at $0.15 after the January 21 Swyftx listing expanded retail access and triggered a sharp rally from the $0.11 low.
- A cup and handle pattern on the daily chart projects a measured move toward $0.20 if the neckline near $0.17 breaks with volume.
- Open interest surges 8.37% to $29.13 million as derivatives traders position for continuation, with shorts absorbing the majority of liquidations.
Canton price today trades near $0.15206 as the token consolidates after a strong rally from the January 19 low. The Swyftx listing on January 21 expanded retail access and sparked immediate buying interest, pushing CC above all four EMAs while a bullish pattern nears completion on the daily chart.
Swyftx Listing Drives Retail Interest
The listing on Swyftx increased visibility for Canton and reinforced its institutional-grade narrative around privacy and interoperability. Price responded quickly to the announcement, suggesting traders acted with conviction rather than hesitation.
Unlike the broader market, which remained under pressure during the same period, Canton outperformed selectively. The decoupling from general crypto weakness shows that the rally was driven by token-specific catalysts rather than macro sentiment.
The listing adds another access point for retail traders, expanding the potential buyer base. Exchange listings often create sustained interest as new participants discover the token and begin building positions.
Cup And Handle Pattern Takes Shape
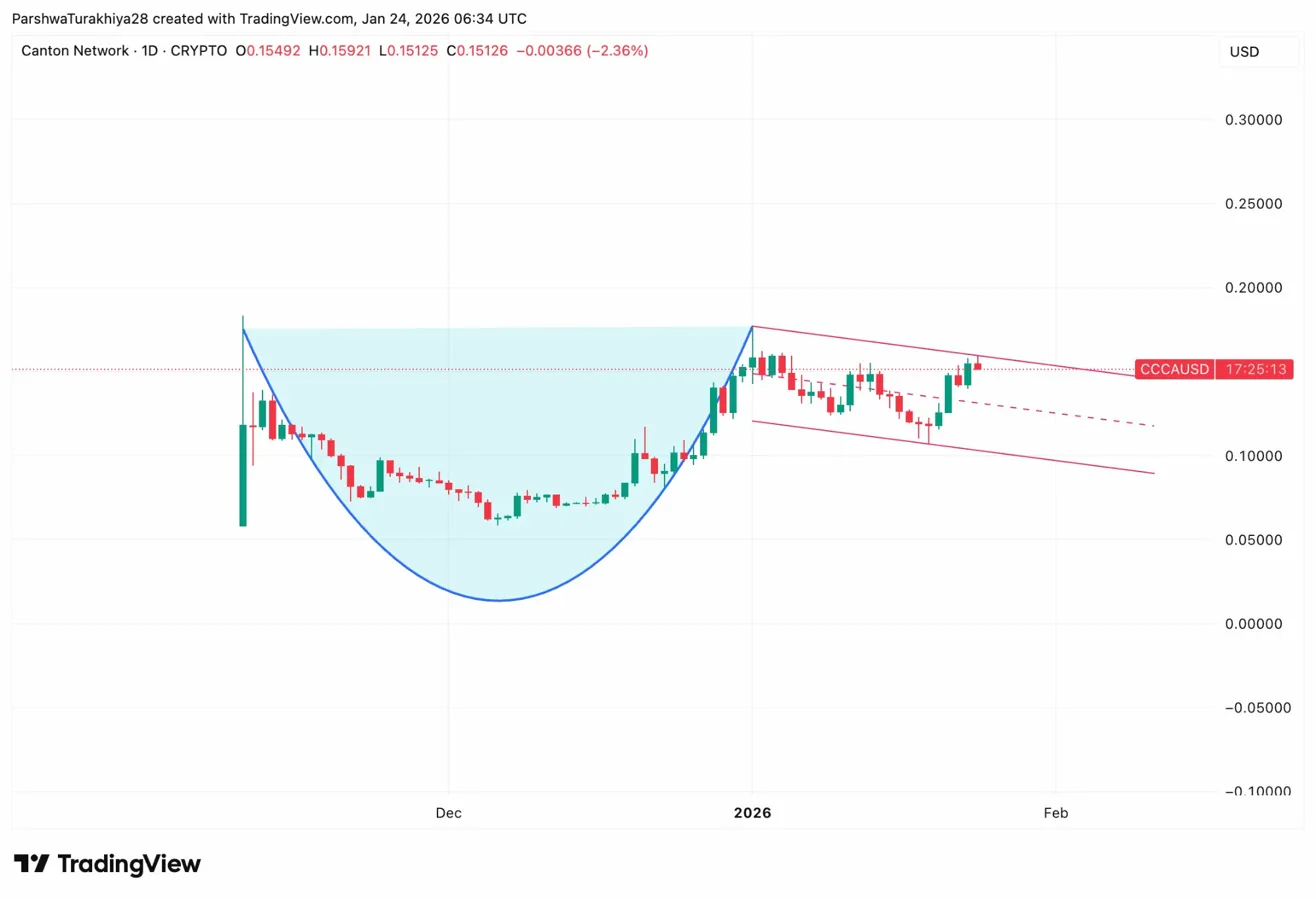
On the daily chart, Canton has formed a textbook cup and handle pattern since November. The cup portion shows a rounded bottom from the $0.15 neckline down to $0.02 lows before recovering back to resistance. The handle portion is now forming as price consolidates just below the neckline.
Cup and handle patterns are classic continuation setups. A breakout above the neckline near $0.17 would confirm the pattern and project a measured move toward $0.20 to $0.22 based on the cup depth.
The handle shows a descending channel formation on lower timeframes, which is typical for this pattern. The pullback allows overbought conditions to reset before the next leg higher.
Derivatives Activity Surges
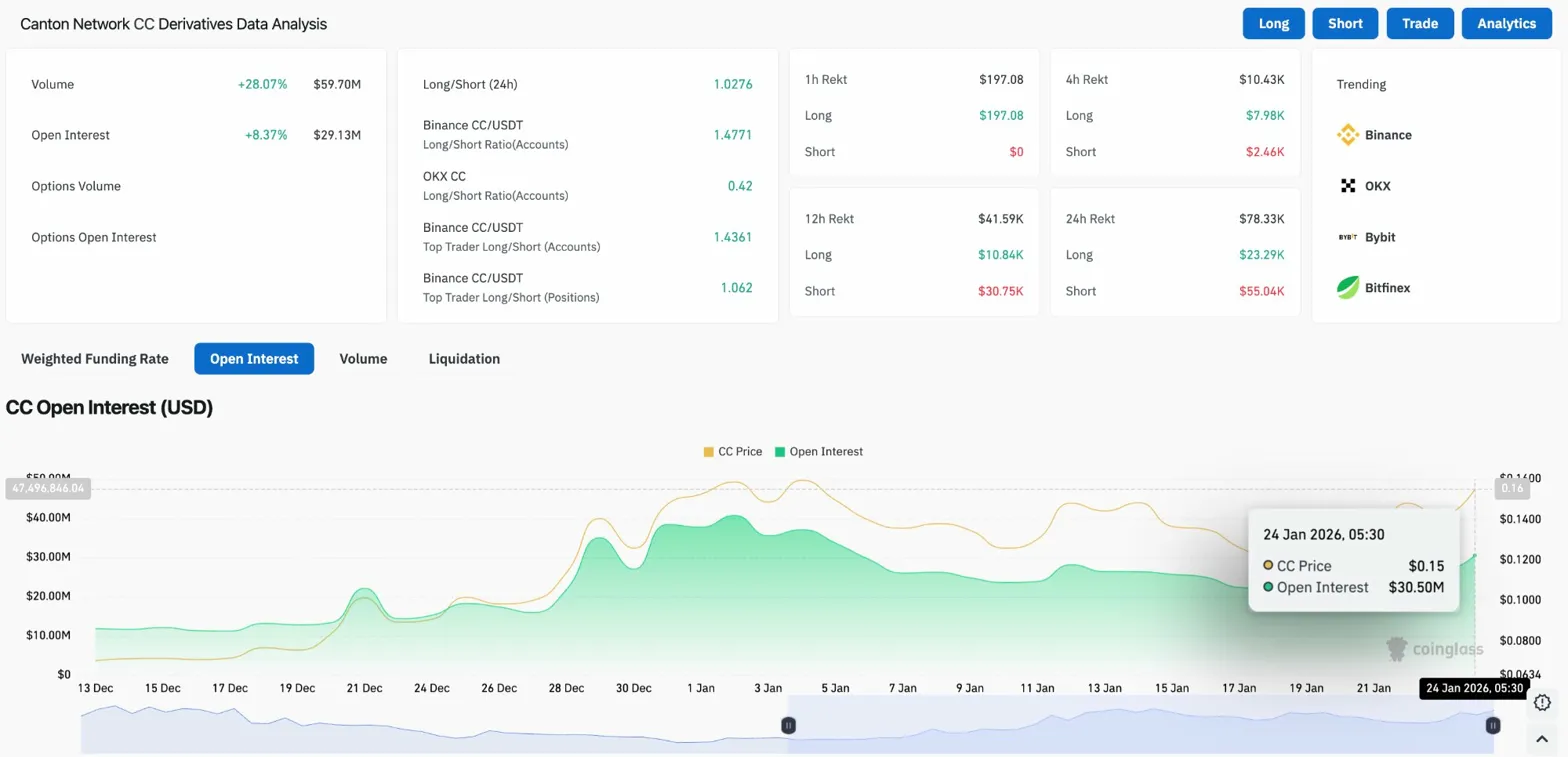
Futures markets show growing conviction in the rally. Open interest climbed 8.37% to $29.13 million while trading volume rose 28.07% to $59.70 million. When both metrics expand together, it signals that new money is entering rather than existing positions being shuffled.
The long/short ratio sits at 1.02, slightly favoring longs. Top traders on Binance show 1.47 long/short ratio, indicating larger accounts are positioned for upside.
Over the past 24 hours, $55.04K in short positions were liquidated compared to $23.29K in longs. The 2:1 ratio shows that shorts are being squeezed as price holds above key support levels.
Price Holds Above EMA Cluster
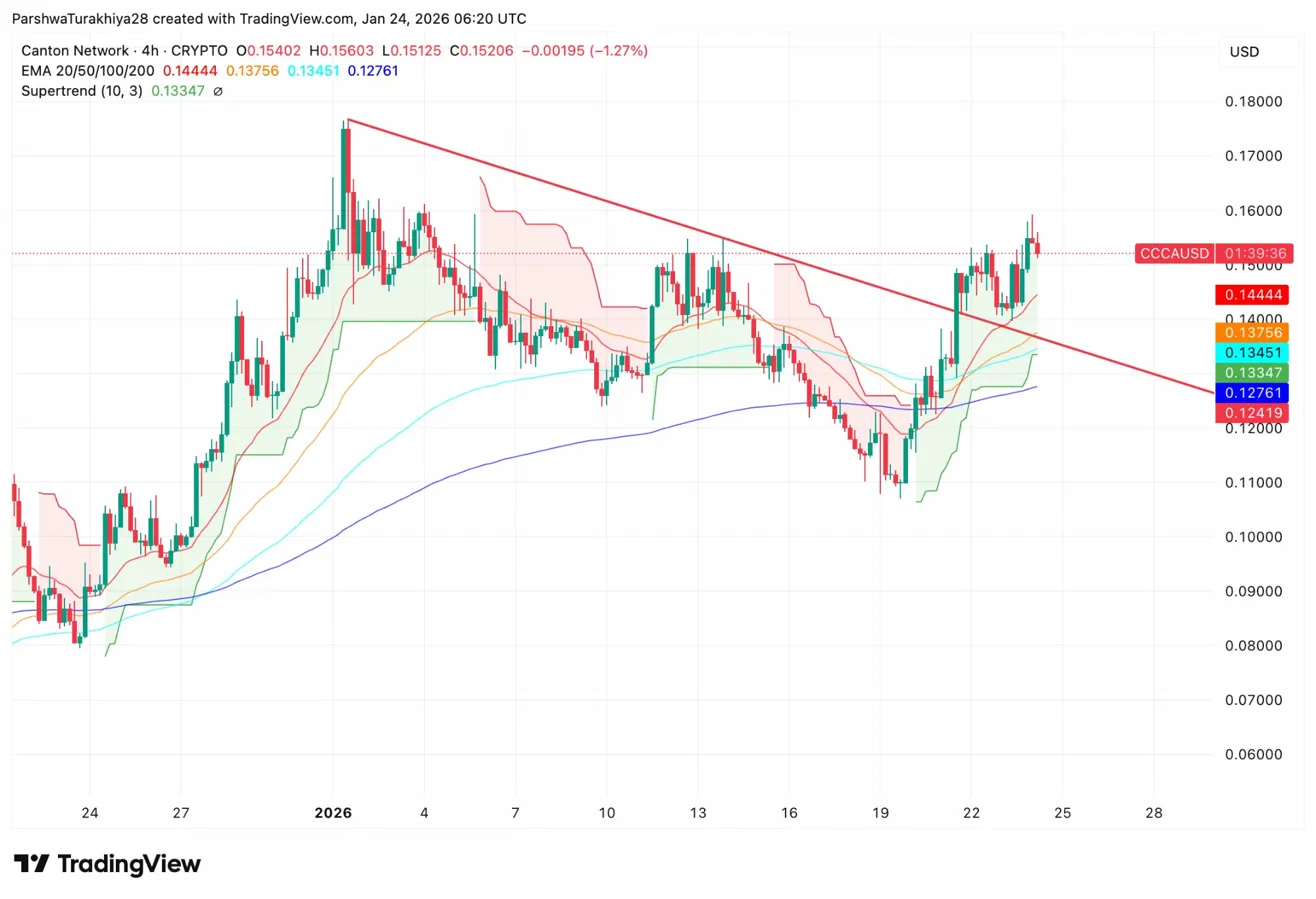
On the 4-hour chart, Canton trades above all four EMAs for the first time since early January. The structure has shifted from bearish to bullish, with price using the 20 EMA at $0.1444 as support.
Key levels now:
- Immediate support: $0.1444 (20 EMA)
- Secondary support: $0.1375 (50 EMA)
- Supertrend support: $0.1334
- Major support: $0.1276 (200 EMA)
- Immediate resistance: $0.156 (descending trendline)
- Cup neckline: $0.17
- Pattern target: $0.20 to $0.22
The Supertrend indicator flipped bullish at $0.1334 and continues to support the recovery thesis. A close below this level would invalidate the near-term bullish structure.
Intraday Structure Shows Higher Lows
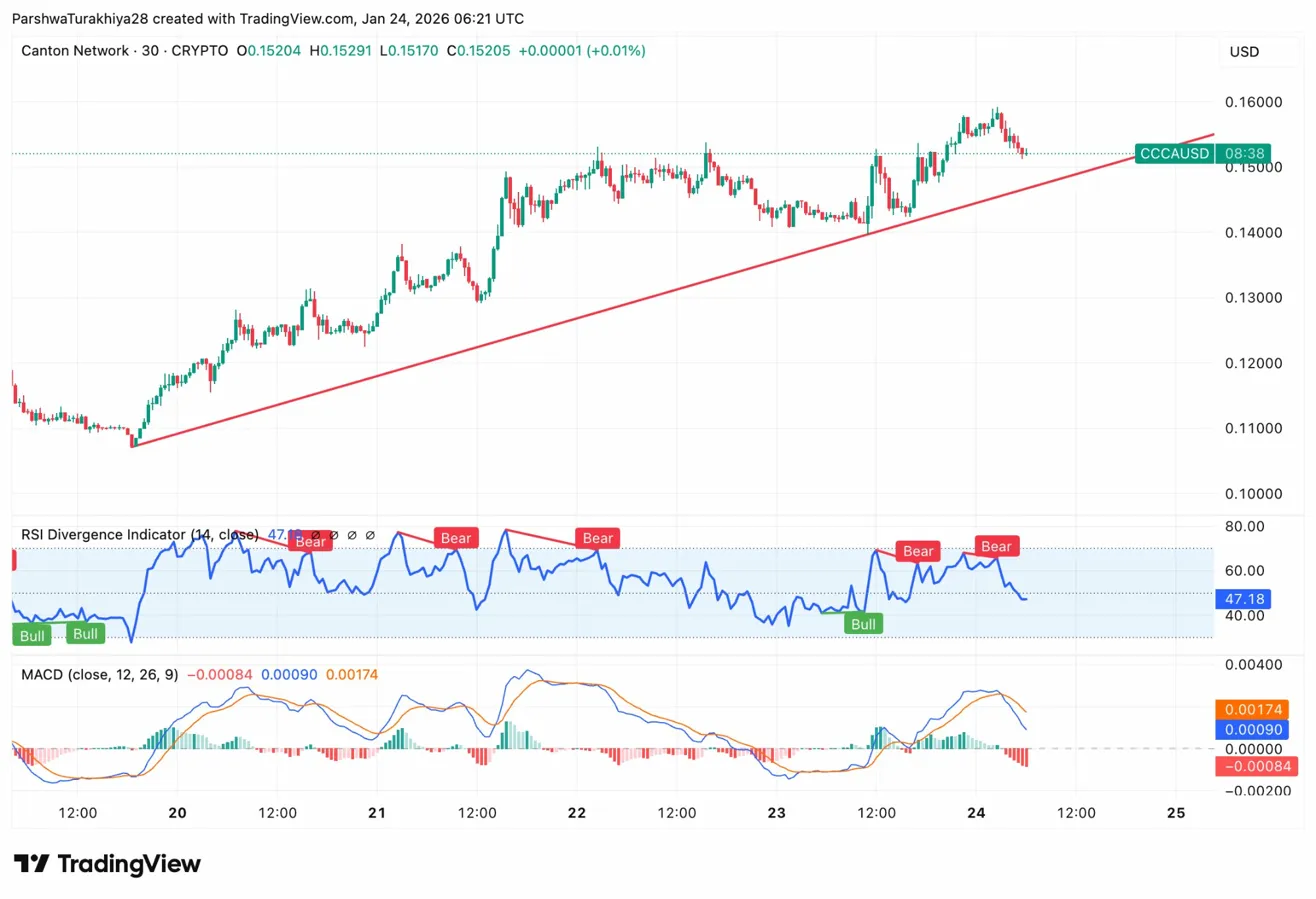
Shorter timeframes reveal the consolidation dynamics. On the 30-minute chart, CC has formed an ascending trendline since the January 19 low, making consistent higher lows as the handle takes shape.
RSI sits at 47.18, neutral territory after pulling back from overbought conditions hit during the initial rally. The indicator shows bearish divergence signals, warning that momentum may be fading temporarily. MACD remains positive but is compressing, consistent with consolidation before a breakout.
A break above $0.156 would clear the descending trendline and signal that the handle is complete. That move would target the $0.17 neckline and potentially trigger the cup breakout.
Outlook: Will The Cup Complete?
The setup favors bulls if the pattern confirms. Rising OI, short liquidations, and expanding retail access create conditions for continuation. The key is whether price can break the descending trendline and clear the $0.17 neckline.
- Bullish case: Price breaks $0.156 resistance and clears the neckline at $0.17. A daily close above $0.17 confirms the cup and handle and targets $0.20 to $0.22.
- Bearish case: The handle breaks down through $0.14 support. A close below the 50 EMA at $0.1375 invalidates the pattern and targets $0.12.
Disclaimer: The information presented in this article is for informational and educational purposes only. The article does not constitute financial advice or advice of any kind. Coin Edition is not responsible for any losses incurred as a result of the utilization of content, products, or services mentioned. Readers are advised to exercise caution before taking any action related to the company.


