 Defends Critical $0.80 Support as Analysts Outline Long-Term Bull Case")
- Cardano builds strength as accumulation range forms, signaling a possible long-term rally.
- Analysts highlight $0.80 support as crucial for ADA’s rebound toward higher resistance levels.
- Technical indicators show neutral momentum, with RSI near 45 and weak MACD histogram bars.
Cardano (ADA) remains a key token for traders to watch, as top analysts highlight a strengthening long-term bull case, even as the price faces a critical short-term test. While many investors may be overlooking the project, a closer look at the chart shows a powerful accumulation phase is underway, with a clear line in the sand for bulls to defend.
Long-Term View: A “Blind Spot” Accumulation Phase
Leading market analyst Michaël van de Poppe described Cardano as being in a “blind spot” for most investors, but emphasized that it has been steadily gaining strength under the surface.
Long-term thesis
According to his analysis, ADA is now accumulating within a new range after reclaiming levels lost during the 2022 downturn. He believes this is a strong foundation for the next major upward move.
Key long-term levels
Van de Poppe identified $1.2430 as the crucial long-term resistance barrier and $0.7460 as the strongest support zone. He expects that if ADA can sustain its position above the mid-range pivot of $0.9850, it will build momentum for a run toward $1.24 and potentially new highs in the coming years.
The Short-Term Battle: Defending the $0.80 Support
While the long-term picture looks bullish, another top analyst, Ali Martinez, has provided a more immediate, short-term outlook.
Short-term chart pattern
Martinez observed a descending triangle formation on the chart, with $0.80 serving as the vital support level.
Holding that line could enable ADA to rebound toward the $0.88–$0.90 resistance range. A successful break of that barrier could spark a stronger bullish move, although slipping below $0.80 would signal further downside pressure.
Technical Indicators Show Neutral Momentum
Cardano’s price has recently traded around $0.8058, marking a 3.91% decline over the past day. On a weekly scale, losses reached nearly 6%, leaving its market cap at $29.4 billion.
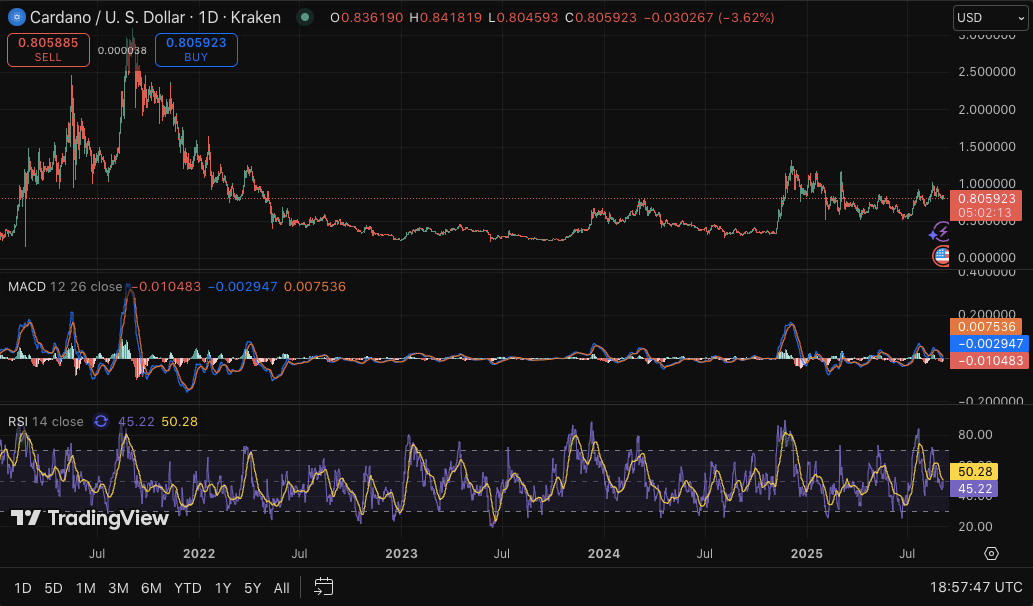
The MACD indicator shows the blue line hovering slightly above the red signal line, hinting at a fragile bullish bias. However, weak histogram bars indicate limited buying momentum. Similarly, the RSI rests at 45.39, slightly below the neutral 50 level, reflecting a balanced but indecisive market tone.
Disclaimer: The information presented in this article is for informational and educational purposes only. The article does not constitute financial advice or advice of any kind. Coin Edition is not responsible for any losses incurred as a result of the utilization of content, products, or services mentioned. Readers are advised to exercise caution before taking any action related to the company.
 Price Prediction for April 2026: Will Chainlink Move Higher?")
 Price Prediction: Can Bulls Sustain the $0.045 Push?")


