 Price Prediction for July 13, 2025: ADA Pulls Back From $0.74 as Bulls Defend $0.68 Support")
After a sharp rally that pushed Cardano price to a recent peak of $0.7678, the market is now undergoing a mild correction. As of writing, Cardano price today is hovering near $0.70, down roughly 3.5% in the past 24 hours. The pullback follows a test of the $0.73–$0.75 resistance band, which coincides with a significant supply area and Fibonacci cluster.
What’s Happening With Cardano’s Price?
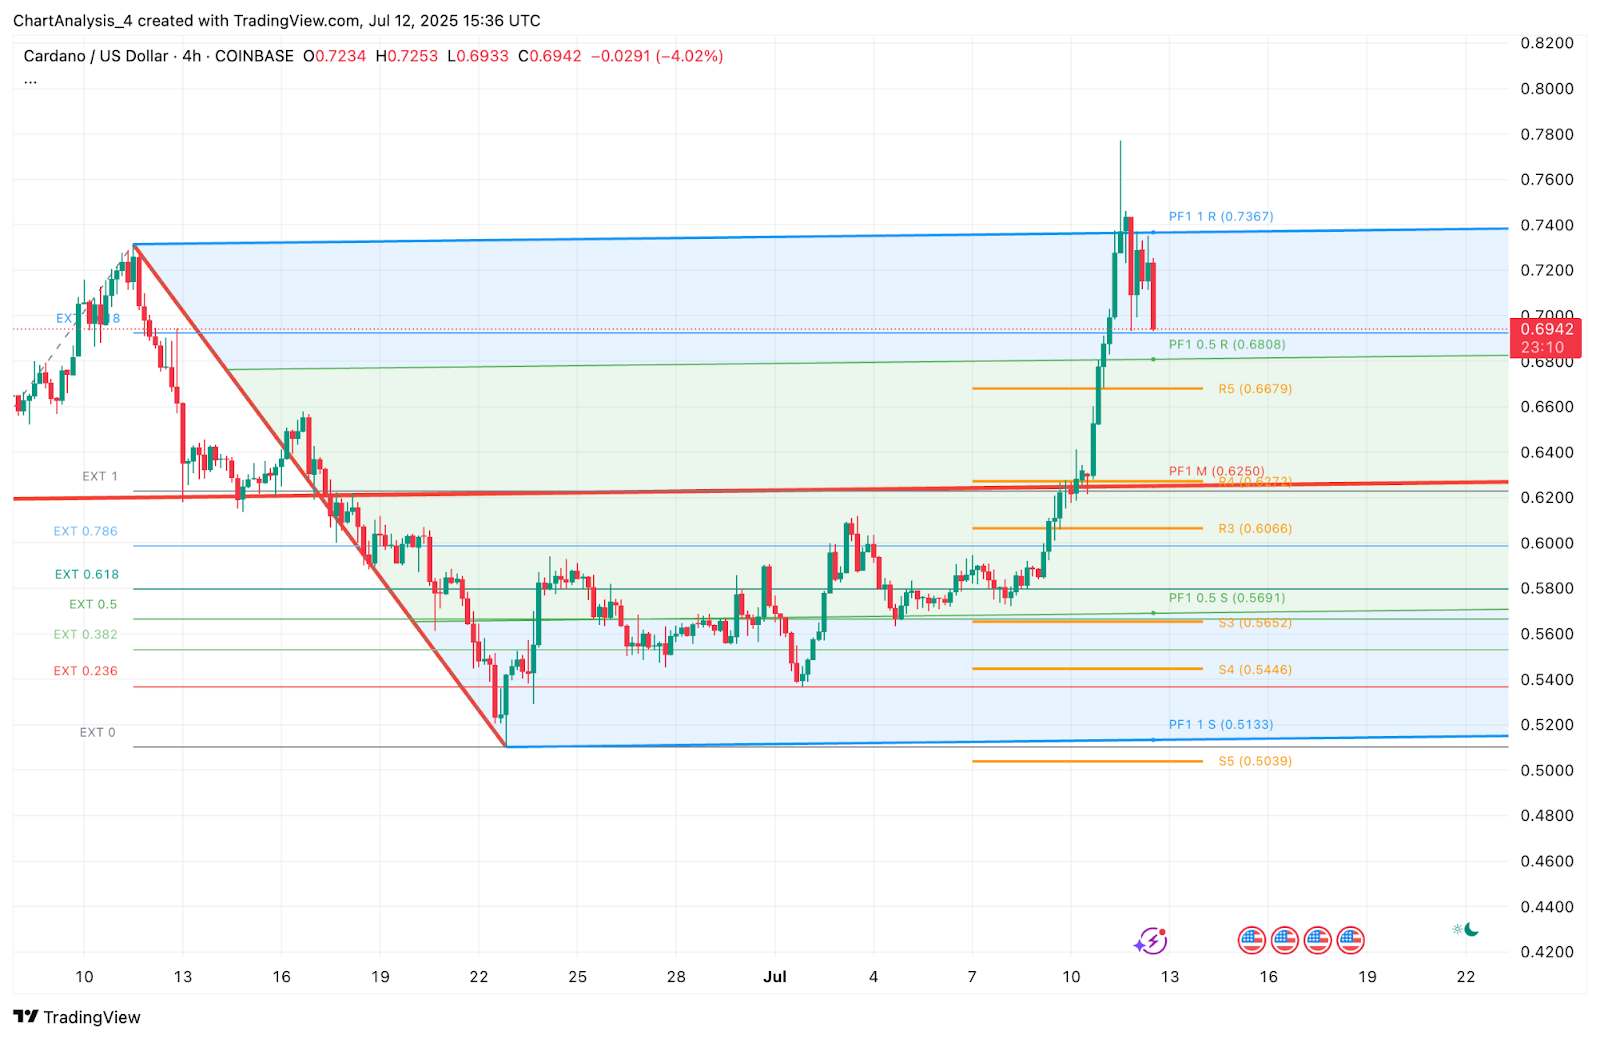
Cardano’s rally from sub-$0.58 levels accelerated on July 10, forming a steep vertical leg that pierced multiple resistance zones. However, the move stalled just below the PF1.1R Fibonacci extension at $0.7367, where price sharply rejected and began consolidating lower.
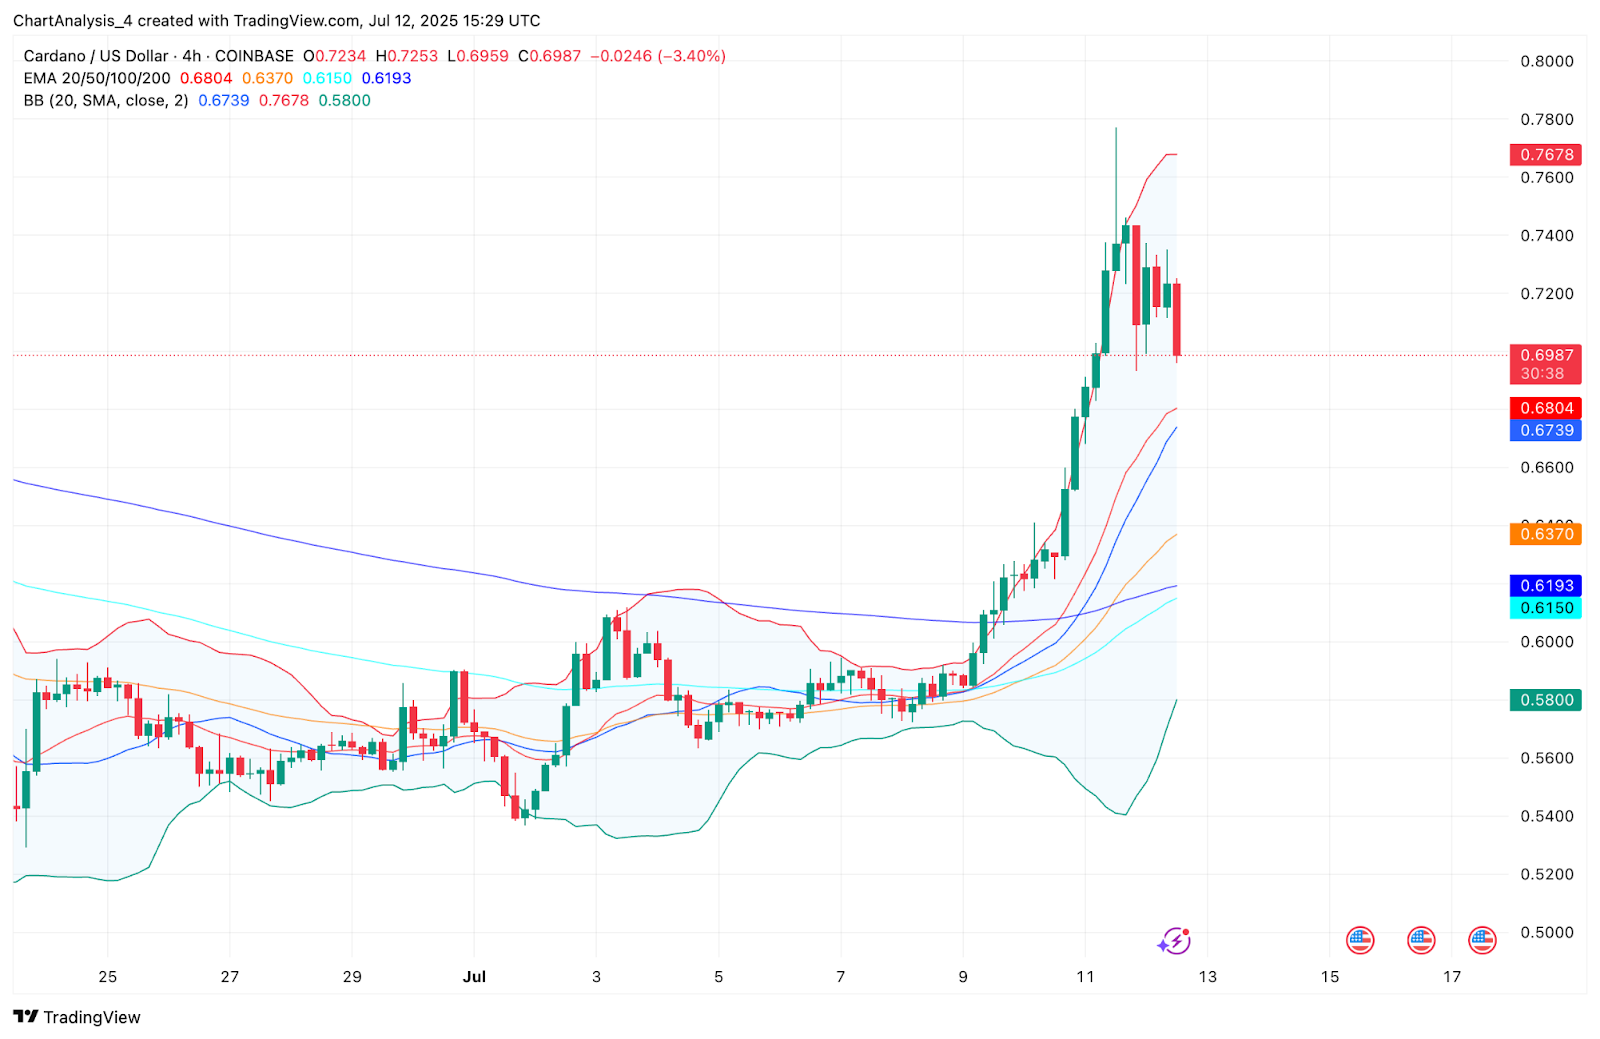
On the 4-hour chart, ADA is now retesting the 20 EMA at $0.6804 and the Bollinger Band midline near $0.6739. This zone has emerged as a near-term demand area. The Supertrend indicator remains bullish with a trend flip near $0.6858, reinforcing the current support.
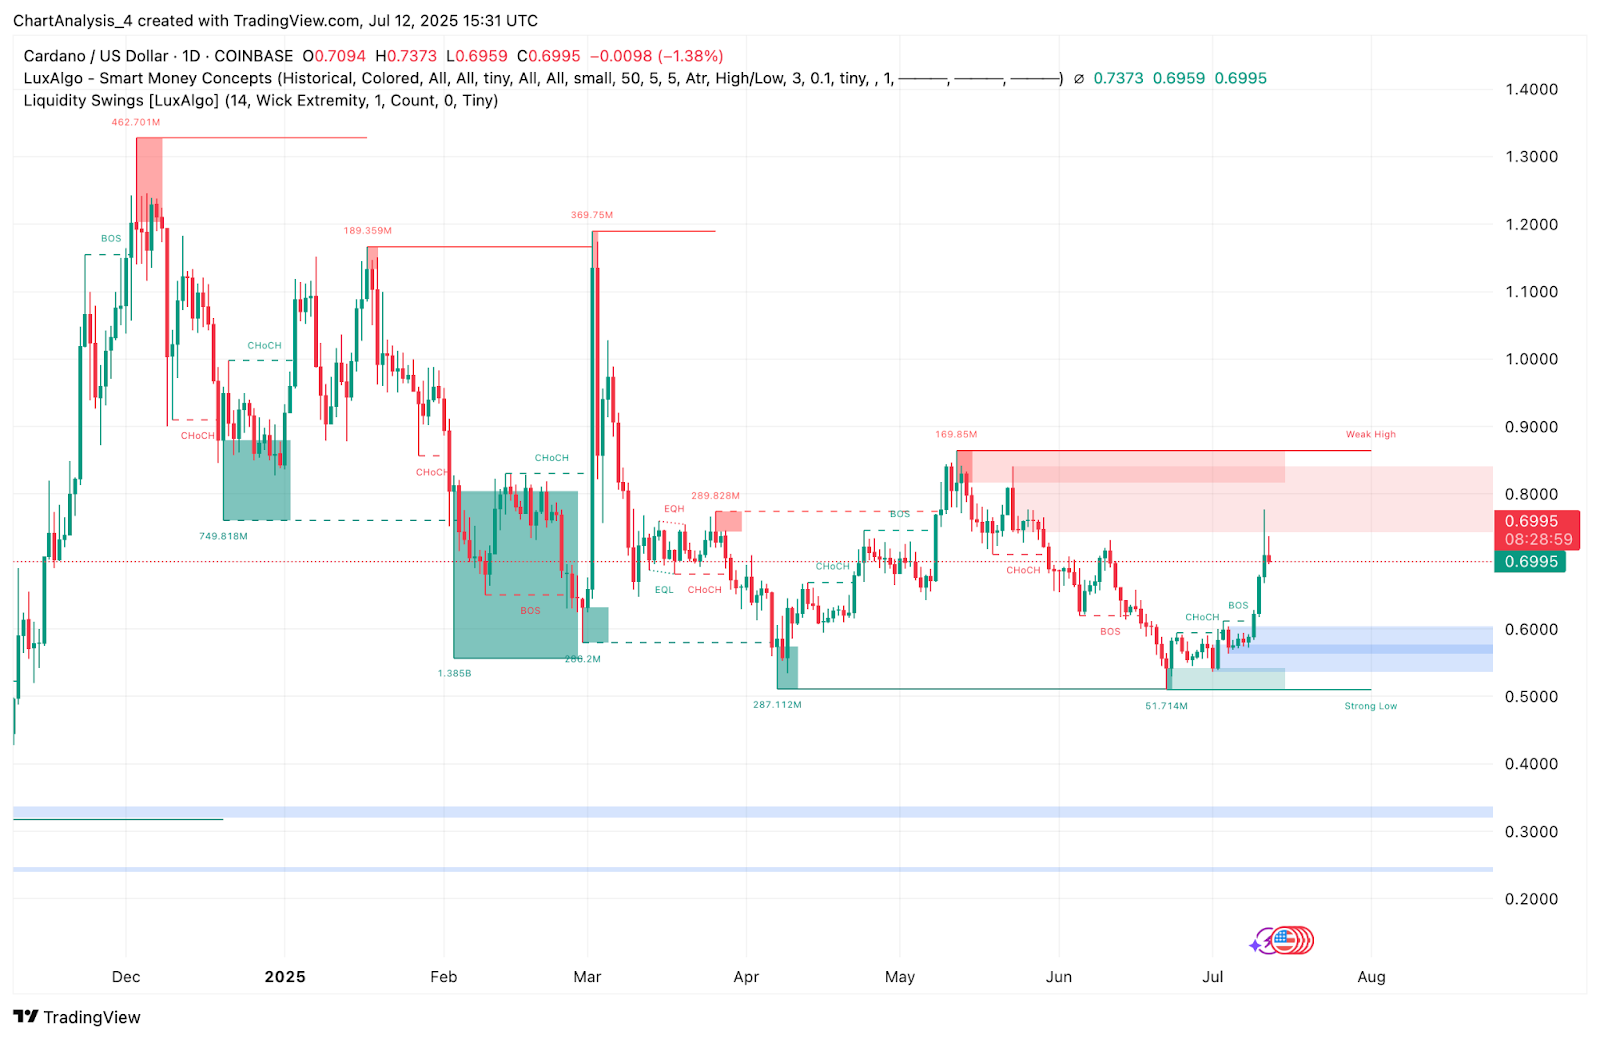
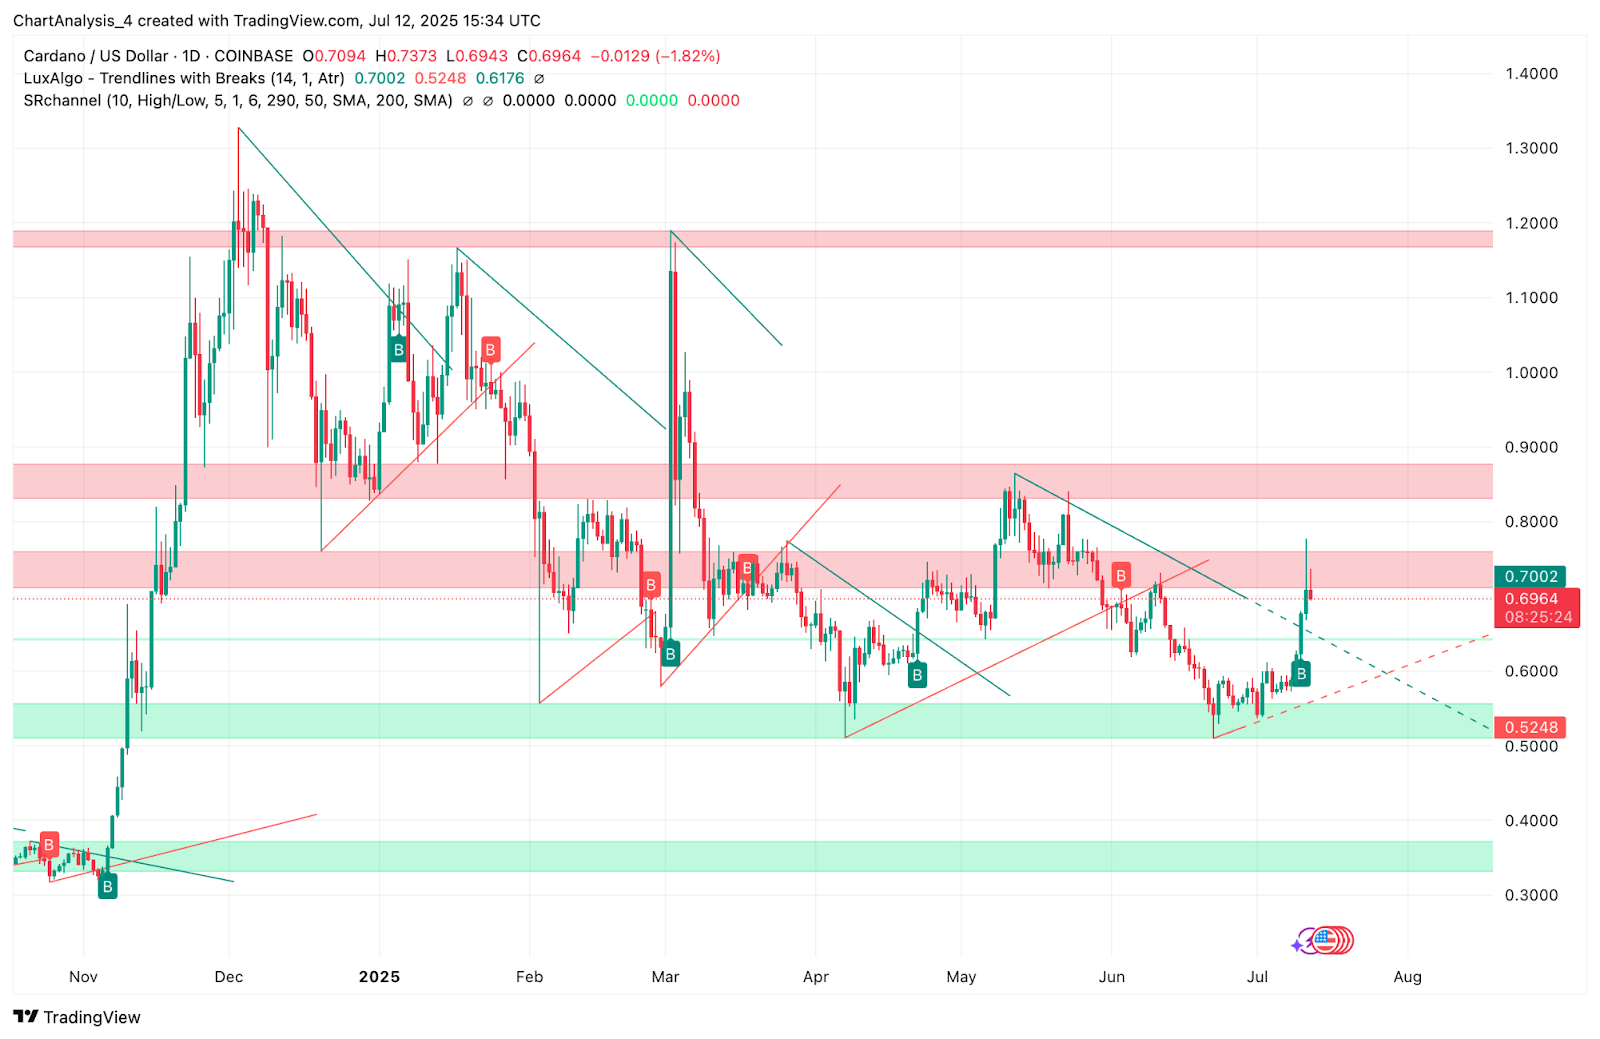
Price action on the daily timeframe shows a clear Break of Structure (BOS) above prior highs, validating bullish control. Still, the rejection from the red Smart Money Concepts (SMC) order block between $0.74 and $0.80 suggests that a stronger base is needed before continuation.
Why Is The Cardano Price Going Down Today?
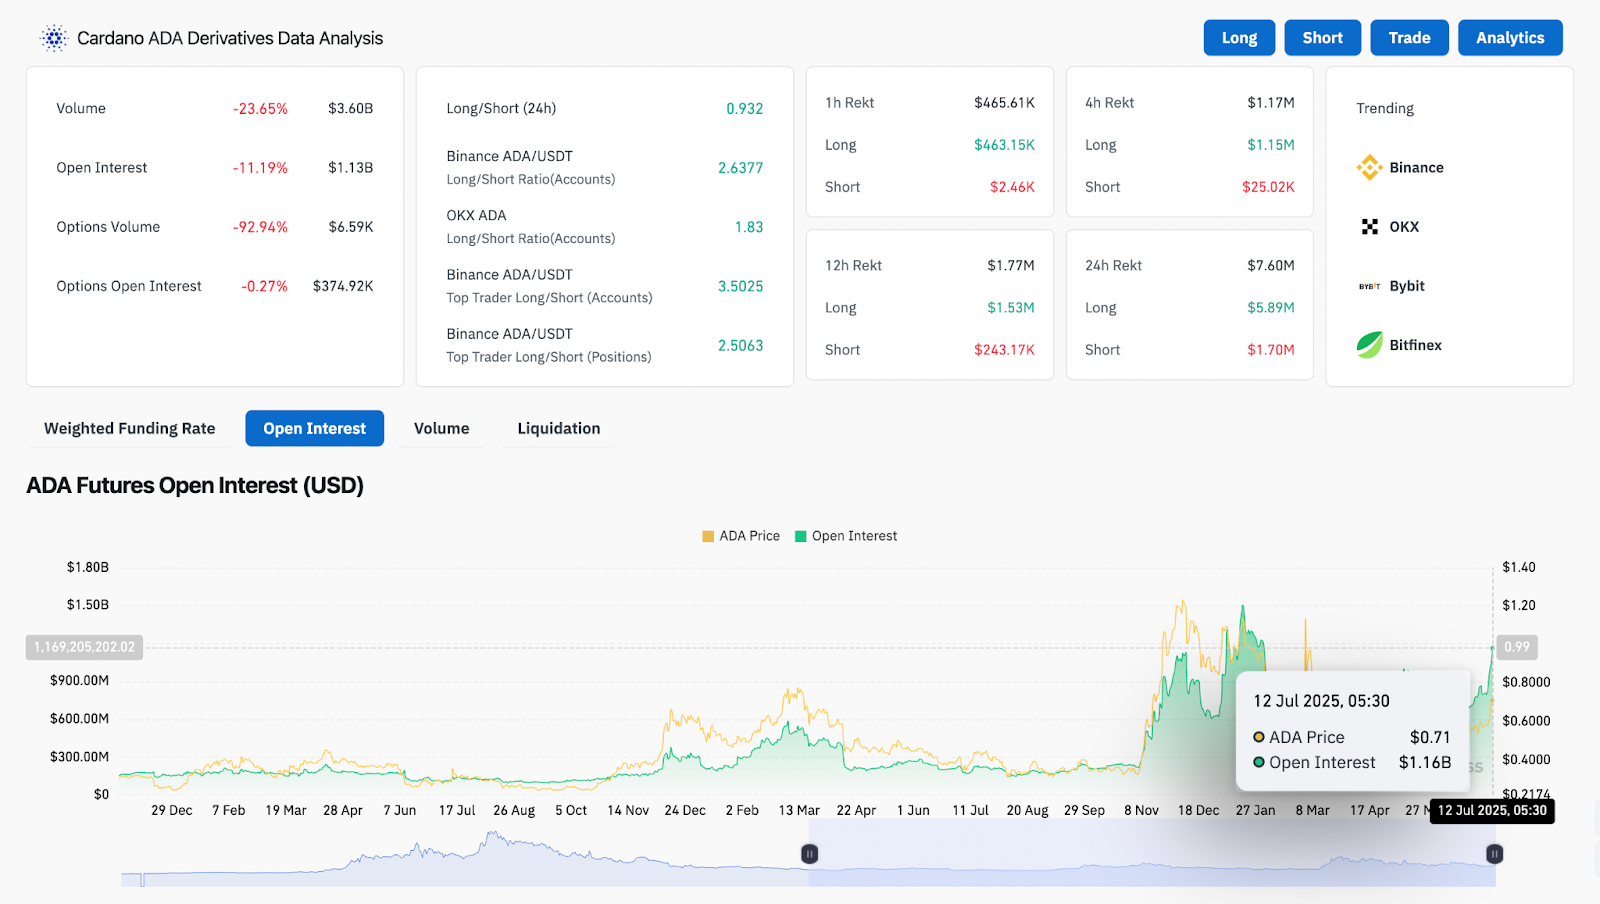
The short-term answer to why Cardano price going down today lies in intraday exhaustion and declining derivatives activity. Data from Coinglass shows that ADA’s open interest fell by 11.2% to $1.13B, while daily volume plunged 23.65% to $3.6B. This reflects profit-taking behavior and reduced leverage exposure following the surge.
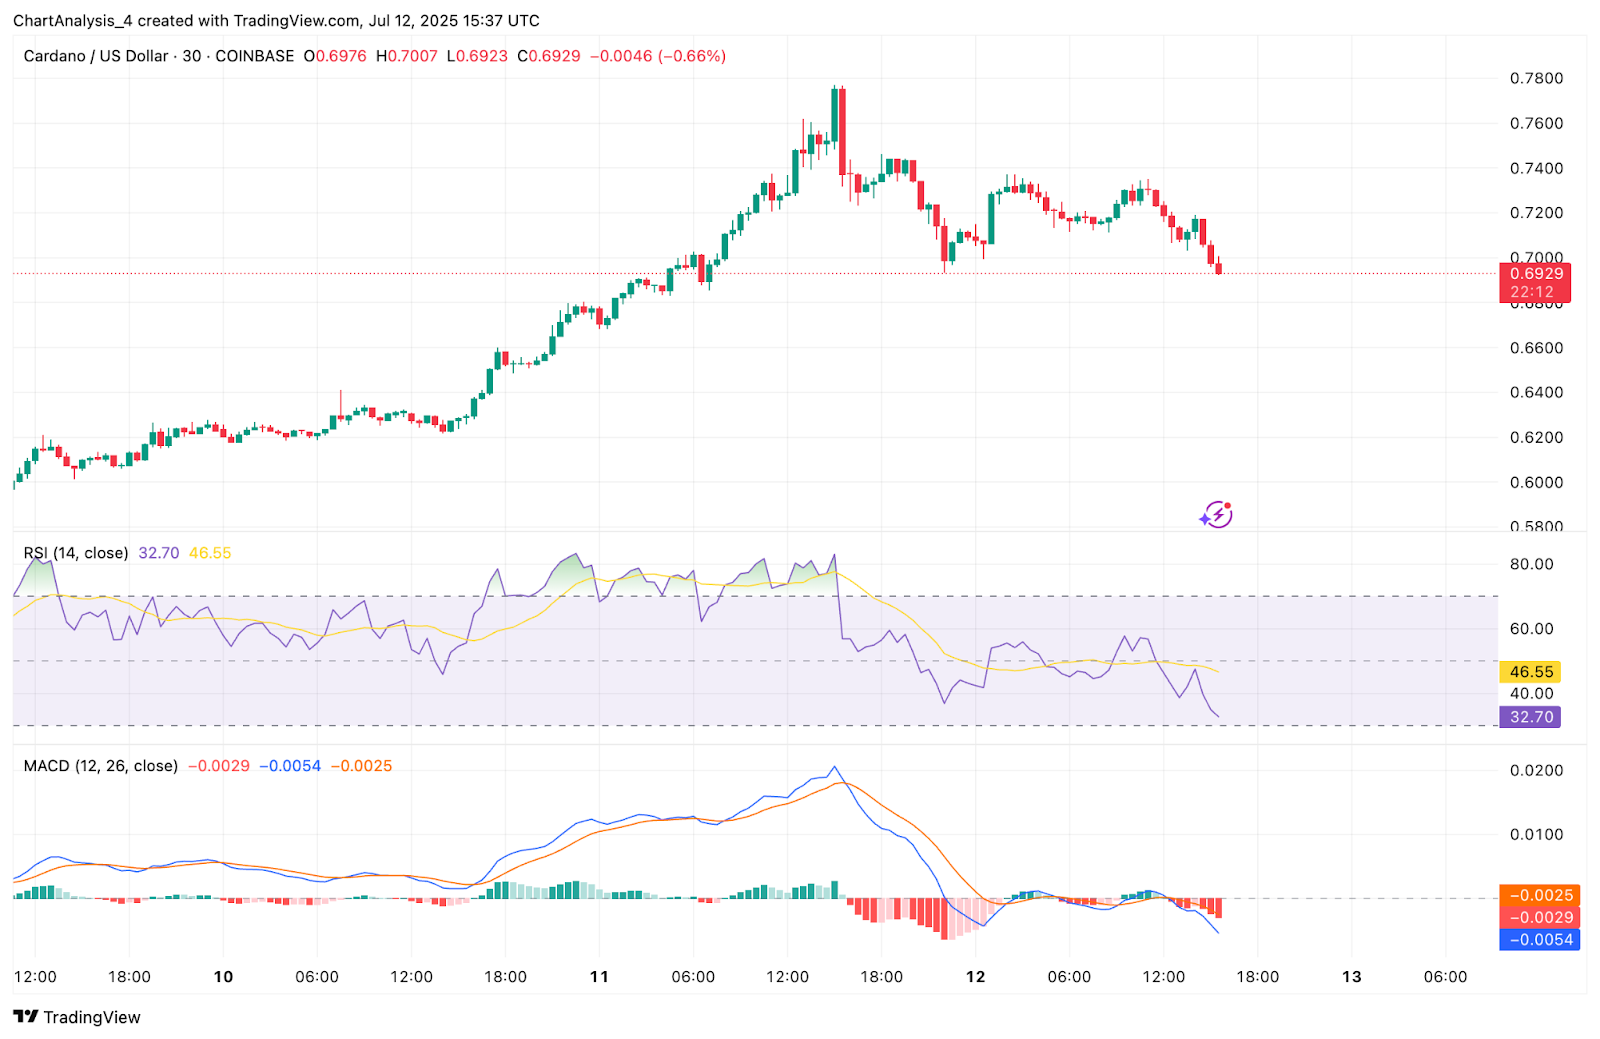
On the 30-minute chart, Cardano price action reveals a lower high structure with RSI falling to 32.70 — brushing against oversold territory. The MACD histogram is also in bearish alignment, with no crossover signal, pointing to continued short-term weakness.
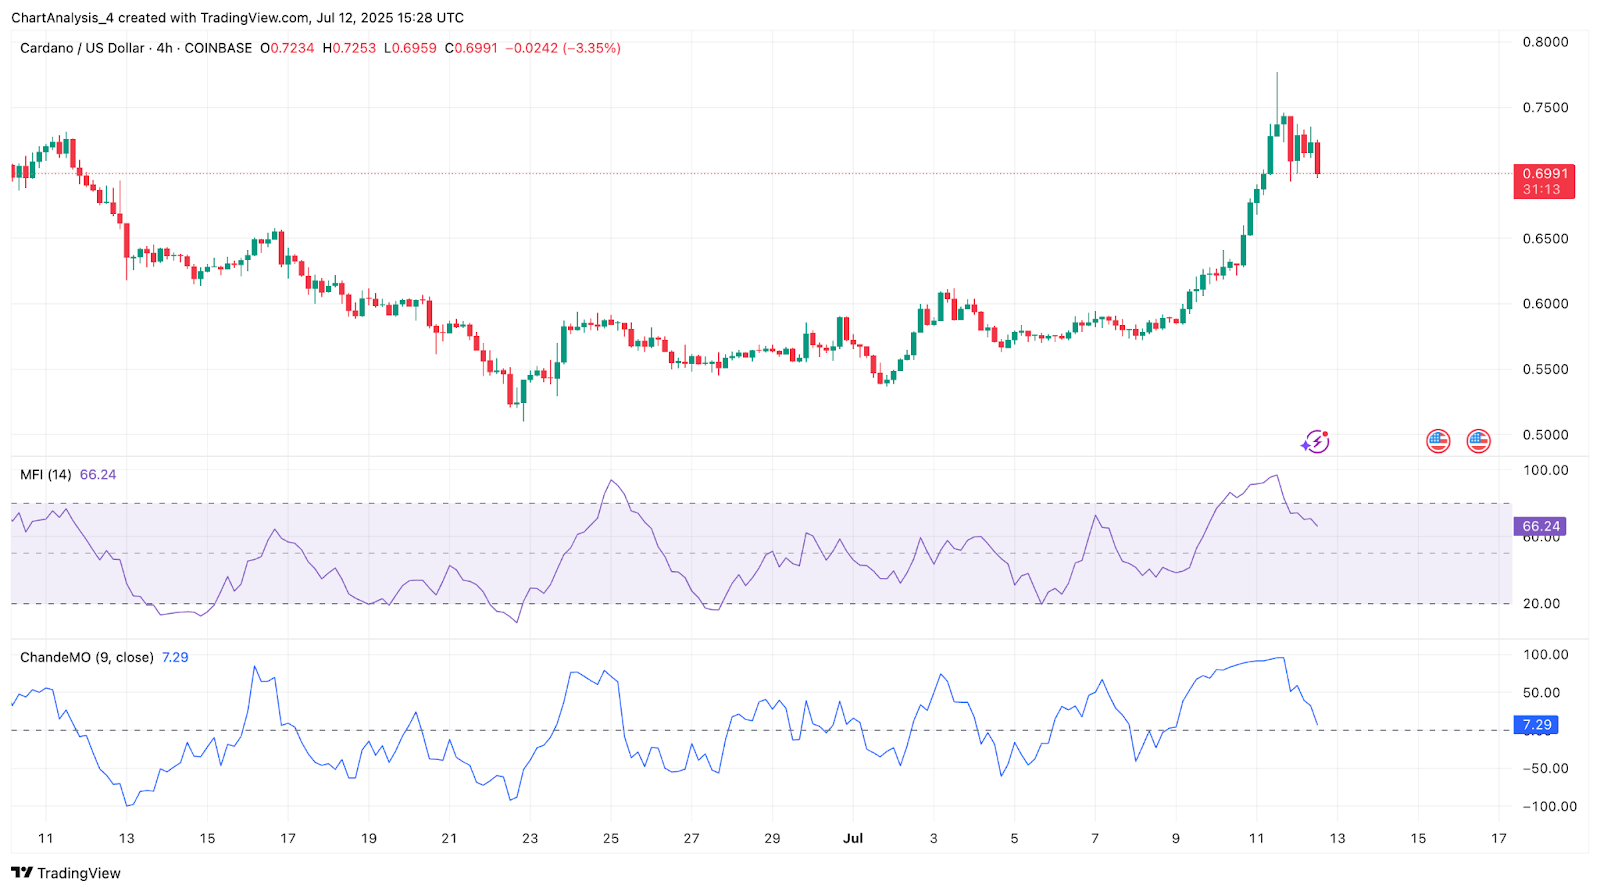
Chande Momentum Oscillator (ChandeMO) on the 4-hour chart has dropped to 7.29 from prior highs near 60, confirming the fading strength of buyers. Despite this, the Money Flow Index (MFI) still reads at 66.24, suggesting that capital inflow remains moderately elevated.
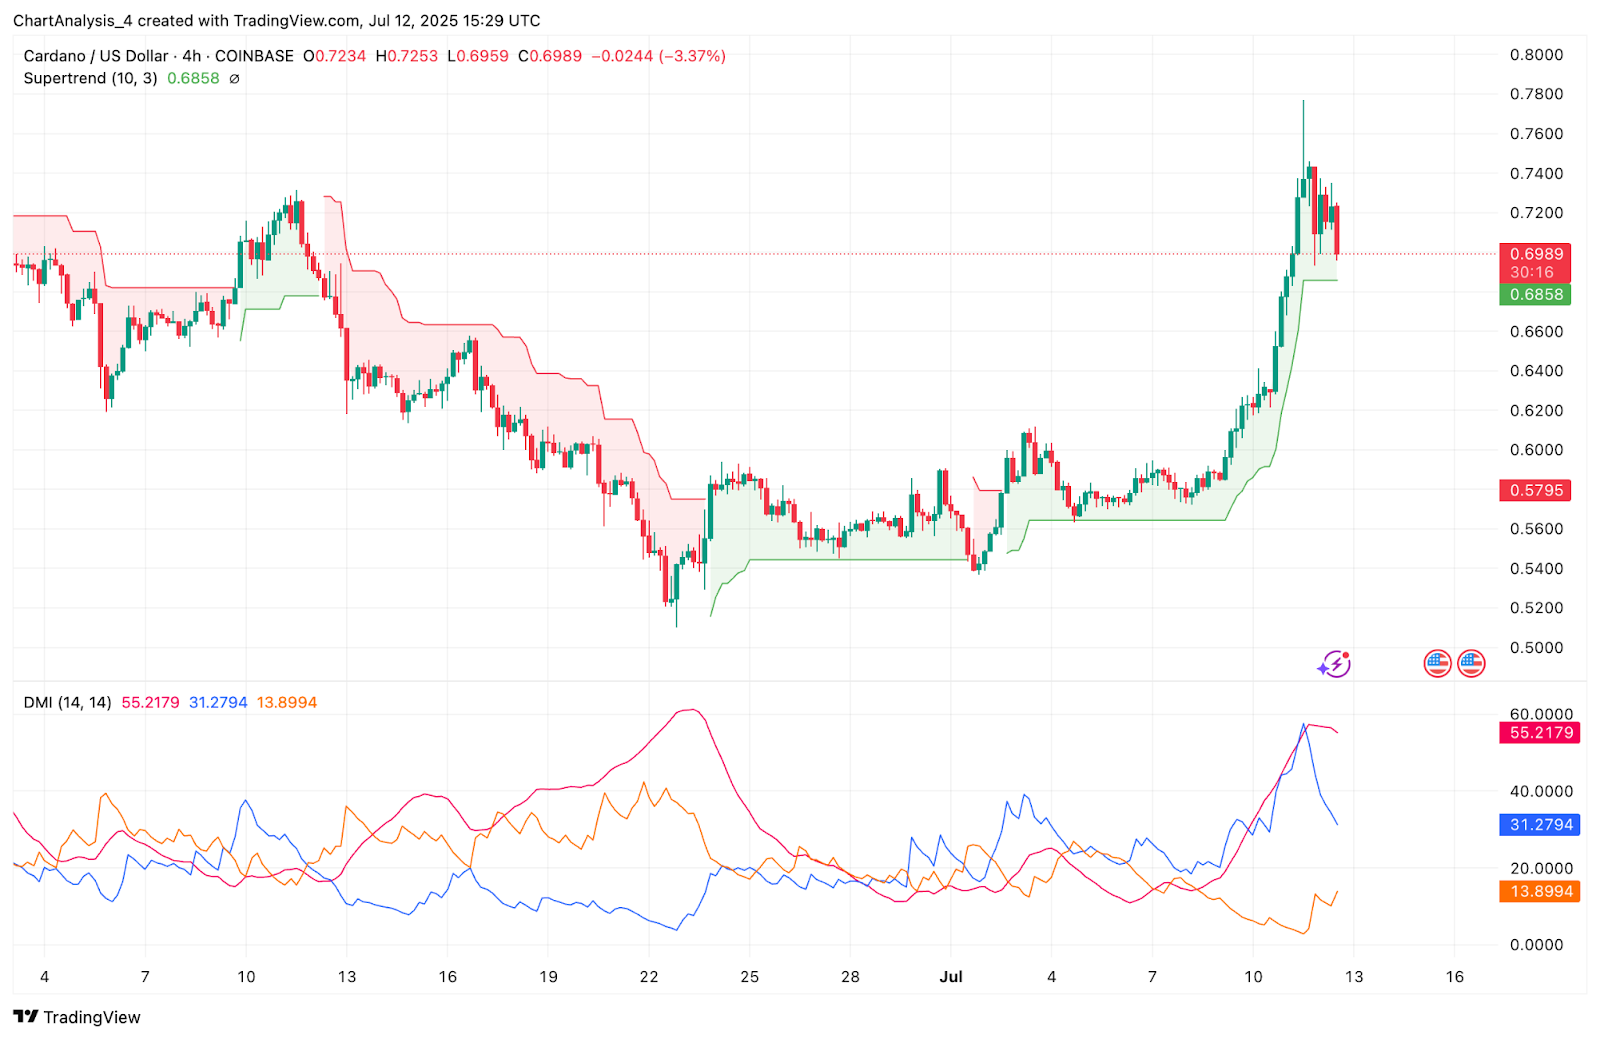
The directional movement index (DMI) shows -DI beginning to rise as +DI curls down, with ADX still above 50 — a signal of potential trend slowdown, not yet reversal.
Cardano Price Prediction: Short-Term Outlook (24H)
In the next 24 hours, bulls are likely to defend the $0.6800–$0.6850 region, supported by the Supertrend and Bollinger Band median. If this zone holds, a bounce toward $0.72 could follow, with potential retest of $0.7367 — the Fibonacci extension high.
However, failure to hold $0.68 could drag Cardano price toward $0.6679 (R5 pivot), followed by $0.6250, which aligns with prior structure and the PF1 monthly pivot.
Momentum indicators suggest caution in the immediate term, but unless price loses the $0.6150–$0.6200 cluster, the uptrend remains technically intact. Traders should monitor volume recovery, MACD crossover signals, and Supertrend confirmation for renewed upside.
Cardano Price Forecast Table: July 13, 2025
| Indicator/Zone | Level / Signal |
| Cardano price today | $0.699 |
| Resistance 1 | $0.7367 (Fibonacci PF1.1R) |
| Resistance 2 | $0.7678 (Upper Bollinger Band) |
| Support 1 | $0.6804 (20 EMA, Supertrend Flip) |
| Support 2 | $0.6679 (R5 Pivot) |
| RSI (30-min) | 32.70 (Oversold zone) |
| MACD (30-min) | Bearish, no crossover yet |
| MFI (4H) | 66.24 (moderately strong inflow) |
| ChandeMO (4H) | 7.29 (cooling momentum) |
| EMA Cluster (4H) | 20/50/100/200 all stacked bullish |
| DMI (4H) | ADX 55, weakening +DI |
| Derivatives Open Interest | -11.2%, showing cooldown |
Disclaimer: The information presented in this article is for informational and educational purposes only. The article does not constitute financial advice or advice of any kind. Coin Edition is not responsible for any losses incurred as a result of the utilization of content, products, or services mentioned. Readers are advised to exercise caution before taking any action related to the company.

 Price Prediction: Can Bulls Sustain Above $2,100?")


