 Price Prediction for July 19")
Cardano price today is hovering around $0.87 after staging a strong breakout above a long-standing descending trendline. This move follows a steep rally from the $0.55 level, with price structure turning decisively bullish across short and mid-term timeframes. The breakout has brought renewed attention to Cardano price action, as traders assess whether ADA can reclaim higher zones from early 2024.
What’s Happening With Cardano’s Price?
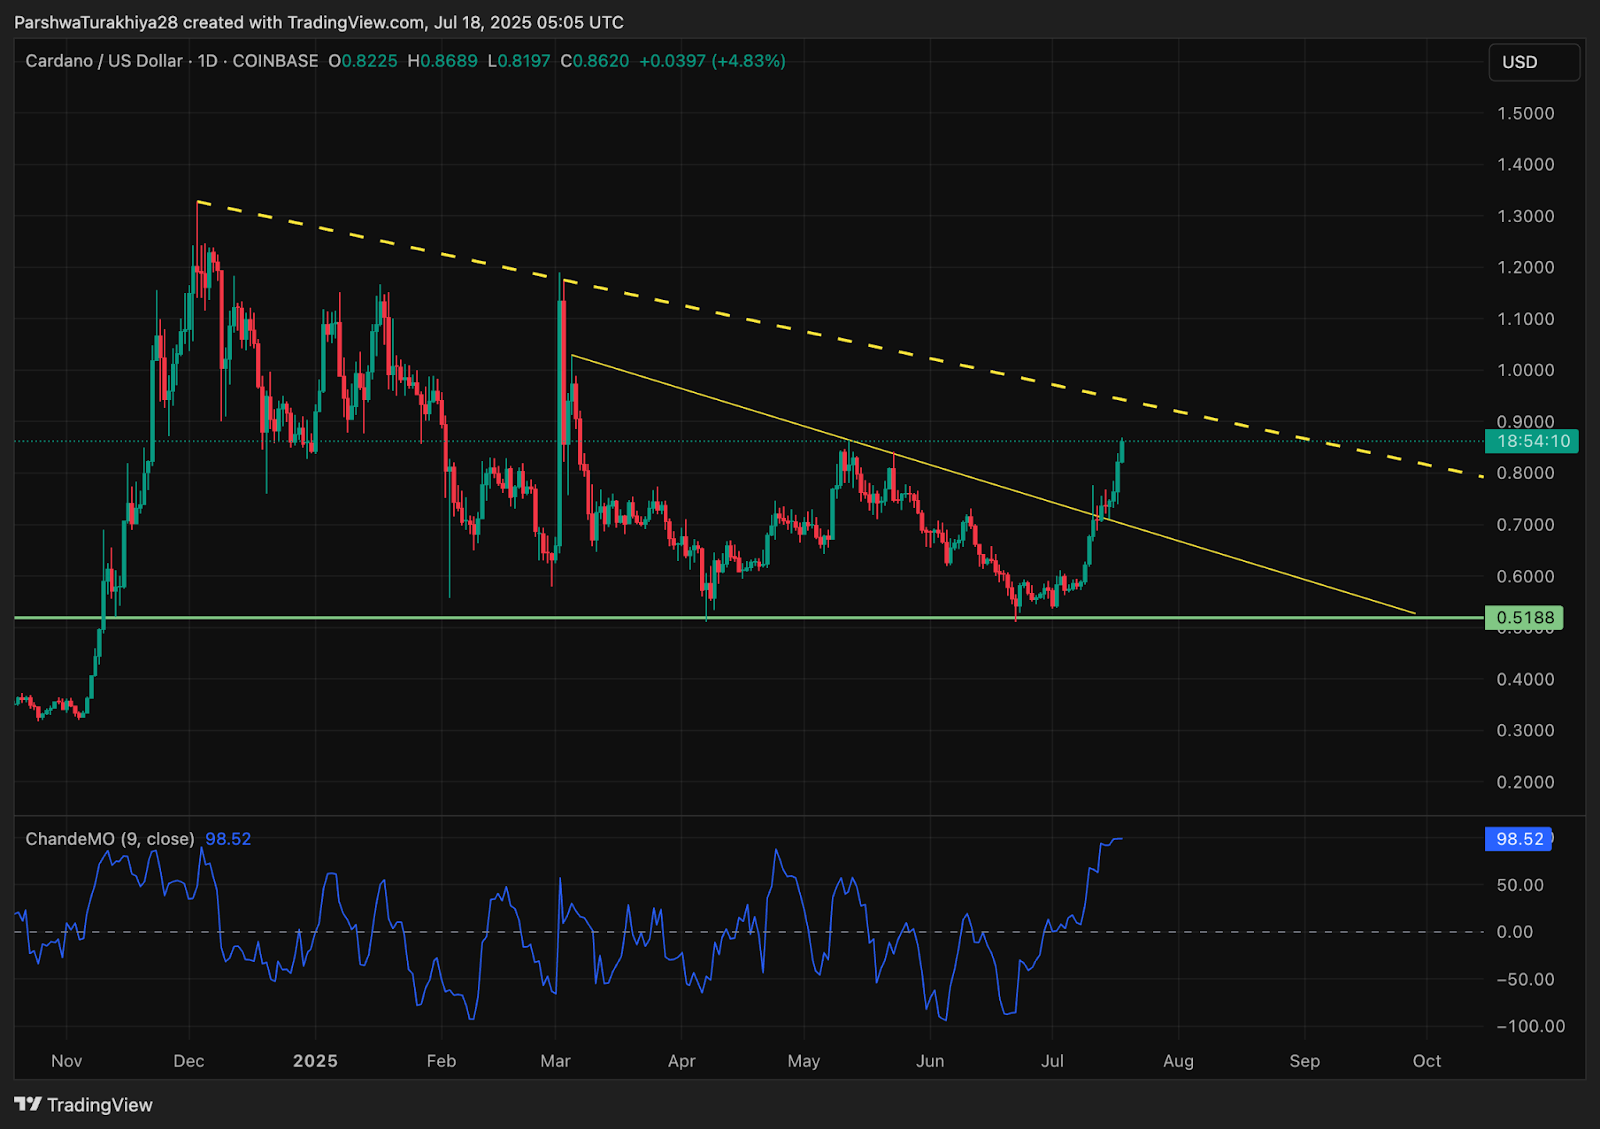
On the daily chart, Cardano price has broken above a descending trendline that had acted as resistance since the start of 2025. The clean breakout above $0.75, followed by bullish candles closing above $0.80, confirms that bulls have regained momentum.
The Chande Momentum Oscillator is at 98.52, reflecting strong upside momentum. On the 4-hour timeframe, Cardano price action is aligned above all exponential moving averages. The 20 EMA at $0.78 is now the closest dynamic support, while the 200 EMA sits far below at $0.66, confirming bullish control. Bollinger Bands are also widening, with ADA riding the upper band which is a common sign of trend continuation.
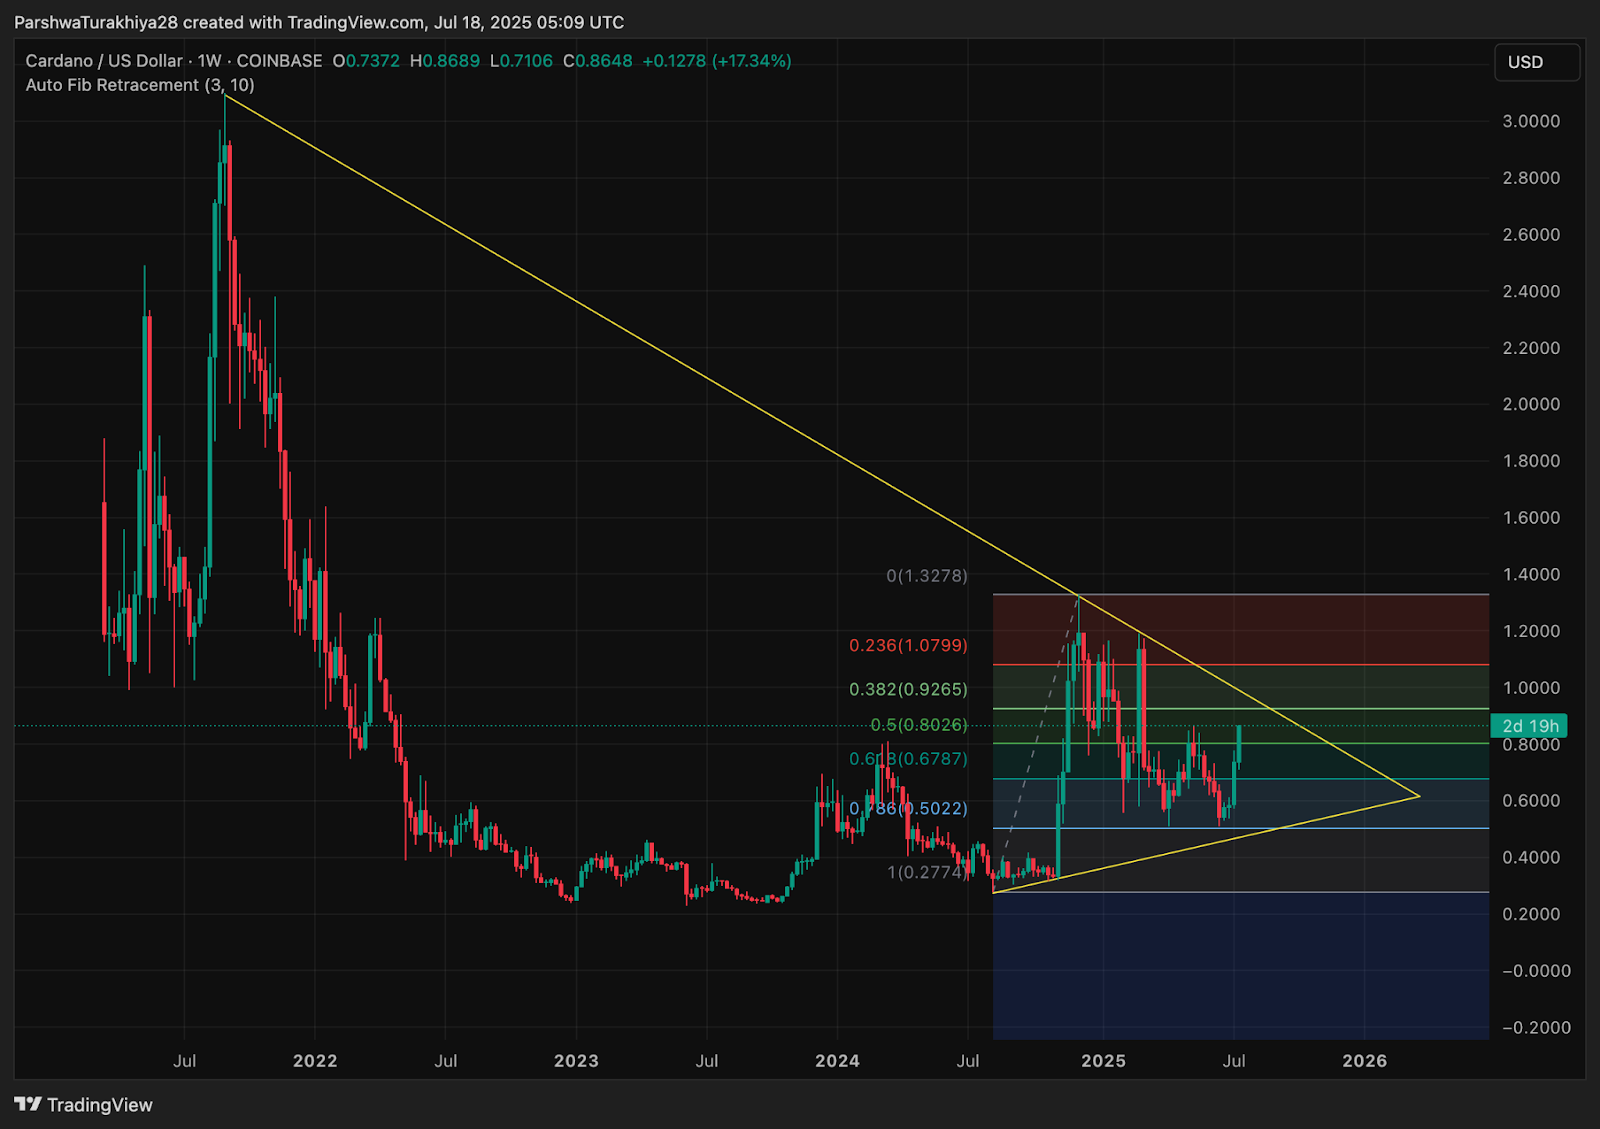
Fibonacci retracement levels (Weekly chart) drawn from the $1.32 swing high to the $0.27 low highlight that ADA is now trading above the 0.618 zone at $0.86. A push toward the 0.382 and 0.236 zones at $0.9265 and $1.0799 may come next if volume remains strong.
From the weekly perspective, ADA has bounced off triangle support and is attempting to reclaim long-term resistance near $0.92. This level coincides with early March’s rejection zone and could act as the next major hurdle for bulls.
Why Is The Cardano Price Going Up Today?
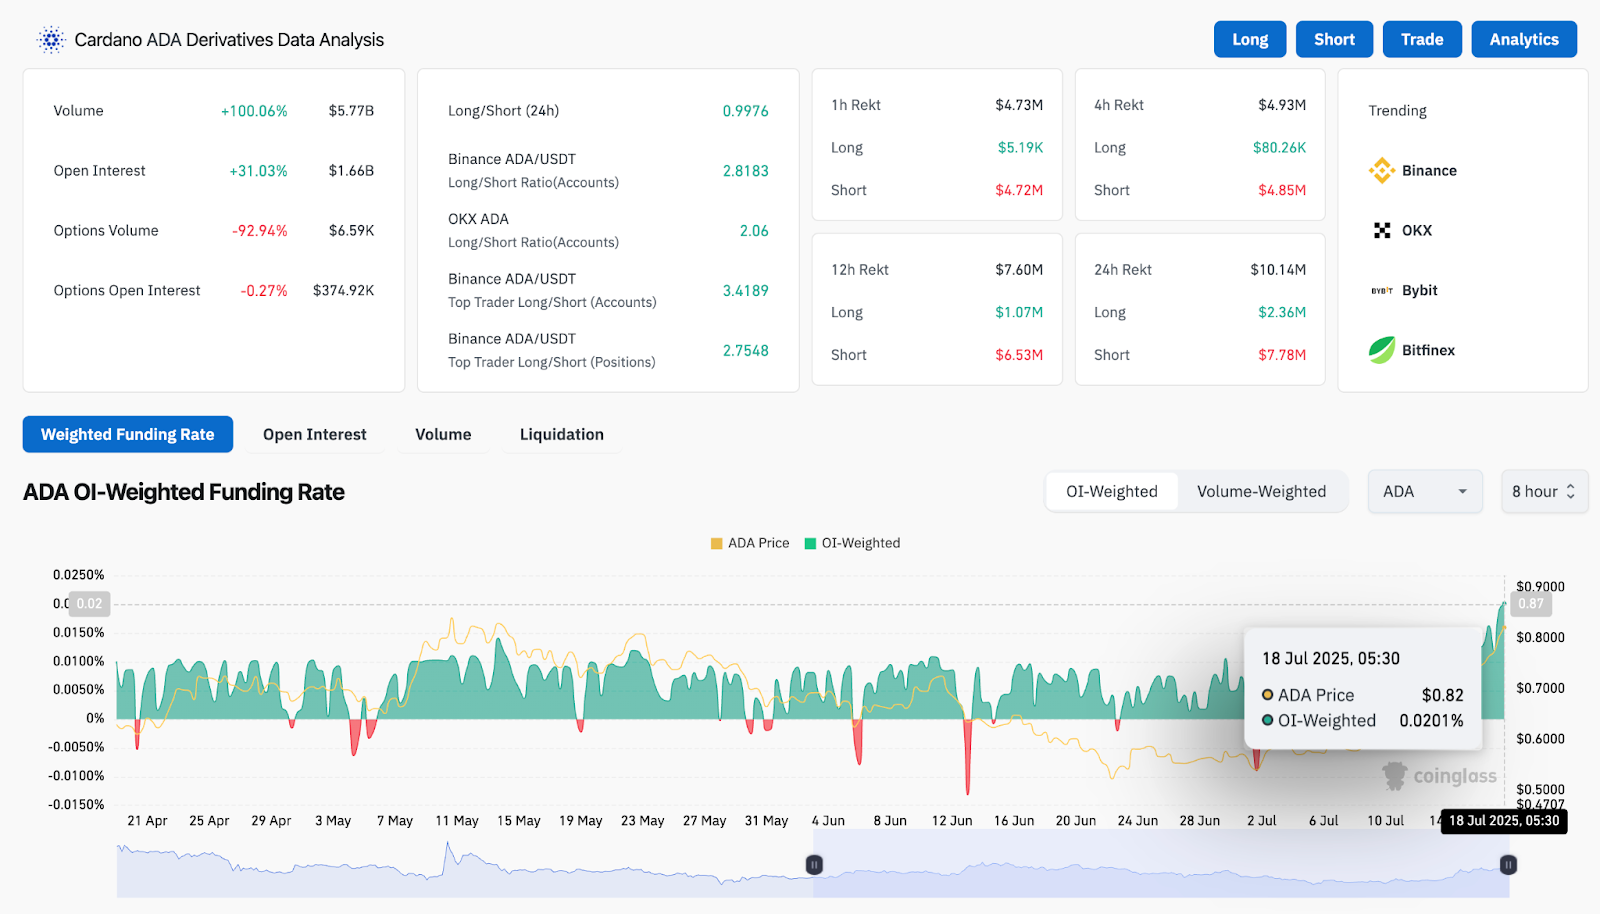
One of the main drivers of Cardano price spikes is the sharp rise in derivatives interest. According to Coinglass, ADA’s open interest has jumped over 31% in the last 24 hours to reach $1.66 billion. Volume also saw a 100% increase, climbing to $5.77 billion. The long/short ratio shows strong bullish sentiment, with Binance top traders positioned 3.41-to-1 on the long side. This is a significant indicator of speculative optimism surrounding Cardano price today.
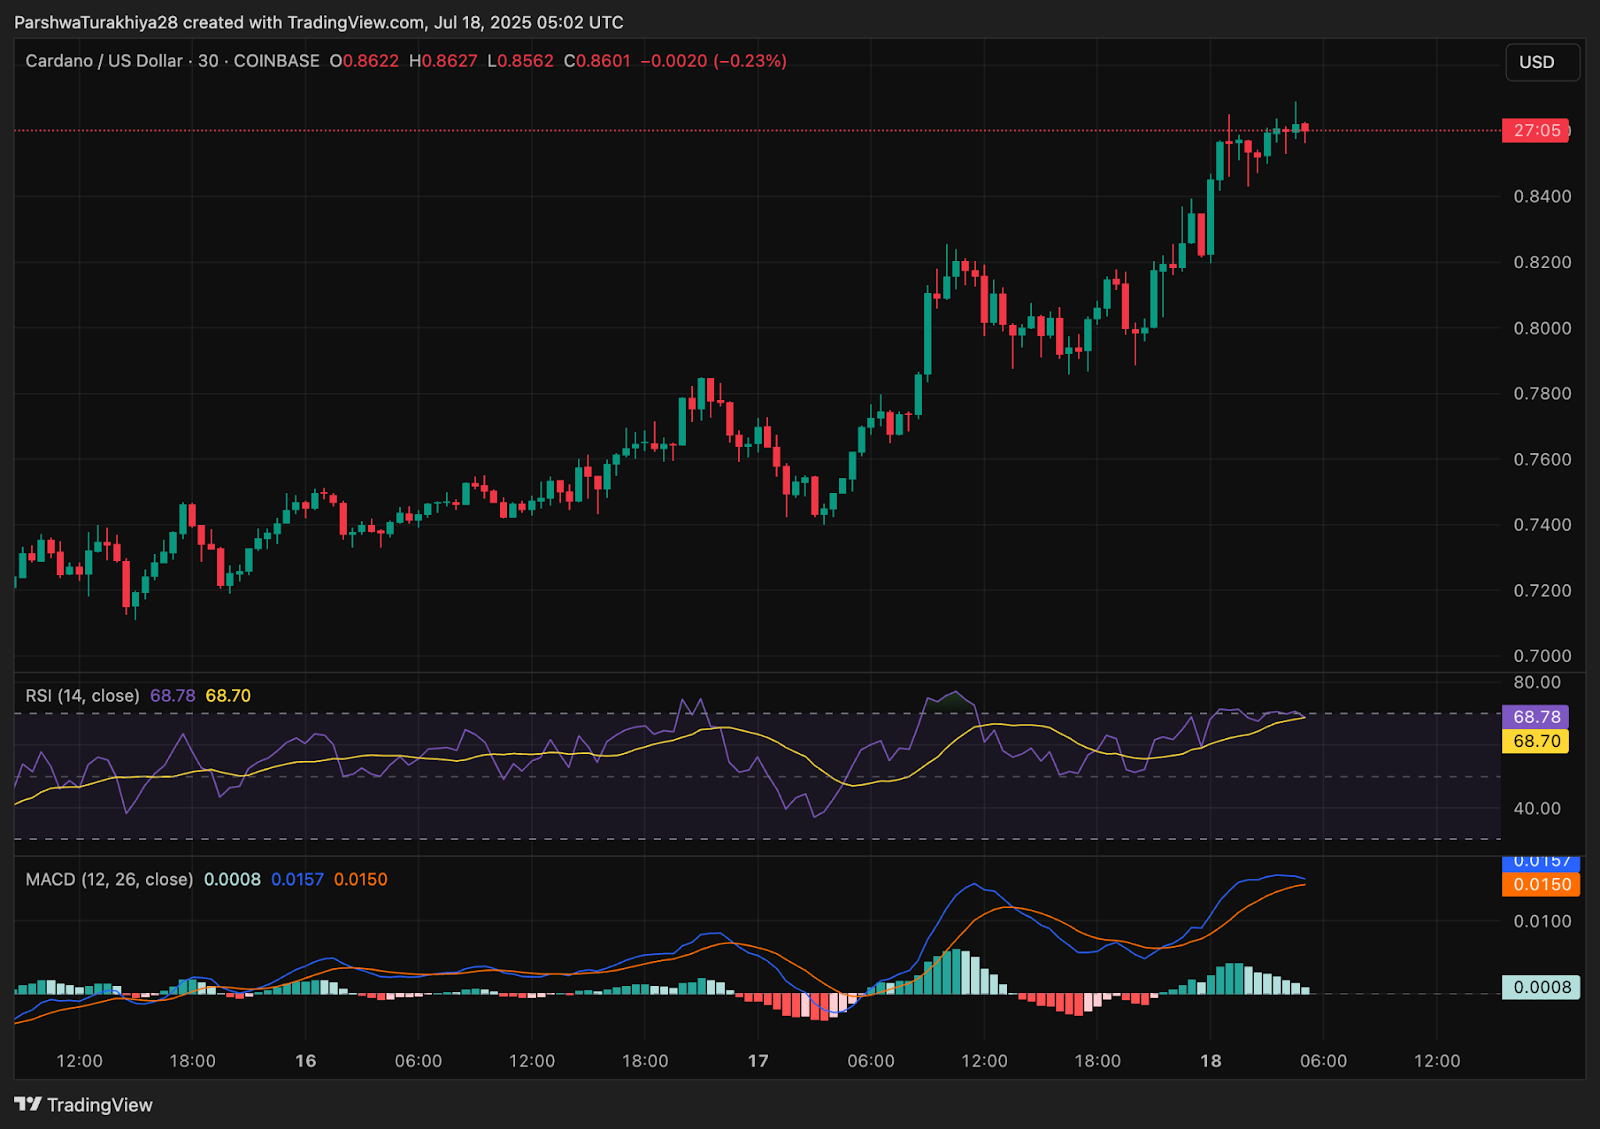
On the intraday 30-minute chart, the RSI is nearing 69, just below overbought territory. This suggests strong momentum but still leaves room for further upside. MACD shows a bullish crossover with the histogram staying positive. Together, these indicators support the current rally, which appears to be backed by real demand rather than a short-term squeeze.
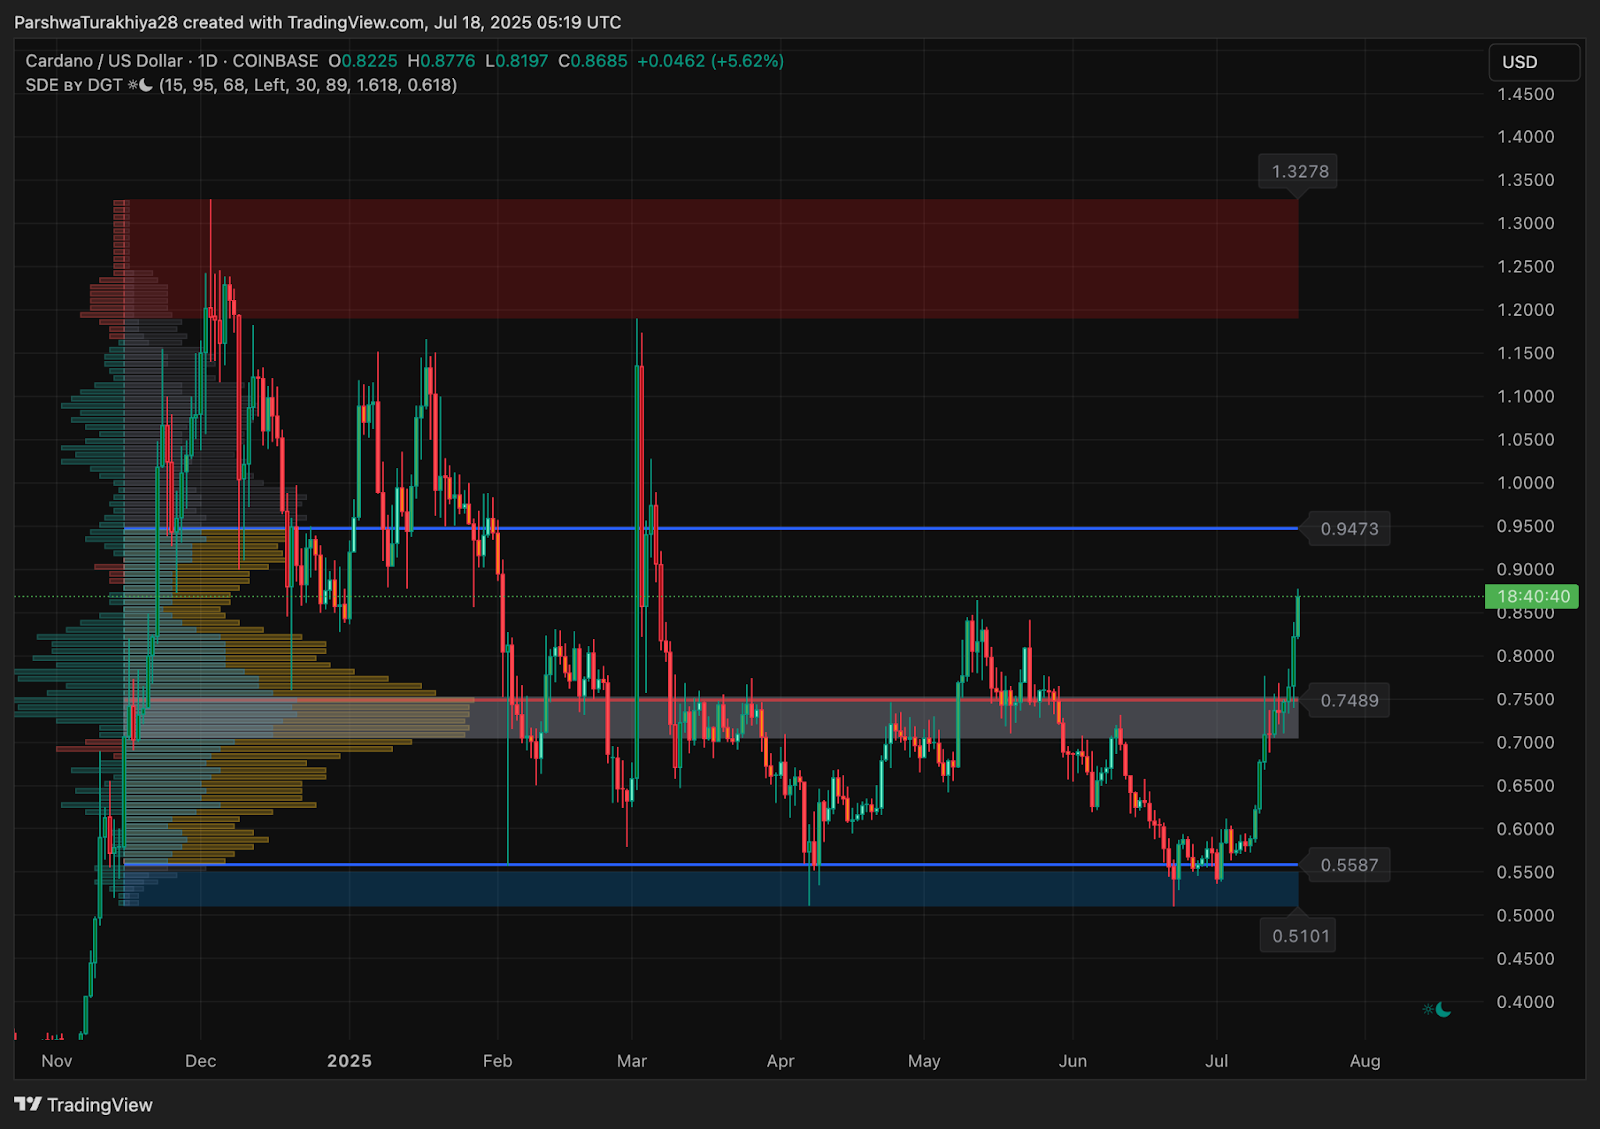
Volume profile analysis shows that ADA has reclaimed the $0.7489 high-volume node. This region had acted as resistance since May and is now likely to serve as support. The next key level lies at $0.9473, a volume shelf that coincides with February’s breakdown level.
Bollinger Bands, EMAs, and Volume Profile Reinforce Bullish Structure
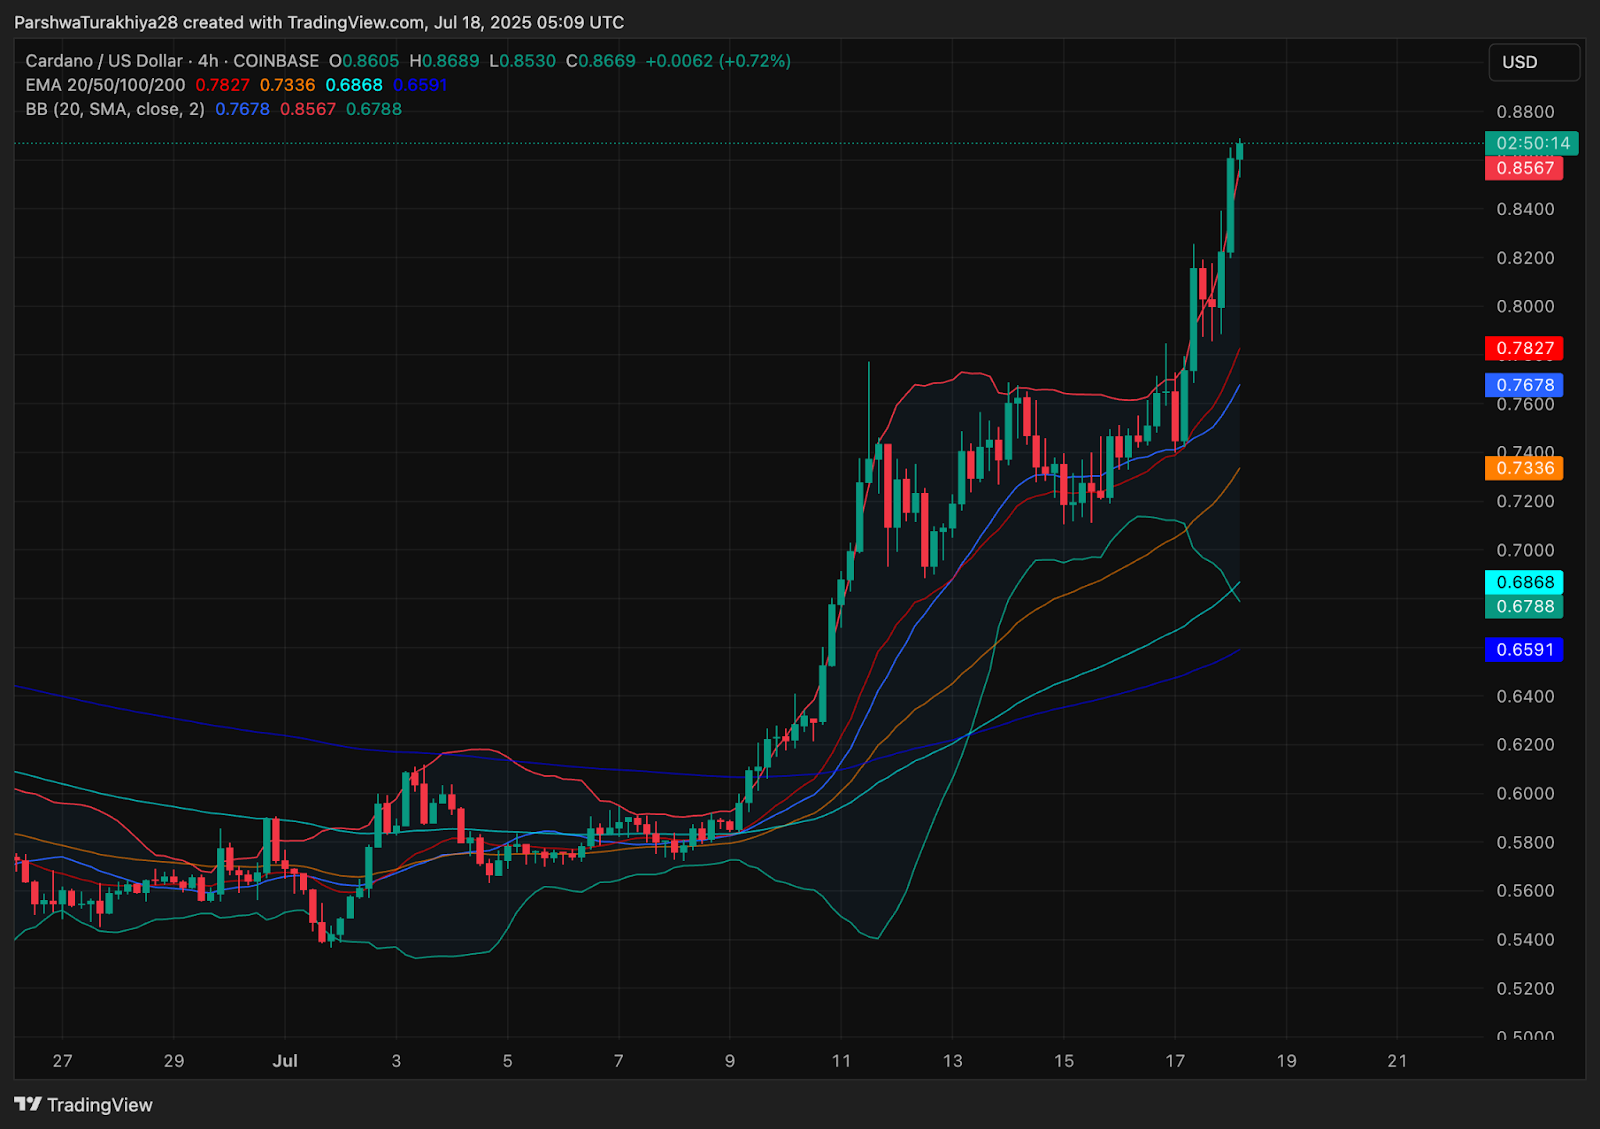
Cardano price volatility is expanding as seen in the 4-hour Bollinger Bands. Price is hugging the upper band, while all EMA levels, including the 20, 50, 100, and 200, are aligned below the current price. This setup is often associated with strong bullish continuation.
Despite a drop in options volume, the rise in spot volume and perpetual open interest reflects active participation from leveraged and unleveraged traders. The OI-weighted funding rate remains slightly positive, showing that long positions are dominant but not overcrowded.
If bulls hold ADA above $0.85 on a closing basis, a continuation toward the $0.90 and $0.95 resistance zones appears likely. A breakout beyond $0.95 could put the $1.08–$1.10 zone into play, especially if overall market sentiment remains risk-on.
ADA Price Prediction: Short-Term Outlook (24H)
The short-term outlook for Cardano price remains bullish as long as ADA holds above the $0.82–$0.84 support band. In the next 24 hours, a push toward $0.90 and a test of $0.9473 appears probable. If momentum extends and volume increases further, the breakout could target $1.08.
On the downside, support lies at $0.82, followed by $0.7489. A break below this zone would weaken the bullish outlook and risk a move back toward the 50 EMA near $0.68. However, current momentum, derivatives positioning, and price structure suggest continuation is more likely than correction.
Cardano Price Forecast Table: July 19, 2025
| Indicator/Zone | Level / Signal |
| Cardano price today | $0.8685 |
| Resistance 1 | $0.90 |
| Resistance 2 | $0.9473 |
| Support 1 | $0.82 |
| Support 2 | $0.7489 |
| RSI (30-min) | 68.78 (Bullish momentum) |
| MACD (30-min) | Bullish crossover |
| ChandeMO (Daily) | 98.52 (High upside momentum) |
| Bollinger Bands (4H) | Upper band expansion, bullish bias |
| EMA Cluster (4H) | All below price, 20 EMA at $0.7827 |
| Volume Profile Zone | $0.7489 (Key breakout reclaim) |
| Fib Resistance Levels | $0.9265, $1.0799 |
| Open Interest | $1.66B (+31.03%) |
| Binance Top Trader Ratio | 3.41 (Heavy long positioning) |
Disclaimer: The information presented in this article is for informational and educational purposes only. The article does not constitute financial advice or advice of any kind. Coin Edition is not responsible for any losses incurred as a result of the utilization of content, products, or services mentioned. Readers are advised to exercise caution before taking any action related to the company.


