 Price Prediction for June 20, 2025")
The Cardano price is currently trading at $0.5978, down 0.17% intraday as sellers continue to dominate short-term price action. ADA is sitting just above a critical demand region between $0.588 and $0.615, which has acted as a liquidity pocket in recent weeks.
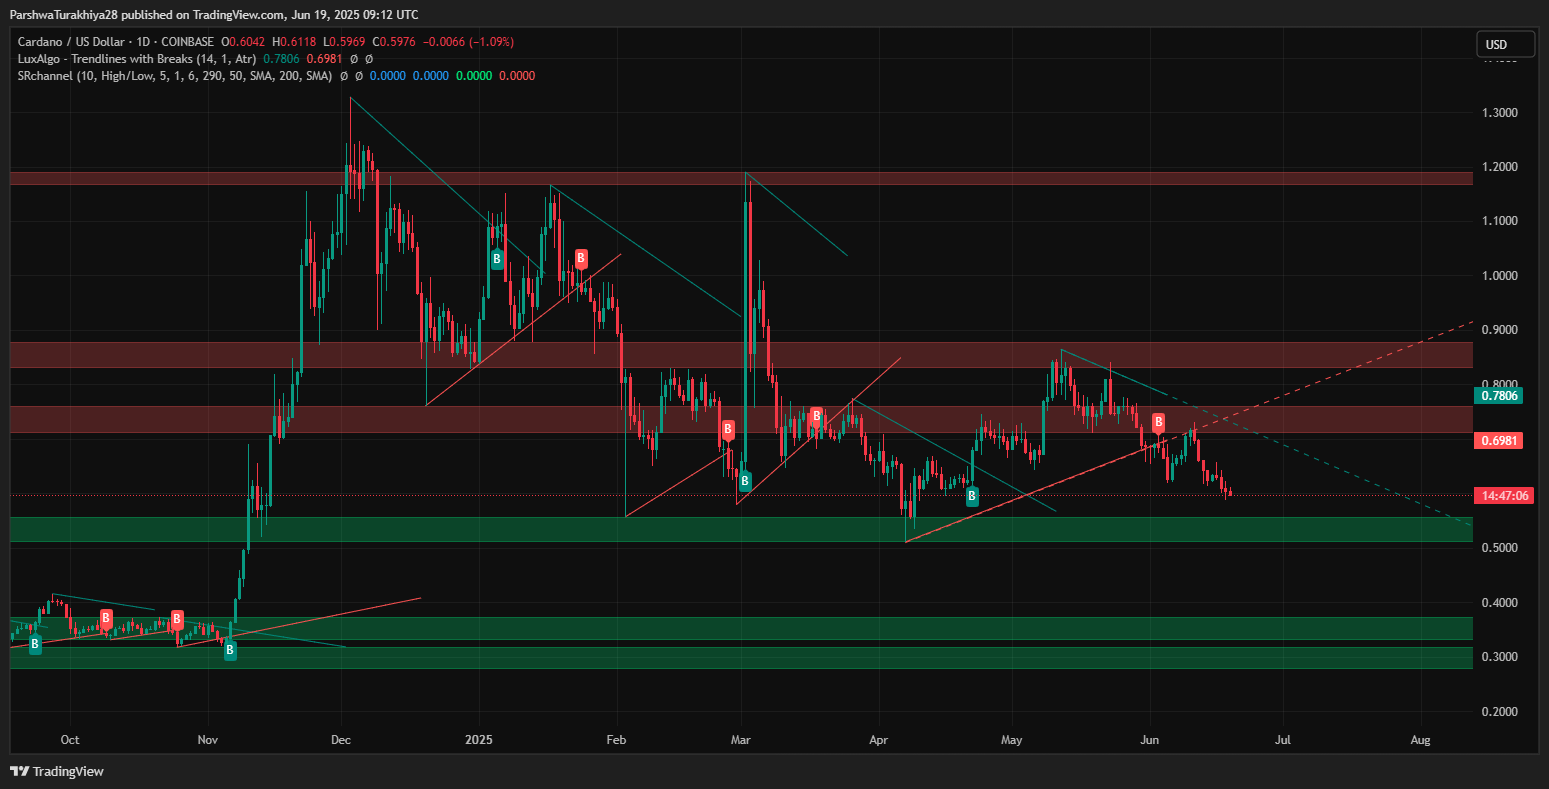
The broader downtrend remains intact as bulls fail to reclaim the 20/50 EMA cluster, while the Cardano price volatility continues to tighten, reflecting indecision.From a macro structure, ADA is now approaching a make-or-break zone. Price is holding the lower bound of the key volume profile range, while rejection from the $0.69–$0.70 resistance zone has strengthened bearish conviction.
What’s Happening With Cardano’s Price?
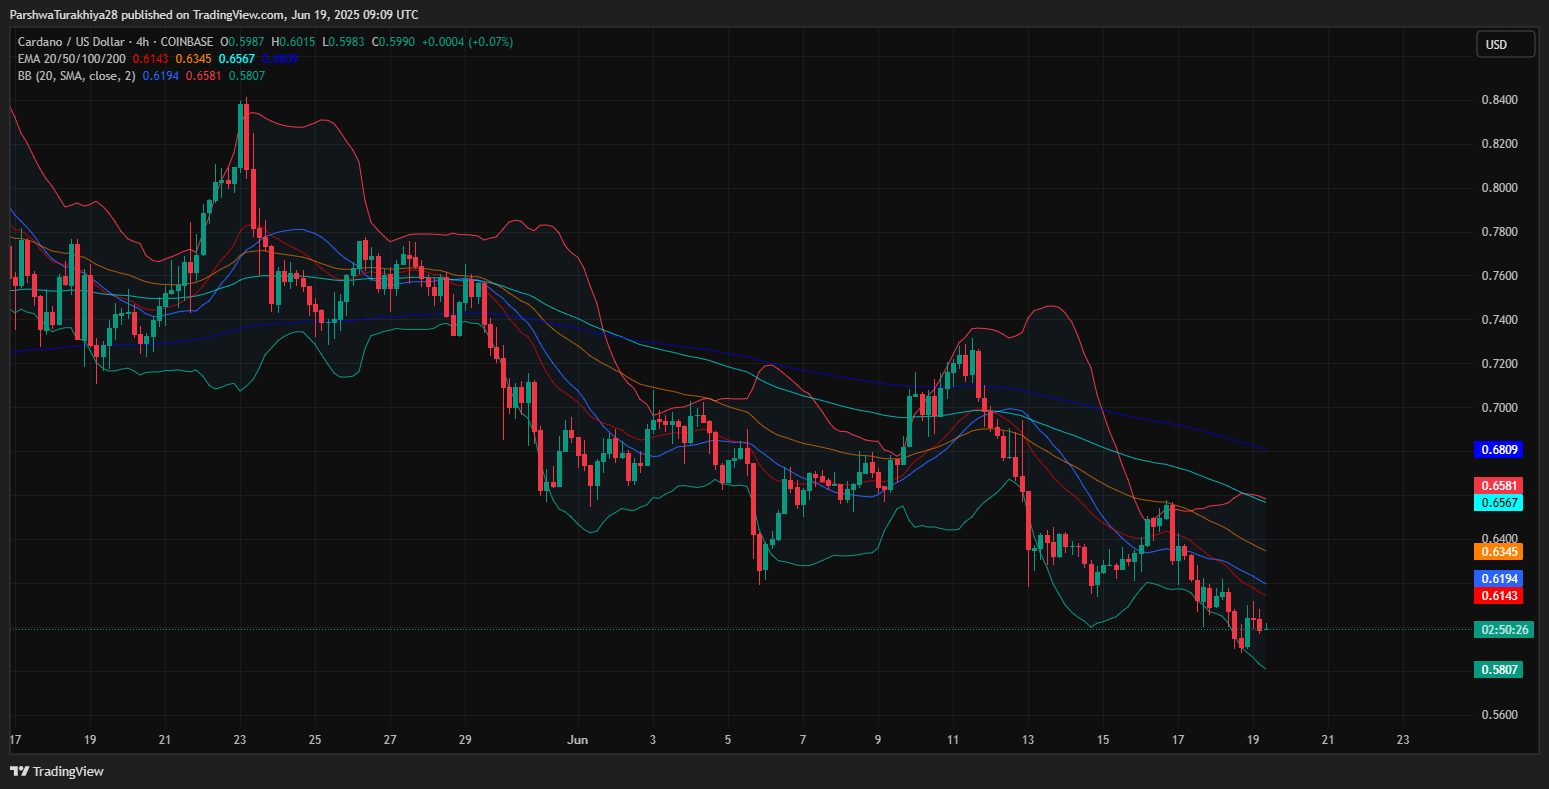
The 4-hour chart reflects a persistent downtrend, marked by successive rejections from the Supertrend and declining EMAs. Price action remains confined below all dynamic averages (20/50/100/200 EMA), with the 200 EMA near $0.6809 acting as the upper boundary of the bearish channel. The Cardano price update shows that momentum remains weak, with no major bullish divergence detected across short-term timeframes.
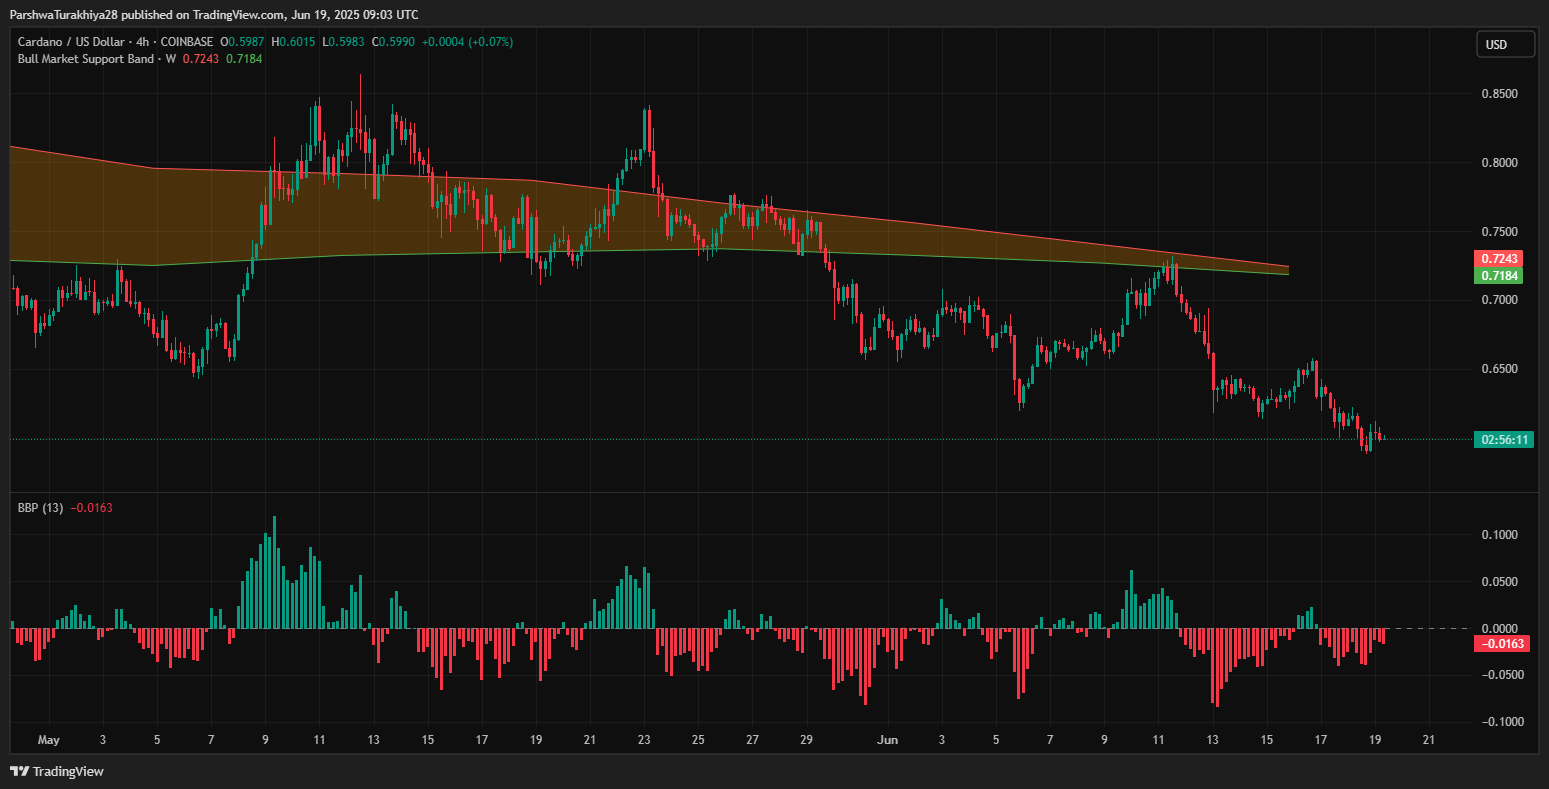
The Bollinger Bands are contracting, and the price is walking along the lower band, indicating a persistent grind lower. Meanwhile, the BBP (Bull Bear Power) is negative at -0.0163, highlighting sustained bearish dominance.
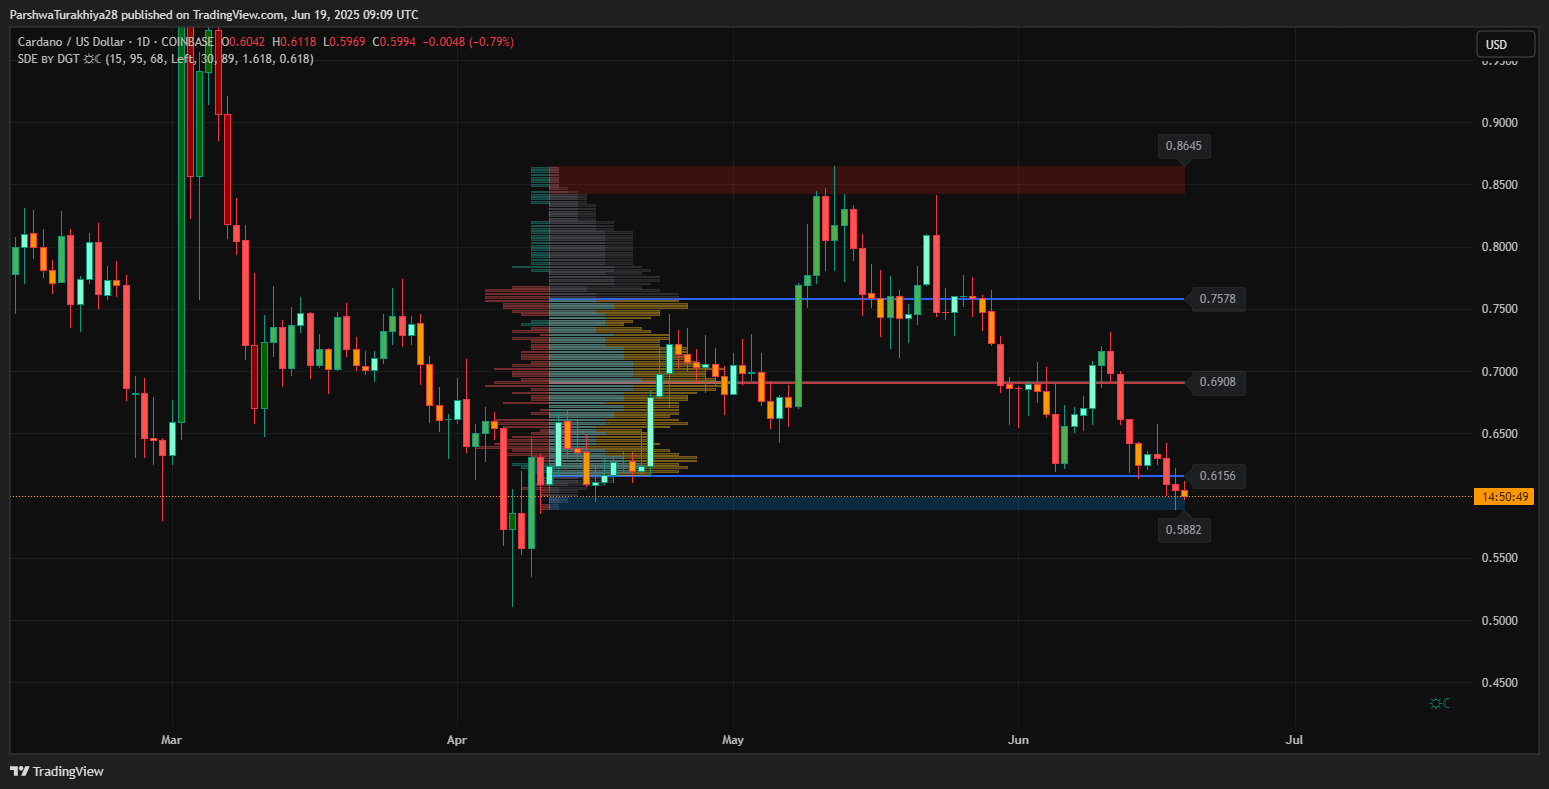
On the 1-day volume profile, the Value Area Low aligns around $0.6156, which is now acting as near-term resistance. Below lies the high-volume node between $0.588 and $0.602—this is where bulls must hold to avoid a deeper pullback toward the $0.55–$0.53 zone.
Why is Cardano (ADA) Price Going Down Today?
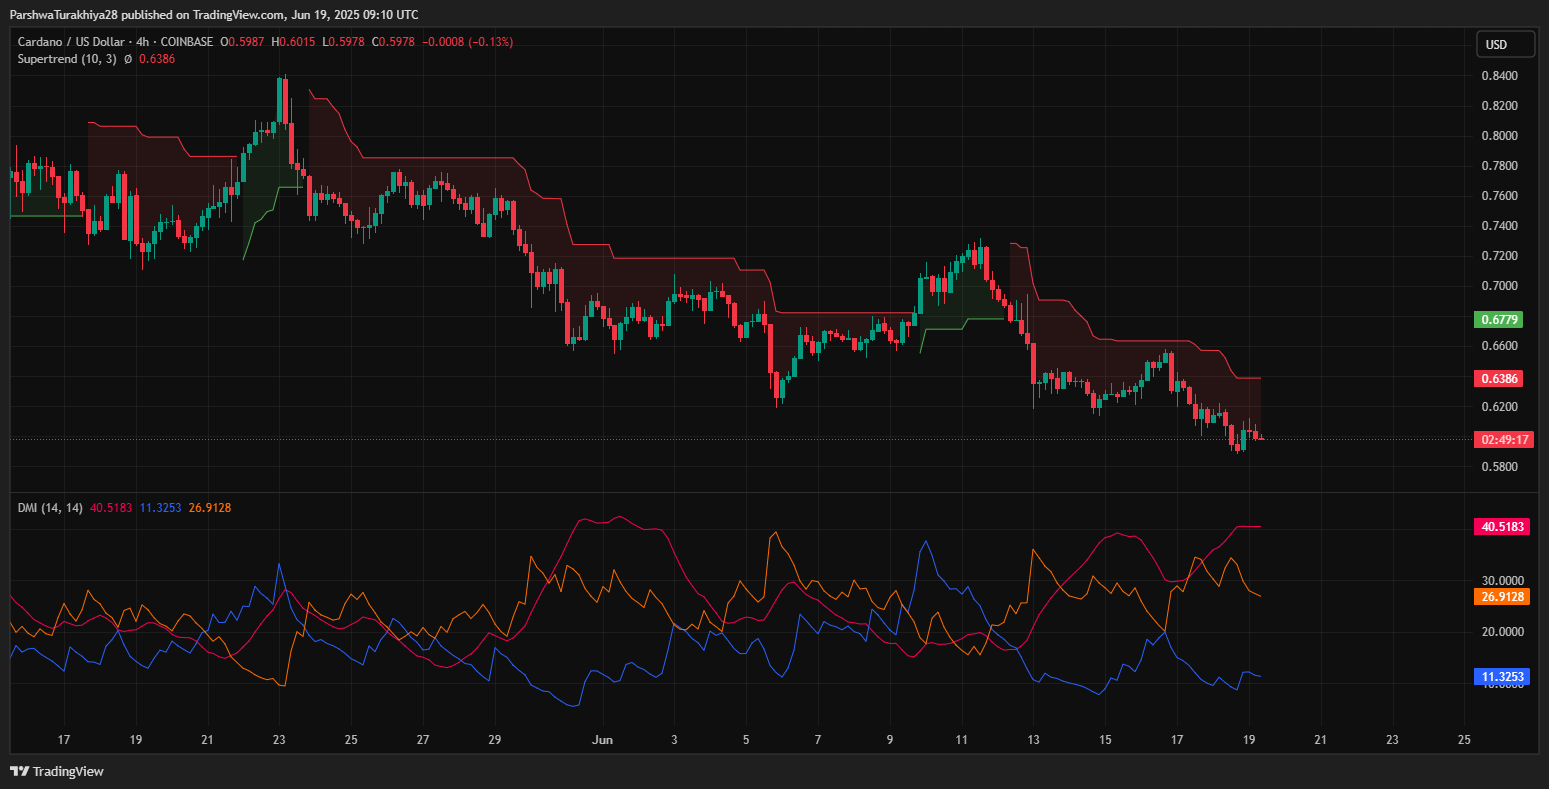
Multiple technical indicators now align with the bearish bias. The Supertrend indicator has flipped red with a trigger level at $0.638, reinforcing downside pressure. From a strength perspective, the Directional Movement Index (DMI) shows a clear bear trend with the -DI at 40.51 significantly above +DI at 11.32. The ADX at 26.91 confirms the strength of the ongoing move.
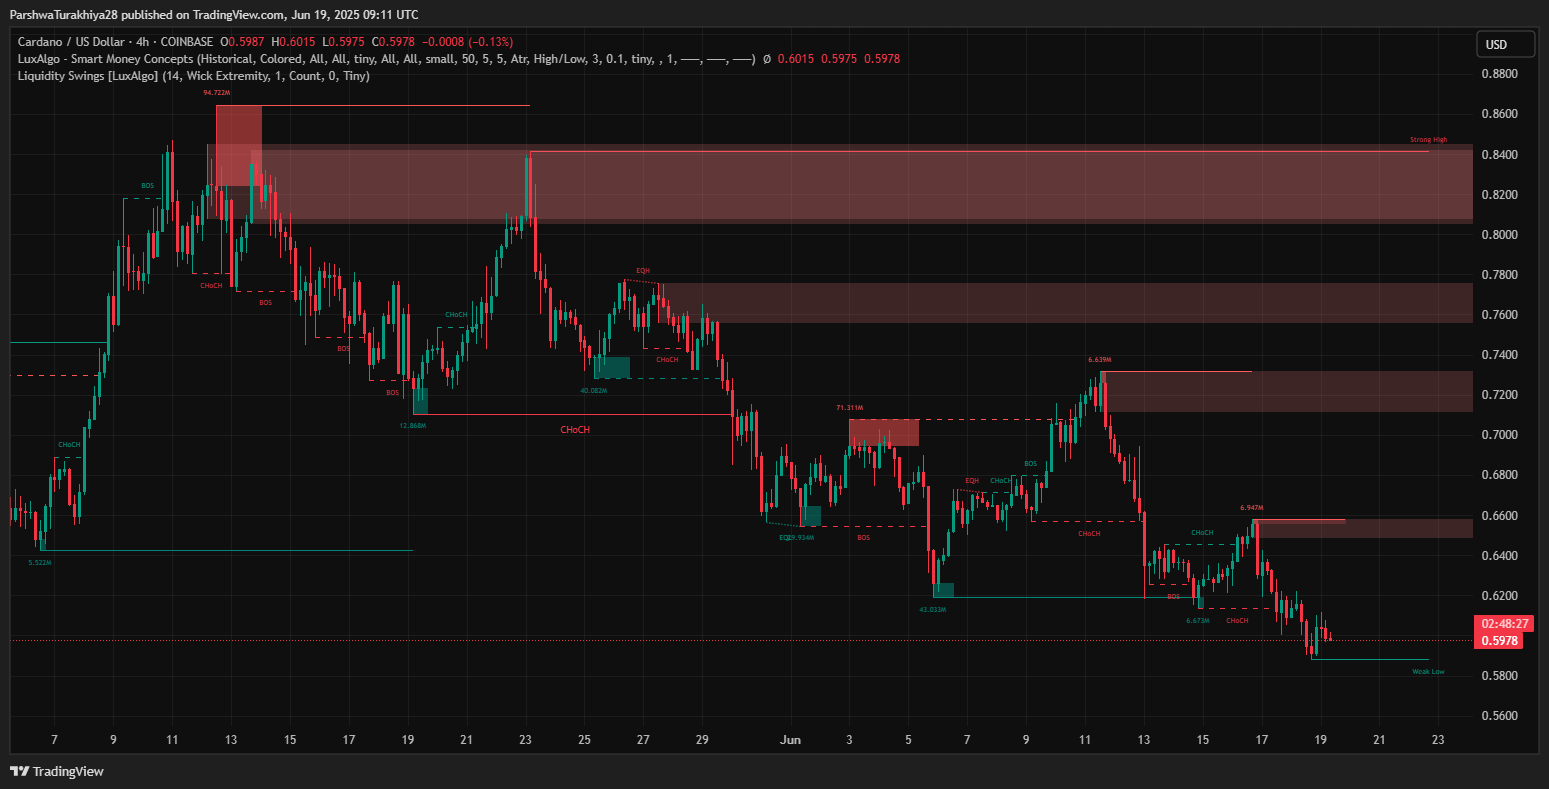
Liquidity structures from Smart Money Concepts (SMC) highlight a confirmed CHoCH (Change of Character) to the downside after ADA failed to hold above $0.66. A strong BOS (Break of Structure) near $0.64 has flipped prior support into resistance, with the current structure now showing a weak low formation near $0.5882.
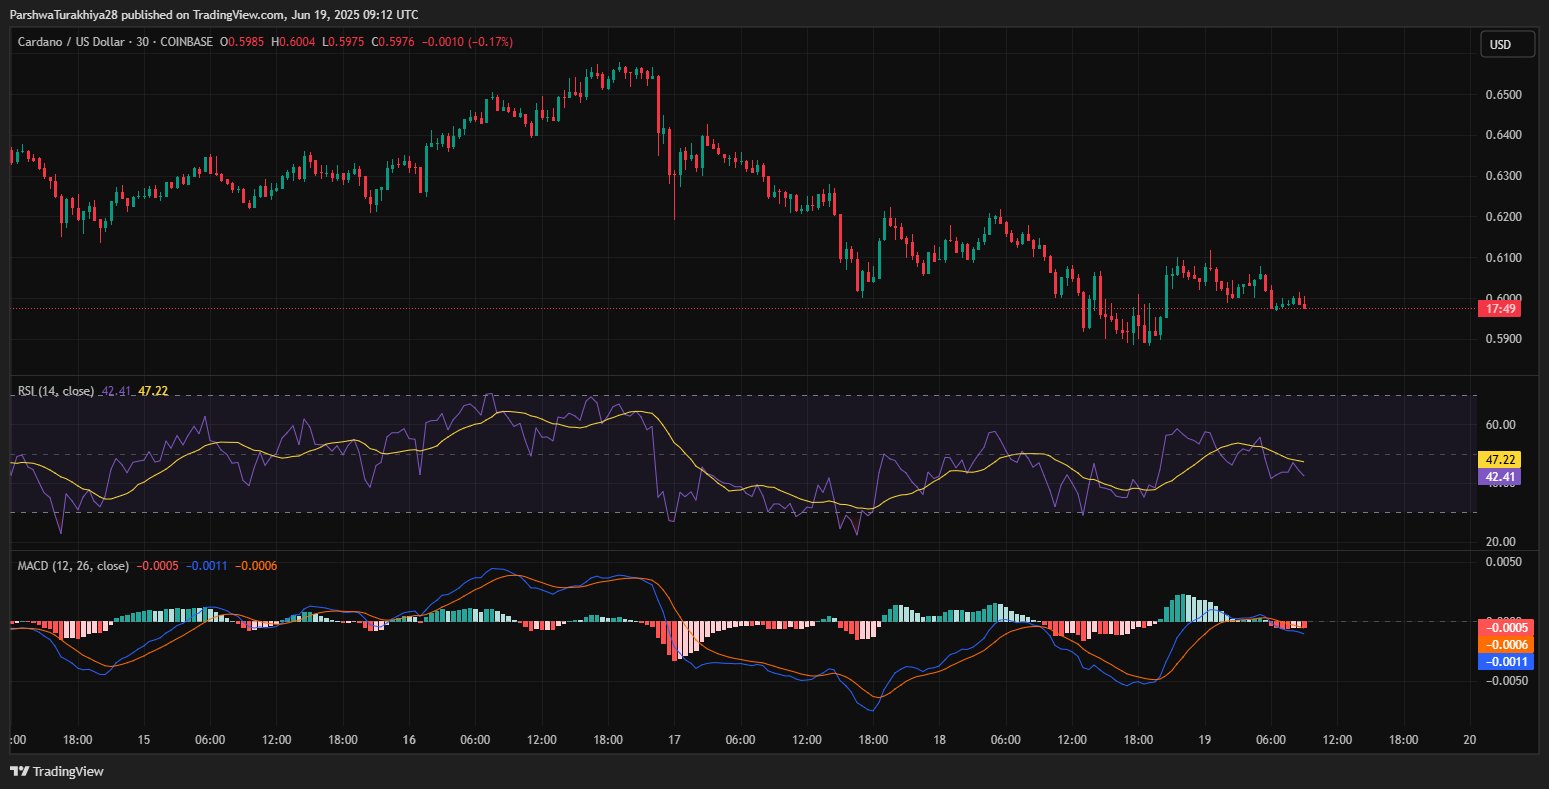
The 30-minute RSI sits at 42.41, still beneath the neutral 50 level, and has turned back down after attempting a recovery above 47. Meanwhile, the MACD shows minimal bullish divergence and is barely above the signal line, reflecting exhaustion on any short-term bounce attempts.
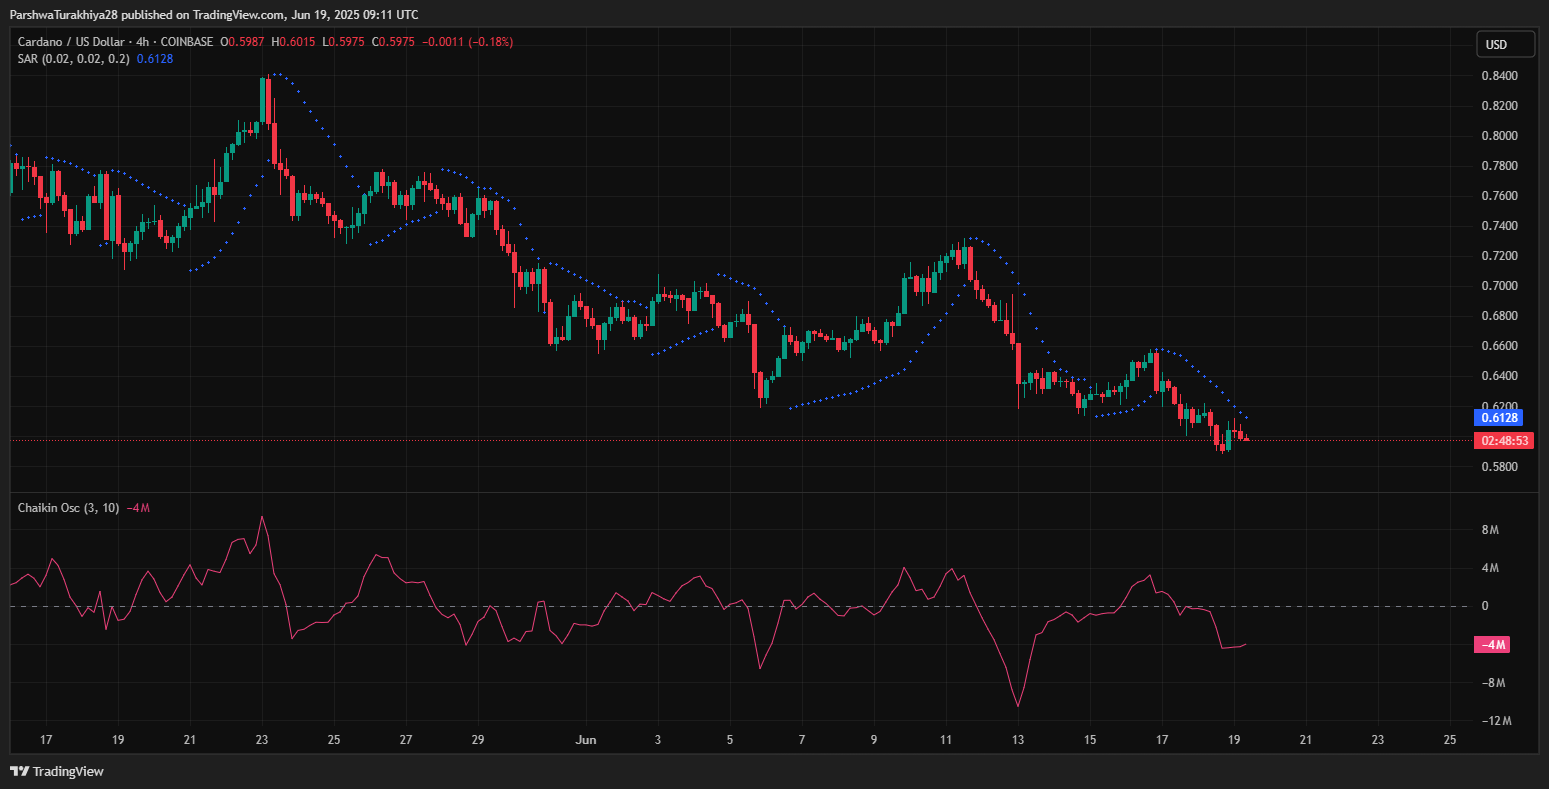
Volume dynamics via the Chaikin Oscillator remain in negative territory (~ -4M), and the AO (Awesome Oscillator) has also crossed back below zero. Combined, these indicators confirm declining participation from buyers.The Parabolic SAR also plots above price, signaling continuation of the current trend.
Cardano (ADA) Price Action Hints At Compression Below Key Resistance
With momentum indicators aligned bearishly, the Cardano price action continues to show signs of compression beneath the critical $0.6156–$0.6345 resistance belt. Price remains trapped within a downward-sloping channel on both 4-hour and daily charts, with trendlines confirming lower highs and lower lows.
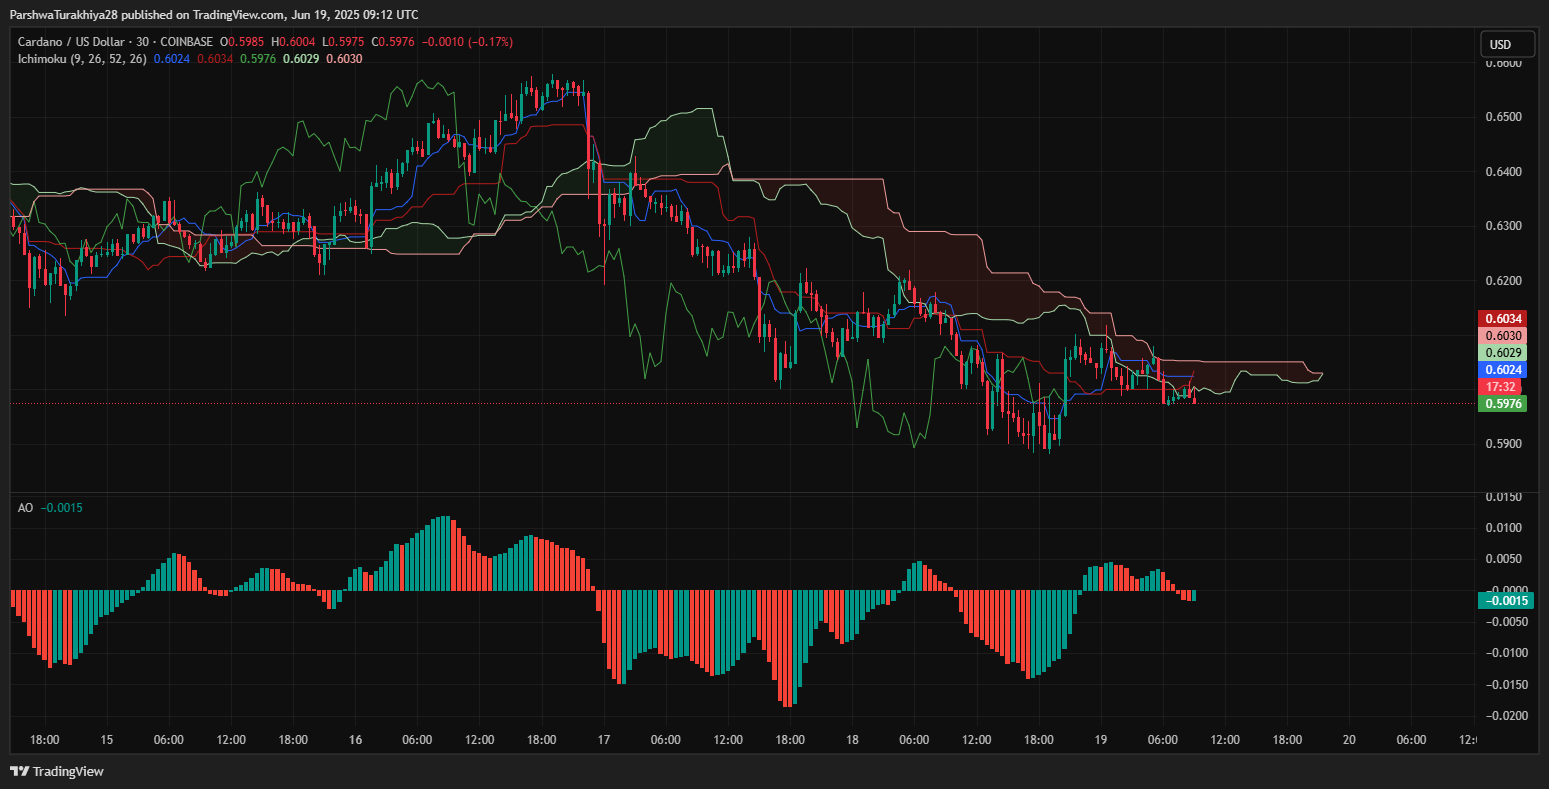
Ichimoku Cloud analysis on the 30-minute timeframe reveals that ADA remains below the Kumo cloud, with the baseline (Kijun-sen) and conversion line (Tenkan-sen) trending flat. This signals a lack of bullish strength in the short term, with no signs of a reversal yet.
Short-Term Outlook: Can ADA Hold the $0.59 Floor?
For ADA to stage a recovery, bulls must first secure a daily close above $0.615 and push through the confluence of the 20/50 EMA resistance band between $0.6143 and $0.6345. Only then can the Cardano price attempt a reversion toward the $0.66 and $0.69 levels, with $0.6981 being the next major resistance.
On the downside, if $0.588 fails to hold, ADA could quickly drop toward the $0.55 liquidity pocket. A deeper breakdown would expose the long-term support band between $0.48 and $0.50. A breach below that range may trigger panic-driven Cardano price spikes to the downside.
Despite fading strength, oversold conditions are developing across short timeframes. Any bounce, however, will face heavy resistance unless accompanied by a strong volume surge and momentum shift.
Cardano (ADA) Price Forecast Table: June 20, 2025
| Indicator/Zone | Level (USD) | Signal |
| Resistance 1 (EMA Cluster) | 0.6143–0.6345 | Intraday ceiling |
| Resistance 2 (Volume Profile) | 0.6908 | Mid-term resistance |
| Support 1 (Demand Zone) | 0.5882 | Immediate holding level |
| Support 2 (Weekly Structure) | 0.5500 | Breakdown trigger |
| EMA 20/50/100/200 | 0.614–0.680 | Downward sloping, resistance |
| RSI (30-min) | 42.41 | Weak, no divergence |
| MACD | Flat | Low momentum |
| BBP | -0.0163 | Bearish bias |
| DMI (-DI/+DI/ADX) | 40.51/11.32/26.91 | Strong bearish trend |
| Supertrend | 0.6380 | Bearish |
| Parabolic SAR | 0.6128 | Above price |
| AO / Chaikin Oscillator | Below Zero | Weak accumulation |
Disclaimer: The information presented in this article is for informational and educational purposes only. The article does not constitute financial advice or advice of any kind. Coin Edition is not responsible for any losses incurred as a result of the utilization of content, products, or services mentioned. Readers are advised to exercise caution before taking any action related to the company.

 Price Prediction: Can Bulls Reclaim the 0.236 Level?")

 Price Prediction: Can Bulls Break the $329 Barrier?")
