
- Cardano trades at $0.2897, up 7%, breaking above the 0.382 Fibonacci at $0.2773 as RSI reaches 75.43 on the 4-hour chart.
- Open interest surges 16.62% to $504.22M while volume jumps 88.26% to $852.48M, with shorts absorbing $976.37K in 24-hour liquidations.
- Two tankers sailed through the Strait of Hormuz on Sunday for the first time since the war began, triggering a broad risk-on rotation into altcoins.
Cardano trades at $0.2897, up 7%, breaking above the 0.382 Fibonacci retracement at $0.2773 as risk appetite returns across crypto markets. The move is part of a broader altcoin surge driven by the first signs of Hormuz de-escalation, with ADA leading on derivatives volume and posting its strongest 4-hour candle since February.
4-Hour Chart: Fibonacci Breakout With RSI In Overbought Territory
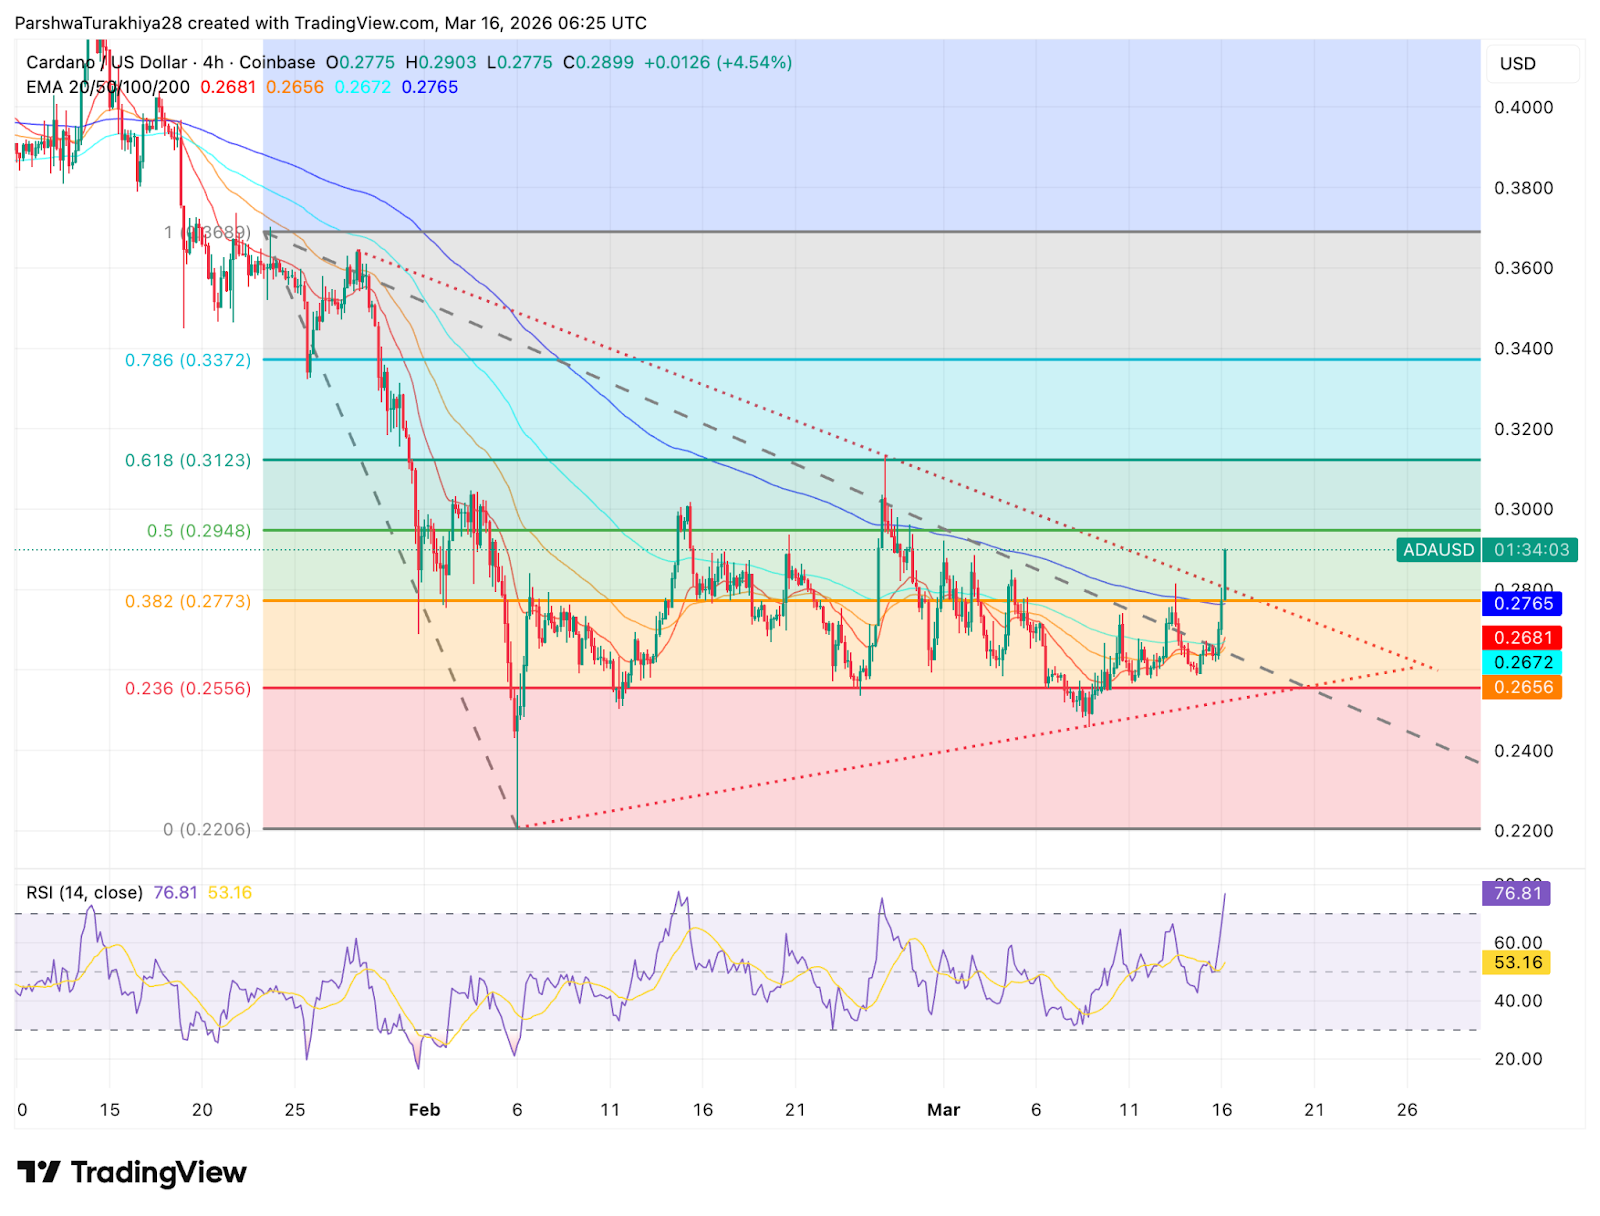
ADA has cleared the 0.382 Fibonacci level at $0.2773 and all four EMAs in a single move, with the 20-day at $0.2679, 50-day at $0.2655, 100-day at $0.2671, and 200-day at $0.2764 now sitting below price for the first time since January. The next Fibonacci resistance sits at the 0.5 level at $0.2948, with the 0.618 at $0.3123 as the target if momentum continues.
RSI at 75.43 is in overbought territory, well above the signal line at 53.07. That reading typically flags a short-term pullback risk, but overbought RSI during a genuine breakout often stays elevated longer than expected. The level to watch on any pullback is $0.2773, the broken Fibonacci level that now becomes support.
Key levels:
- 0.382 Fibonacci support: $0.2773
- 0.5 Fibonacci resistance: $0.2948
- 0.618 Fibonacci resistance: $0.3123
- 0.786 Fibonacci resistance: $0.3372
Derivatives: Shorts Getting Washed Out
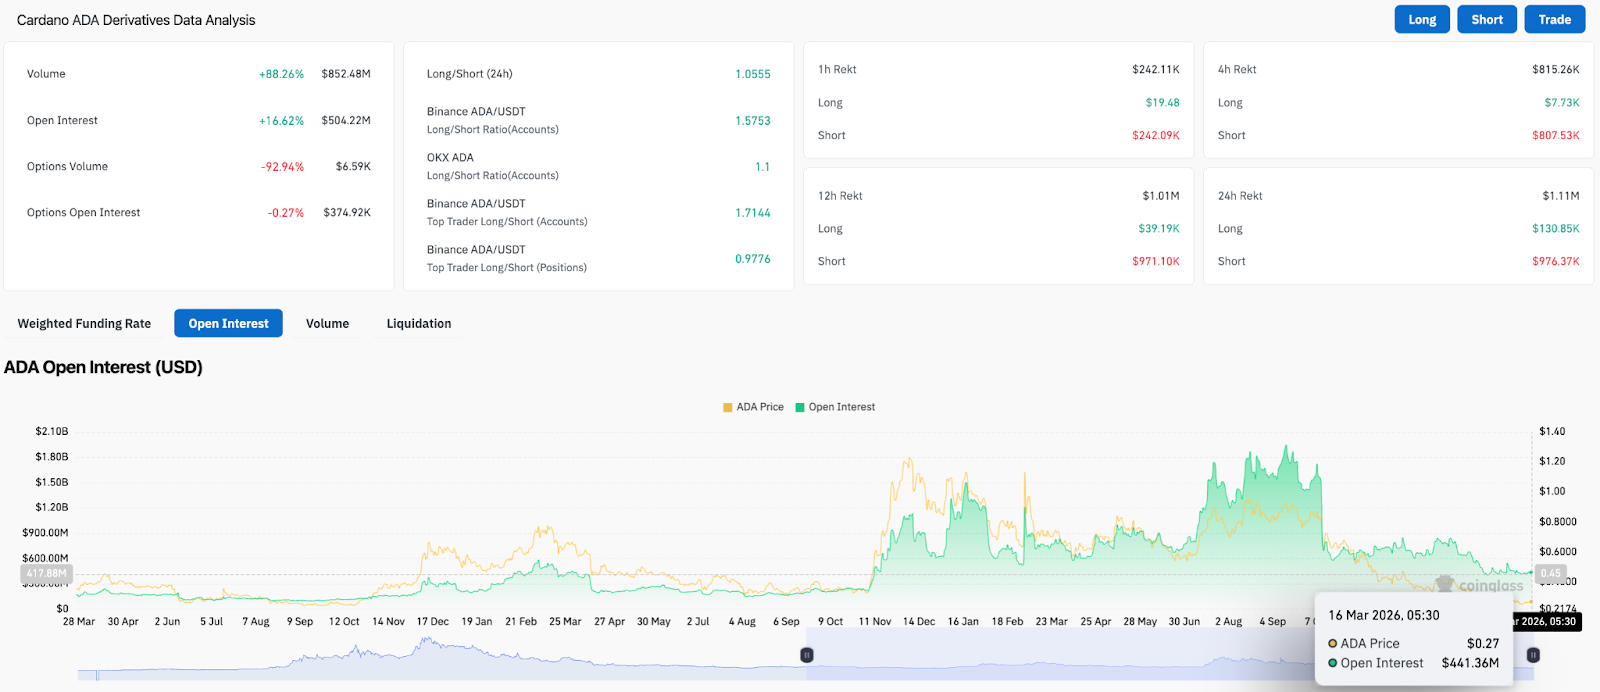
Open interest surged 16.62% to $504.22M as volume nearly doubled, rising 88.26% to $852.48M. That combination of rising OI alongside a price breakout is the cleanest confirmation that fresh long positions are entering rather than existing holders taking profit. The Binance long/short ratio sits at 1.5753 for accounts and 1.7144 for top trader accounts, while top trader positions at 0.9776 show institutional sizing remains nearly flat despite the retail bullishness.
Related: Shiba Inu Price Prediction: SHIB Jumps 4.5% As Burn Rate Surges 1,222%
The liquidation data makes the squeeze visible. Over 24 hours, shorts absorbed $976.37K against just $130.85K for longs. The asymmetry is significant. Bears who positioned against ADA at the EMA resistance cluster are being systematically flushed, and a push toward $0.2948 would force another wave of short covering.
Hormuz Partial Easing Shifts Mood, Not Reality
The macro catalyst behind today’s crypto move is real but narrower than headlines suggest. Iran has selectively allowed certain ships through the Strait of Hormuz, including two Indian-flagged gas carriers and a Turkish vessel, after declaring the waterway closed only to ships from the US, Israel, and their Western allies. Markets read that as de-escalation. The actual situation on the water tells a different story.
Before the war began on February 28, roughly 100 vessels a day were safely crossing the strait. That number has collapsed to one or two per day. Iran’s new supreme leader has publicly committed to keeping the strait closed as a pressure tool, drone strikes have hit Oman’s bypass ports at Duqm and Salalah disrupting the main alternative route, and no broad commercial reopening has been announced or agreed.
What moved markets today was the perception of easing, not the reality of it. Brent pulled back toward $104 from the post-Kharg high of $106.50, WTI dropped below $100, the dollar softened 0.3%, and S&P 500 futures advanced 0.5%. That relief is genuine but fragile. If Iran moves toward attacking Gulf oil infrastructure directly as a last-resort pressure tactic, the supply shock gets significantly worse and the brief optimism unwinds fast.
The altcoin outperformance this week is the more interesting signal regardless. When ETH outperforms BTC by 4.6 percentage points and SOL by 2.3 points on a weekly basis, capital is rotating down the risk curve rather than hiding in Bitcoin. That rotation continues as long as the mood holds. The Fed meeting on March 17-18 is now the next test, and any hawkish signal from Powell on Wednesday would reverse it quickly.
Outlook: Will Cardano Go Up?
- Bullish case: ADA holds $0.2773 as support on any RSI-driven pullback, pushes through the 0.5 Fibonacci at $0.2948, and targets the 0.618 level at $0.3123. A dovish Fed outcome on March 18 and continued Hormuz de-escalation would give the breakout fundamental support beyond the technical setup.
- Bearish case: RSI mean reversion pushes price back below $0.2773 and the EMA cluster. A hawkish Fed surprise or fresh Hormuz escalation would reverse the macro tailwind quickly, exposing the $0.2556 Fibonacci 0.236 level and potentially the $0.2206 range low.
Disclaimer: The information presented in this article is for informational and educational purposes only. The article does not constitute financial advice or advice of any kind. Coin Edition is not responsible for any losses incurred as a result of the utilization of content, products, or services mentioned. Readers are advised to exercise caution before taking any action related to the company.


