
- ADA breaks its short-term trendline as $6.48M in outflows and an 11% drop in open interest signal mounting pressure on buyers.
- Rejection at $0.48 flips the EMA cluster into resistance, with ADA now trading below the 20 and 50 EMAs on the 4-hour chart.
- Momentum weakens beneath VWAP, leaving $0.41–$0.40 exposed unless buyers reclaim $0.44–$0.45 to reset short-term structure.
Cardano price today trades near $0.426 after slipping below a short term trendline that has supported the recovery since early December. The move comes as spot outflows rise again and futures open interest drops more than 11 percent, signaling pressure on buyers as ADA struggles to hold above the 20 and 50 EMAs on the four hour chart.
Spot Outflows Increase As Buyers Step Back
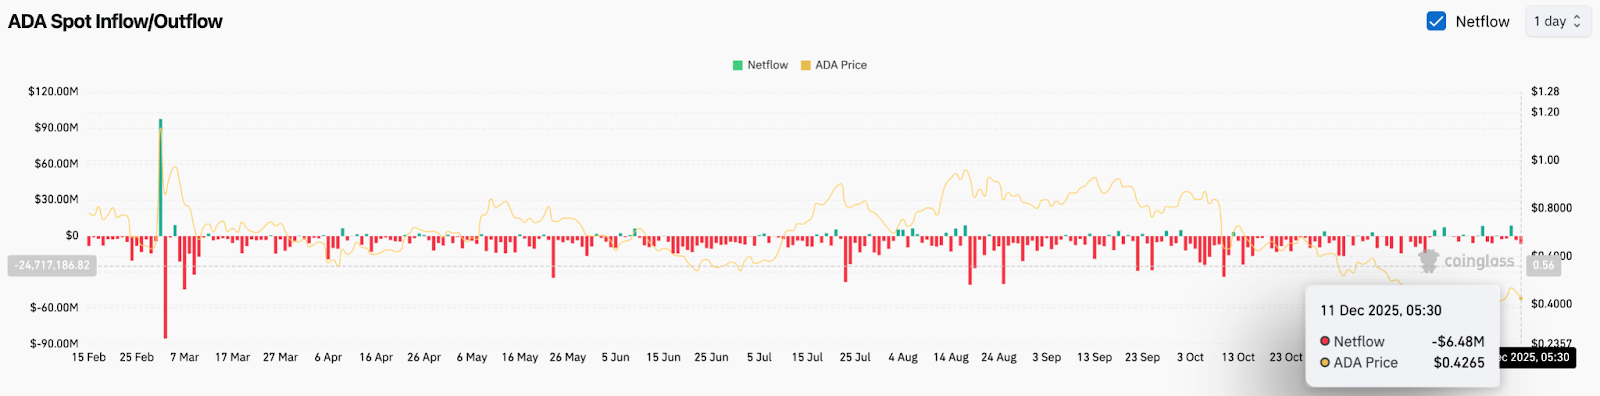
Coinglass data shows ADA recorded nearly $6.48 million in net outflows on December 11. The trend has been consistent across the past week, with repeated red prints dominating the board. This indicates liquidity is leaving the market rather than rotating into accumulation.
When outflows cluster around key resistance failures, price often loses follow through on attempted breakouts. That dynamic is visible here. ADA pushed into the $0.48 zone, triggered a sharp intraday rally, then faded almost immediately as supply returned on exchanges. The inability to convert upside momentum into sustained demand keeps sentiment cautious.
Open Interest Drops As Longs Unwind
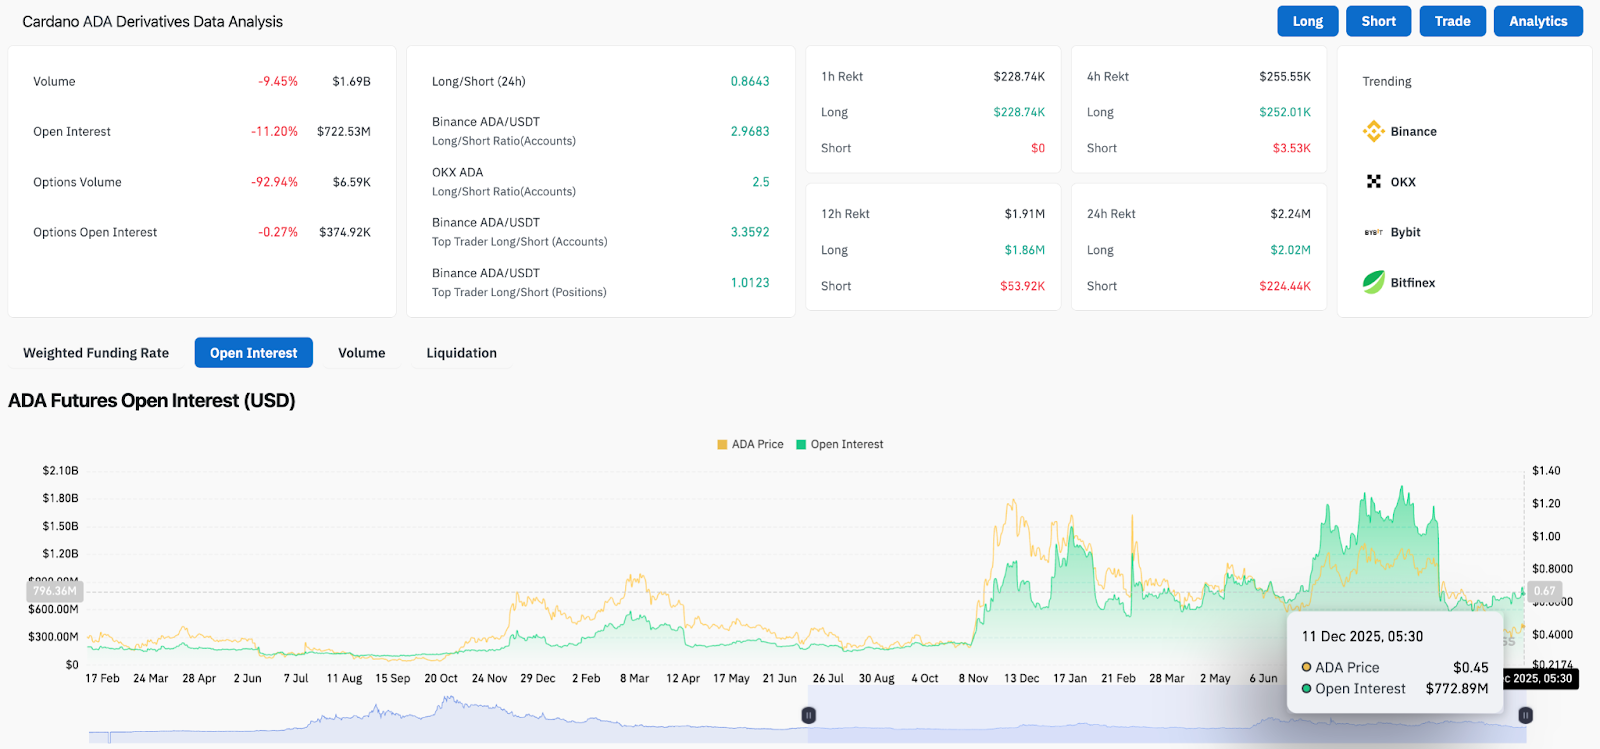
Derivatives data adds to the bearish bias. Open interest has fallen 11.20% to $722.53 million, marking one of the sharper unwind sessions of the month. Liquidity has been pulled from leveraged positions as traders reduce exposure after the failed breakout.
Options volume and options open interest remain muted, showing a lack of directional appetite. Across major exchanges, top trader long short ratios are elevated, but the broader OI decline suggests longs have already begun trimming risk rather than adding to positions at lower prices.
Related: Solana Price Prediction: SOL Maintains a Corrective Structure as Traders…
This shift usually signals two conditions. First, longs are losing conviction as the market fails to hold breakout levels. Second, sellers are likely to keep pressure on intraday rallies, particularly while ADA trades under the short term EMA cluster.
Rejection At $0.48 Turns Trendline Into Resistance
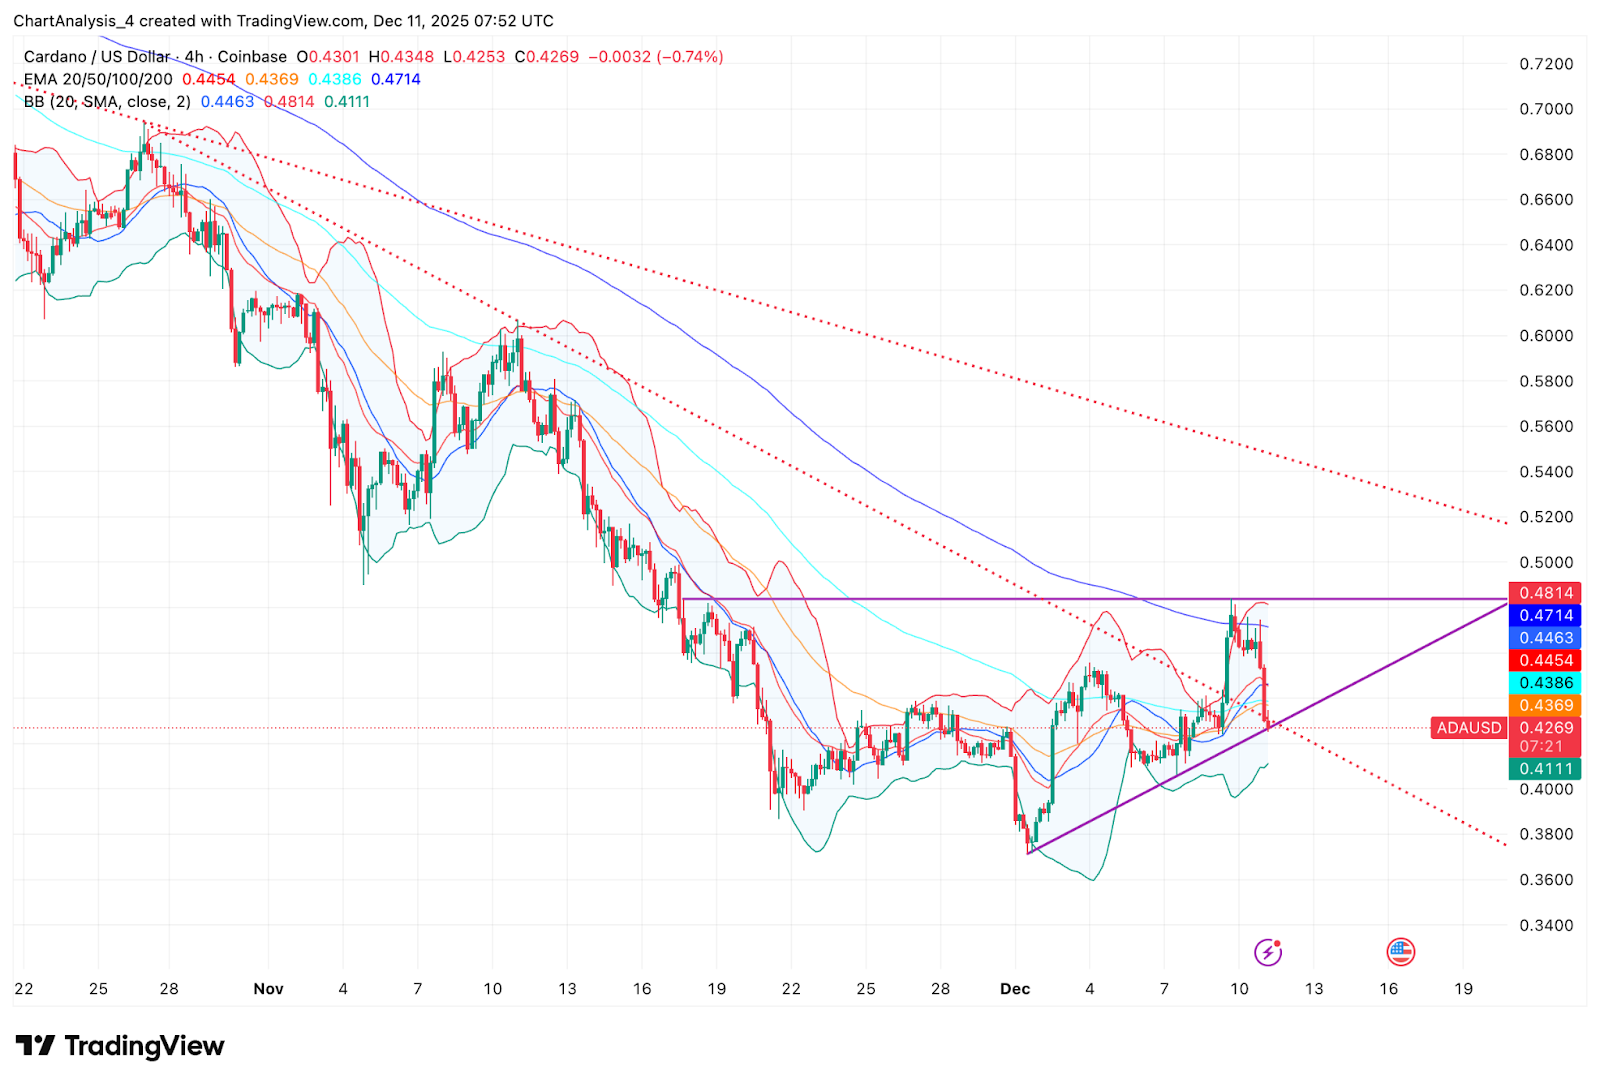
The 4- hour chart shows a clean rejection at the horizontal resistance near $0.48, a level aligned with the upper Bollinger Band and the underside of a multi week descending trendline. The failed breakout produced a sharp wick, followed by a steady pullback through the 20 and 50 EMAs. Price now sits below both levels, shifting the short term structure into a bearish coil.
The ascending support line from the December 3 low has been violated intraday, removing the clean uptrend structure buyers were relying on. ADA now trades inside the mid band of the Bollinger setup, indicating neutrality with a downside tilt.
The 100 and 200 EMAs sit higher at $0.44 and $0.47, forming a resistance block that will be difficult to clear without a surge in volume. Sellers defended this zone cleanly during the latest push, reinforcing its importance going forward.
The dotted descending trendline overhead still caps the broader structure. ADA has not broken above it since mid October, which maintains the longer term downtrend despite recent attempts to base.
Intraday Momentum Weakens As ADA Sits Below VWAP
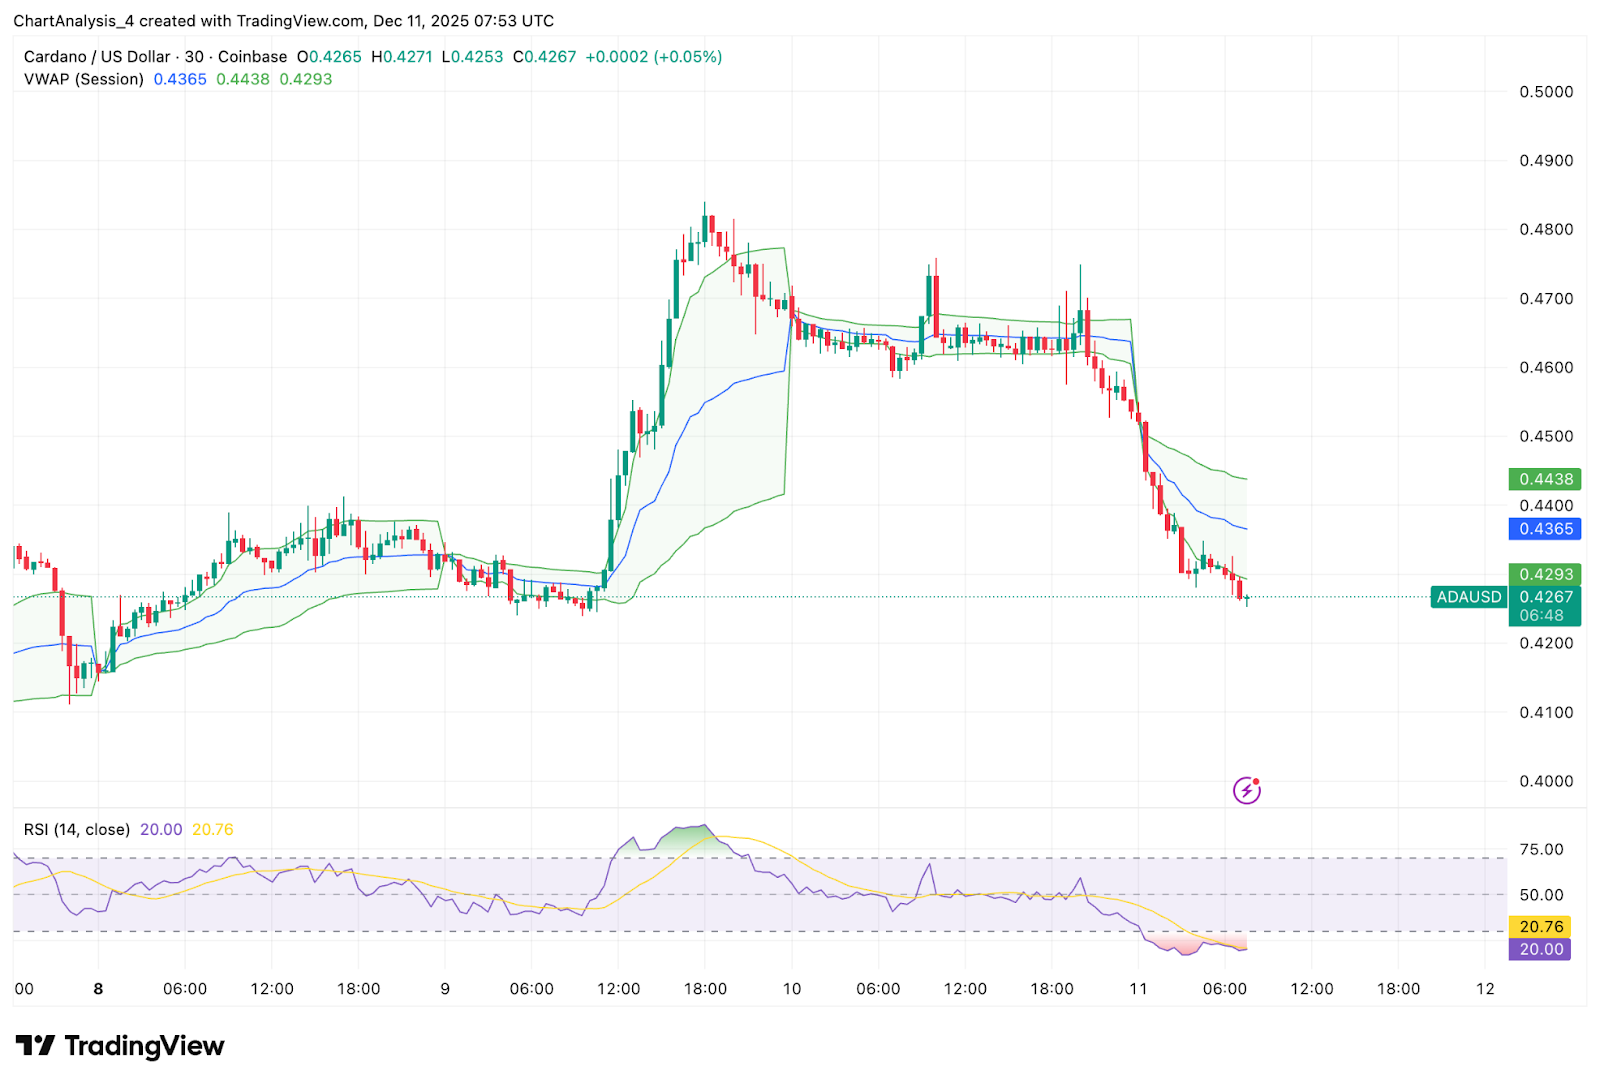
On the 30 minute chart, ADA remains below the VWAP and trades near the lower Keltner channel. RSI sits near 20, showing oversold conditions but no clear reversal yet. Buyers attempted small bounces near $0.43, but none have reclaimed the VWAP or the first supply zone at $0.4400.
Intraday sentiment stays weak while ADA trades under these levels. A close above the VWAP is required to stabilize momentum. Without it, price remains vulnerable to further tests of $0.41 to $0.40.
Outlook. Will Cardano Go Up?
ADA must reclaim $0.44 to $0.45 to regain trend control. This zone contains the 20 and 50 EMAs on the four hour chart and marks the first confirmation that momentum is shifting back toward buyers. A breakout above $0.48 would open the path toward $0.50 and a larger trend reversal attempt.
Failure to reclaim the EMA cluster keeps the structure bearish. Losing $0.41 exposes the next support at $0.39, with deeper downside toward $0.37 if outflows continue.
If ADA closes above $0.45 with improving volume, buyers regain short term strength. A drop below $0.41 turns the move into a deeper correction into the lower December range.
Disclaimer: The information presented in this article is for informational and educational purposes only. The article does not constitute financial advice or advice of any kind. Coin Edition is not responsible for any losses incurred as a result of the utilization of content, products, or services mentioned. Readers are advised to exercise caution before taking any action related to the company.


