
- ADA soared above $0.8 after Grayscale filed for spot ETF GADA
- ADA is currently retesting the 20-day EMA at the $0.80 price level
- Analyst claims that ADA is forming patterns similar to the 2021 bull run
Leading digital asset manager Grayscale has filed for a Cardano (ADA) exchange-traded fund (ETF) under the ticker “GADA.”
Now the big question is, once the SEC approves this investment product; yes, US investors gain more exposure to ADA, but will it be the trigger for a positive ADA price move.
Coinbase Named Custodian for Proposed Cardano ETF
Key details of the filing show that Coinbase Custody Trust Company has been named as the custodian for the product. Additionally, it’s noted that BNY Mellon Asset Servicing would be the administrator.
Some analysts speculate that the proposed ETF could push the cryptocurrency price above $1 resistance soon. However, taking a realistic view, ADA is testing the 20-day Exponential Moving Average (EMA) at the $0.8 price level.
ADA Price Surges 20% on ETF News, But Momentum Falters
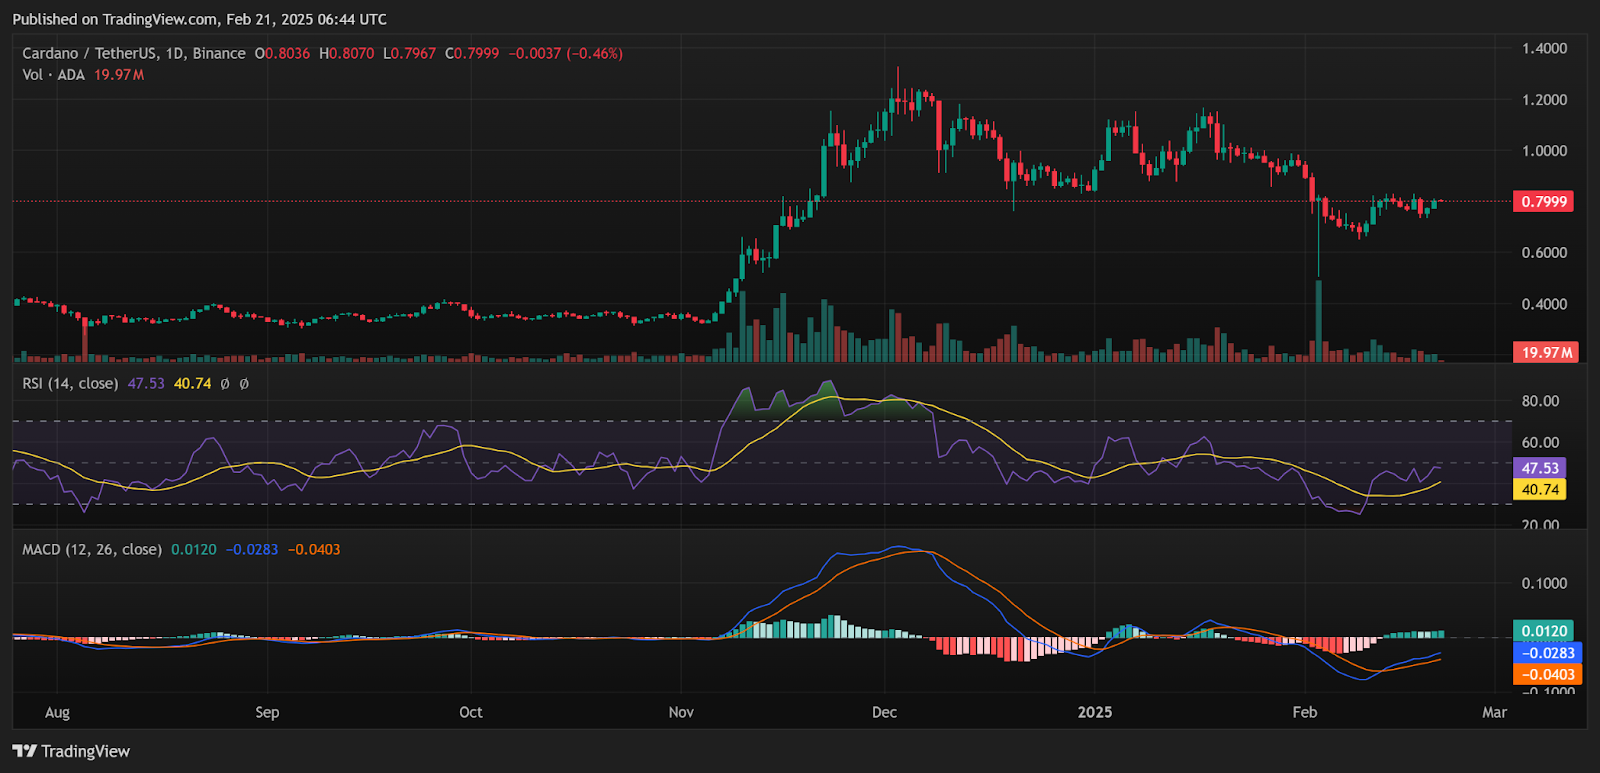
Data from CoinMarketCap shows ADA hit a daily high of $0.8104, but importantly, it failed to hold above the 20-day EMA.
The news of the ETF filing did trigger a rapid 20% surge in ADA’s price, which helped it climb from $0.663 to $0.83.
Following this spike, many investors speculated that this could be the start of a broader uptrend. However, almost as quickly, ADA struggled, falling below its critical resistance level at $0.80. Currently, it is trading around $0.79.
Analyst Points to “Liquidity Base” Formation for ADA
Providing a technical counterpoint, crypto analyst ‘Chris O’ offered an in-depth technical perspective on ADA’s chart.
Interestingly, he is comparing its current price action to ADA’s early 2021 cycle. According to his analysis, Cardano is currently forming a “liquidity base,” a period of accumulation where buyers and sellers establish a foundation before the next major price move.
Related: Analyst Crypto Forecasts—Overly Bullish on XRP, ETH, ADA & SOL?
ADA Price Analysis: RSI Neutral, MACD Bullish Signals Mixed Outlook
The Relative Strength Index (RSI) reads a value of 47.53, hovering near the neutral zone. The gradient of the line suggests stagnation around the 20-day EMA.
Looking at bullish scenarios, if bulls take over, a breakout above $0.8 could occur. If this happens, $1 is the next resistance level to watch. Beyond that, $1.50 is another massive resistance target.
Related: ADA Price Targets $0.83 as Analyst Predicts Breakout Rally
The MACD (Moving Average Convergence Divergence) shows that the MACD line (blue) remains above the signal line (red). which means the bulls are in control. This bullish signal follows a bullish crossover a few days prior. Confirming the bullish signal, the MACD histogram is also green.
Disclaimer: The information presented in this article is for informational and educational purposes only. The article does not constitute financial advice or advice of any kind. Coin Edition is not responsible for any losses incurred as a result of the utilization of content, products, or services mentioned. Readers are advised to exercise caution before taking any action related to the company.

 Price Prediction: Can Bulls Reclaim the 0.236 Level?")

 Price Prediction: Can Bulls Break the $329 Barrier?")
