
- Cardano trades near $0.495, clinging to major $0.49 support after weeks of decline and weak trend momentum.
- Coinglass data shows $7.8M in inflows, but broader outflow trend persists as ADA remains under heavy selling pressure.
- Resistance stands at $0.50–$0.56, while losing $0.47 could expose ADA to deeper downside toward $0.44 and $0.40.
Cardano price today trades near $0.495 as the market attempts to stabilize after a multi-week decline. Sellers continue to drive the structure lower while ADA hovers above one of its most important support zones of 2025. The recent ETF inclusion news has sparked interest, but price has yet to reflect the catalyst as technical pressure stays dominant.
ETF Inclusion Generates Buzz But Fails To Shift Trend
Cardano was officially added to two new 21Shares products, the FTSE Crypto 10 Index ETF TT0P and the FTSE Crypto 10 ex-BTC Index ETF TXBC. The inclusion places ADA alongside the sector’s largest assets and introduces new potential for institutional flows.
The index weighting stands at 0.71 percent. While small compared to Bitcoin and Ethereum, it marks a notable step for Cardano and signals rising recognition across diversified crypto baskets. Market participants widely expected the announcement to spark volatility, yet price reaction has been muted.
Spot Flows Stay Mixed As Sellers Maintain Pressure
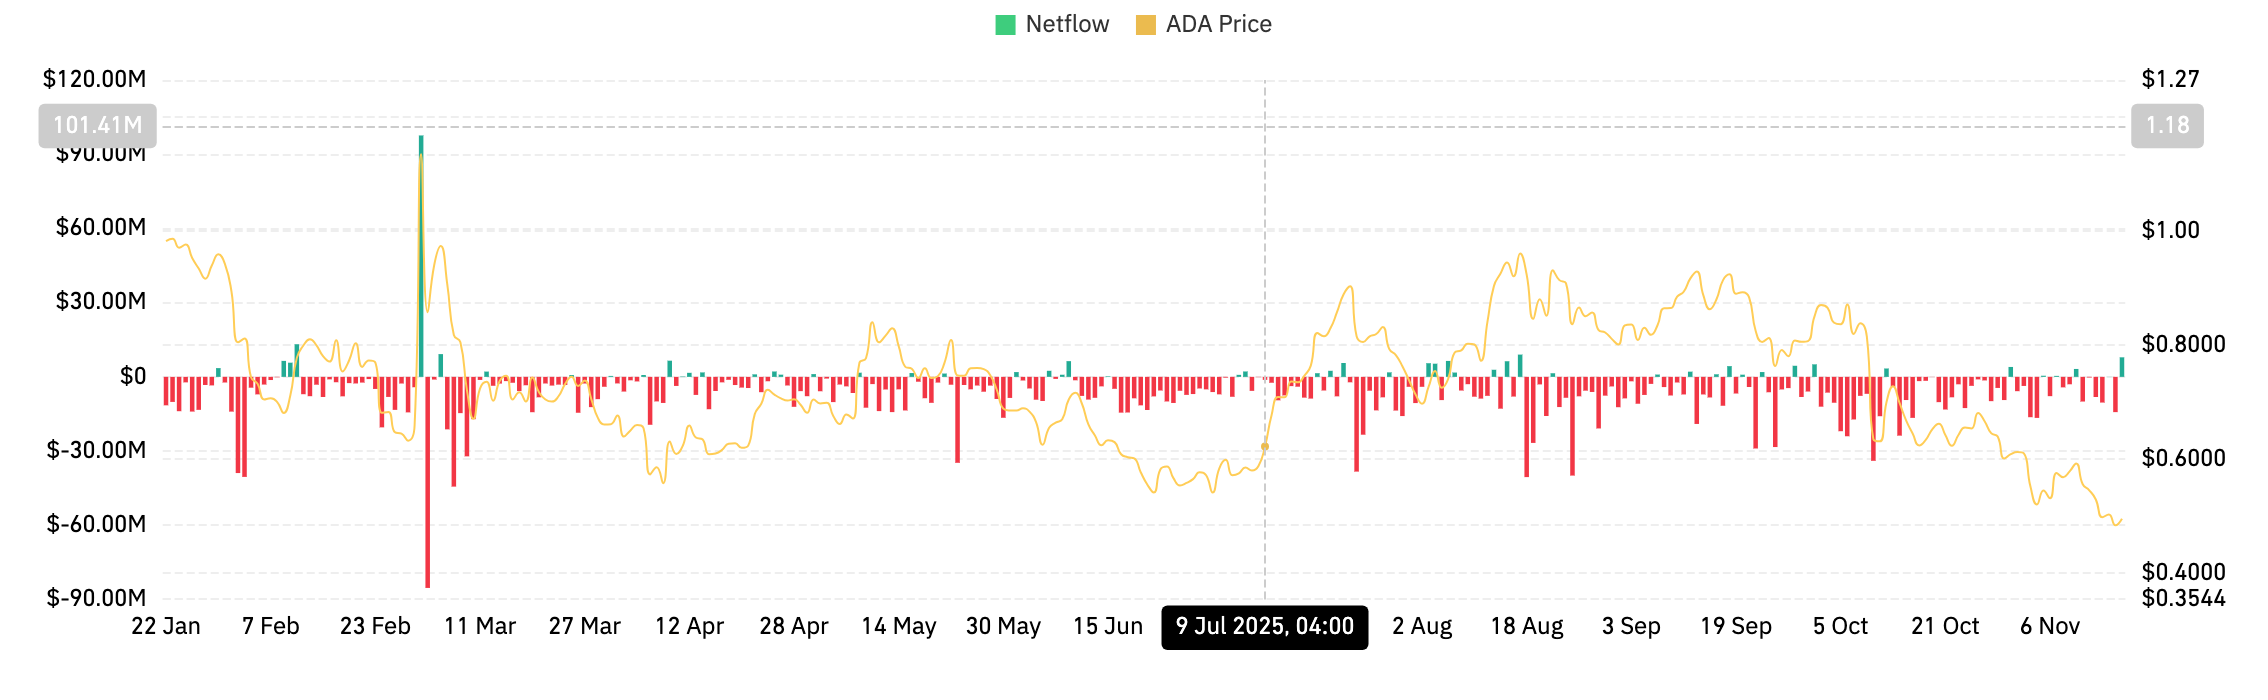
Coinglass data shows $7.8 million in net inflows during the latest session, but this follows a long stretch of red prints through the month. Across October, ADA saw repeated outflow spikes, confirming that traders were not accumulating despite the ETF narrative.
Related: Ethereum Price Prediction: ETH Slips Toward Key Support as Derivatives Activity Cools
The latest inflow reading is not enough to offset the broader trend. Liquidity leaving the ecosystem has reinforced every push lower. Unless inflows turn consistent, sentiment will stay cautious even with ETF support in headlines.
Spot flows remain one of the clearest indicators of market posture. ADA will need multiple sessions of positive prints before buyers regain confidence at higher levels.
Trendline Rejection Keeps ADA Below Key EMAs
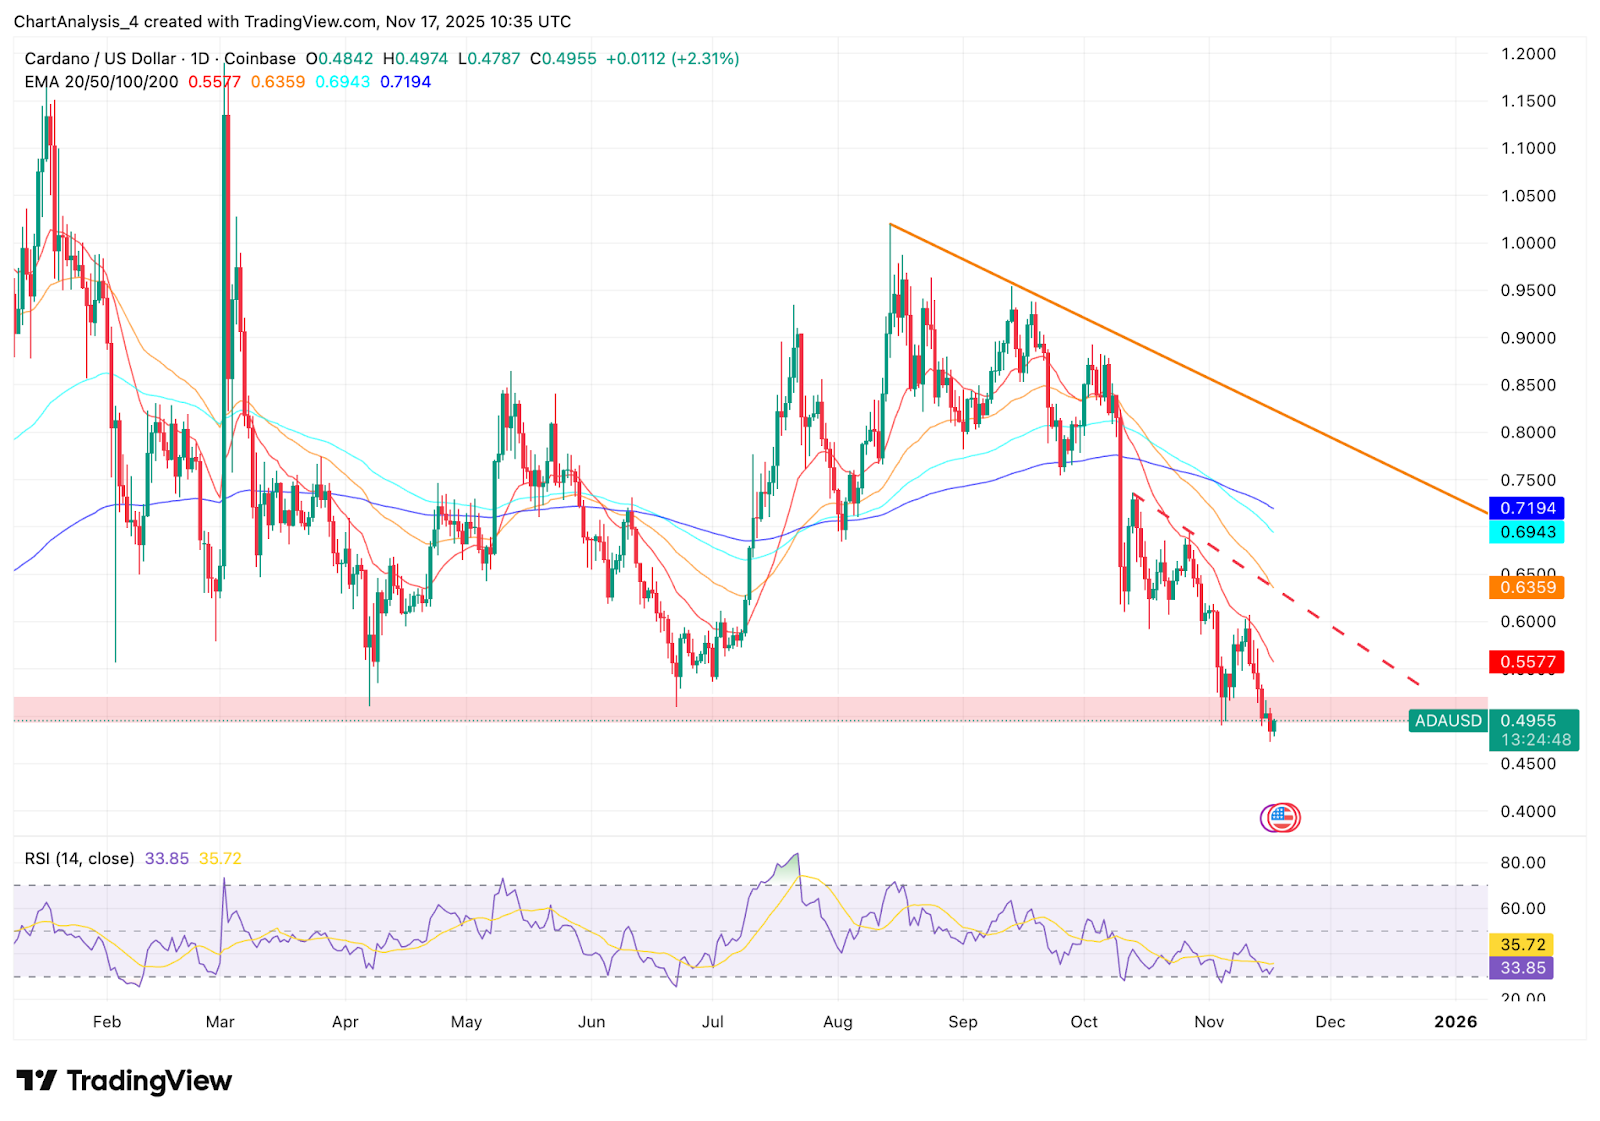
The daily chart shows ADA trapped under a long-term descending trendline that has dictated every swing since the August peak. Sellers defended the 20 EMA near $0.56, and price now trades below the 20, 50, 100, and 200 EMAs clustered between $0.55 and $0.72.
This EMA formation reinforces bearish dominance. ADA attempted a short bounce into the lower trendline but failed quickly. The rejection confirms that sellers remain active on every approach toward the $0.56 to $0.60 region.
The current support zone between $0.47 and $0.49 has held multiple times this year. A clean breakdown would expose the July base near $0.44, followed by deeper targets around $0.40.
Related: Bitcoin Price Prediction: Heavy Outflows Leave BTC Exposed as Price Sits Near $95,000
RSI at 33 shows oversold conditions without diverging strength. The lack of bullish divergence signals that momentum still leans downward.
Intraday Charts Show Early Stabilization Attempts
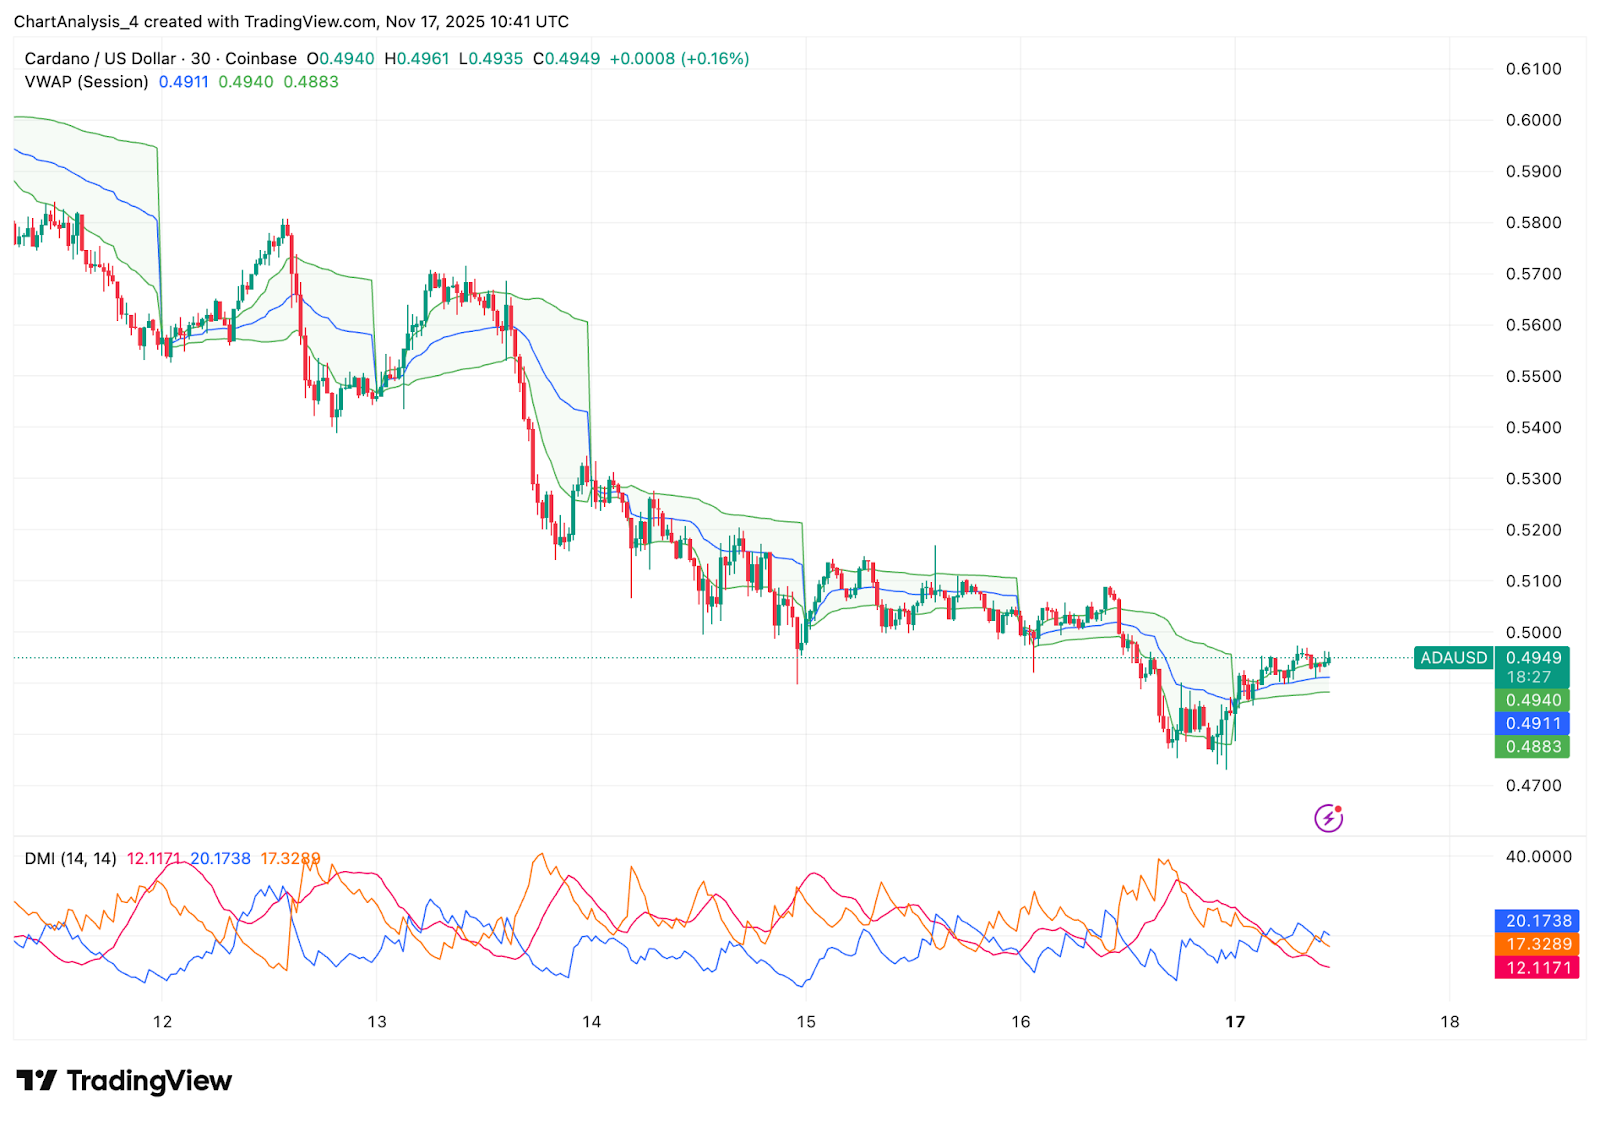
The 30-minute chart reveals small signs of stabilization. ADA trades slightly above VWAP and has reclaimed the lower volatility band for the first time in two days. This indicates a pause in selling pressure rather than a confirmed shift.
Directional Movement Index shows a narrowing spread between +DI and -DI. The compression reflects slowing bearish momentum, but +DI has not crossed convincingly above -DI. This keeps the intraday outlook neutral to weak.
Short-term resistance sits near $0.50. A breakout could target $0.504 to $0.509, where ADA repeatedly failed earlier this week. Without a strong move above VWAP and this resistance band, intraday signals remain corrective.
Key Levels To Watch
Resistance:
- $0.50: First intraday resistance and VWAP alignment
- $0.56: 20 EMA and trendline interaction
- $0.63: 50 EMA barrier
- $0.72: Major reversal zone at the 200 EMA
Support:
- $0.49: Immediate support
- $0.47: Key structural floor
- $0.44: July low and deeper liquidity zone
- $0.40: Major downside objective if sellers gain momentum
Outlook. Will Cardano Go Up?
Cardano can recover only if price reclaims $0.50 first, then breaks above $0.56 with strong inflows. A close above the 20 EMA would be the first reliable signal that buyers are regaining control. Market conviction requires ADA to clear $0.63, which would realign the trend toward the $0.72 region.
The bearish case remains active while ADA stays below the descending trendline. A daily close under $0.47 opens the door to $0.44, and a failure there would turn the decline into a broader correction toward $0.40.
A move above $0.56 signals the first shift in momentum. Losing $0.47 confirms deeper downside risk.
Related: Telcoin Price Prediction: TEL Extends Its Short-Term Rally as Futures Activity Surges
Disclaimer: The information presented in this article is for informational and educational purposes only. The article does not constitute financial advice or advice of any kind. Coin Edition is not responsible for any losses incurred as a result of the utilization of content, products, or services mentioned. Readers are advised to exercise caution before taking any action related to the company.


