
- Cardano faces criticism for low TPS and declining market performance despite high TVL.
- Scammers target Cardano users with fraudulent ADA token migration schemes.
- ADA price shows a negative trend with a declining RSI and bearish MACD crossover.
Cardano continues to draw criticism from the crypto community over its low transaction volume and declining market performance. Despite $22 billion locked within the network, the platform handles only 1.3 transactions per second (TPS), sparking concerns about its utility and future.
Most argue that this low transaction rate means that less than 1.5 users are using the network at any given second, prompting some to label the situation a catastrophe for Cardano.
Cardano saw 6,697 transactions in one hour, averaging an actual TPS of 1.86. Over 24 hours, the blockchain processed 112,179 transactions at an average TPS of 1.3. The 7-day tally is 826,066 transactions, with a slightly higher TPS of 1.37.
Additionally, the maximum TPS value is zero across all timeframes, suggesting that no peak transaction rate has been recorded or the data is unavailable.
Security Warnings and Scammer Alerts
The Cardano team warned their community about scammers targeting the network by issuing a security warning. Scammers are reportedly trying to exploit users by sending fake emails offering assistance with an ADA token migration.

The Cardano team urged users to remain cautious, stating that if an offer seems too good to be true, it probably is. They advised the community to disregard any suspicious emails, such as one that falsely claims a migration to v2 ADA tokens.
Price Decline and Technical Analysis
Cardano’s price has struggled recently. Over the past week, the value of ADA has fallen, starting around $0.4096 on September 28 and dropping to approximately $0.34 by October 2.
Read also: Cardano Flexes Its Muscles: 8 Transactions, 1600 Recipients at Just $2.38 Fees
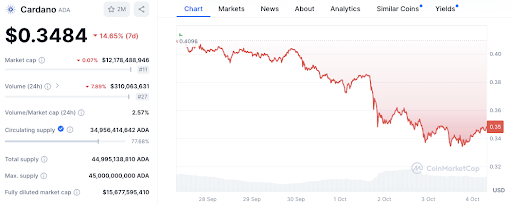
This decline was followed by minor moves around the $0.34–$0.35 range. As of October 4, the price is $0.348, but the overall trend is bearish.
Technical indicators, such as the MACD and RSI, also point to this negative sentiment. The MACD shows a bearish crossover, with the blue MACD line dropping below the orange signal line.
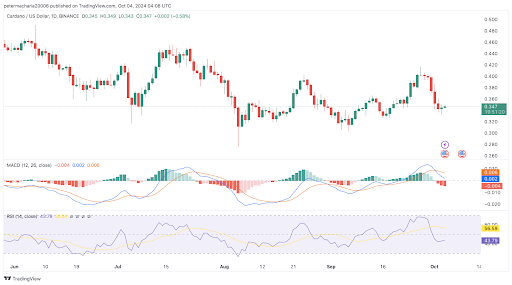
The RSI is at 43.79, indicating a bearish zone, although not yet in oversold territory.
Disclaimer: The information presented in this article is for informational and educational purposes only. The article does not constitute financial advice or advice of any kind. Coin Edition is not responsible for any losses incurred as a result of the utilization of content, products, or services mentioned. Readers are advised to exercise caution before taking any action related to the company.

 Price Prediction for April 2026: Will Chainlink Move Higher?")
 Price Prediction: Can Bulls Sustain the $0.045 Push?")

