 Price Prediction 2025, 2026, 2027, 2028-2030")
After weeks of decline, Celestia (TIA) has finally shown signs of reversal, with the price bouncing from a key demand zone near $1.30 and moving toward short-term resistance above $1.65.
With a notable bullish breakout on lower timeframes, multiple indicators are now shifting in favor of the bulls. As Celestia continues building its modular blockchain infrastructure, the latest technical setup may open doors to long-term recovery if momentum holds into 2025 and beyond.
TIA Projected Price Journey : 2025-2030
Celestia (TIA) Price Prediction 2025
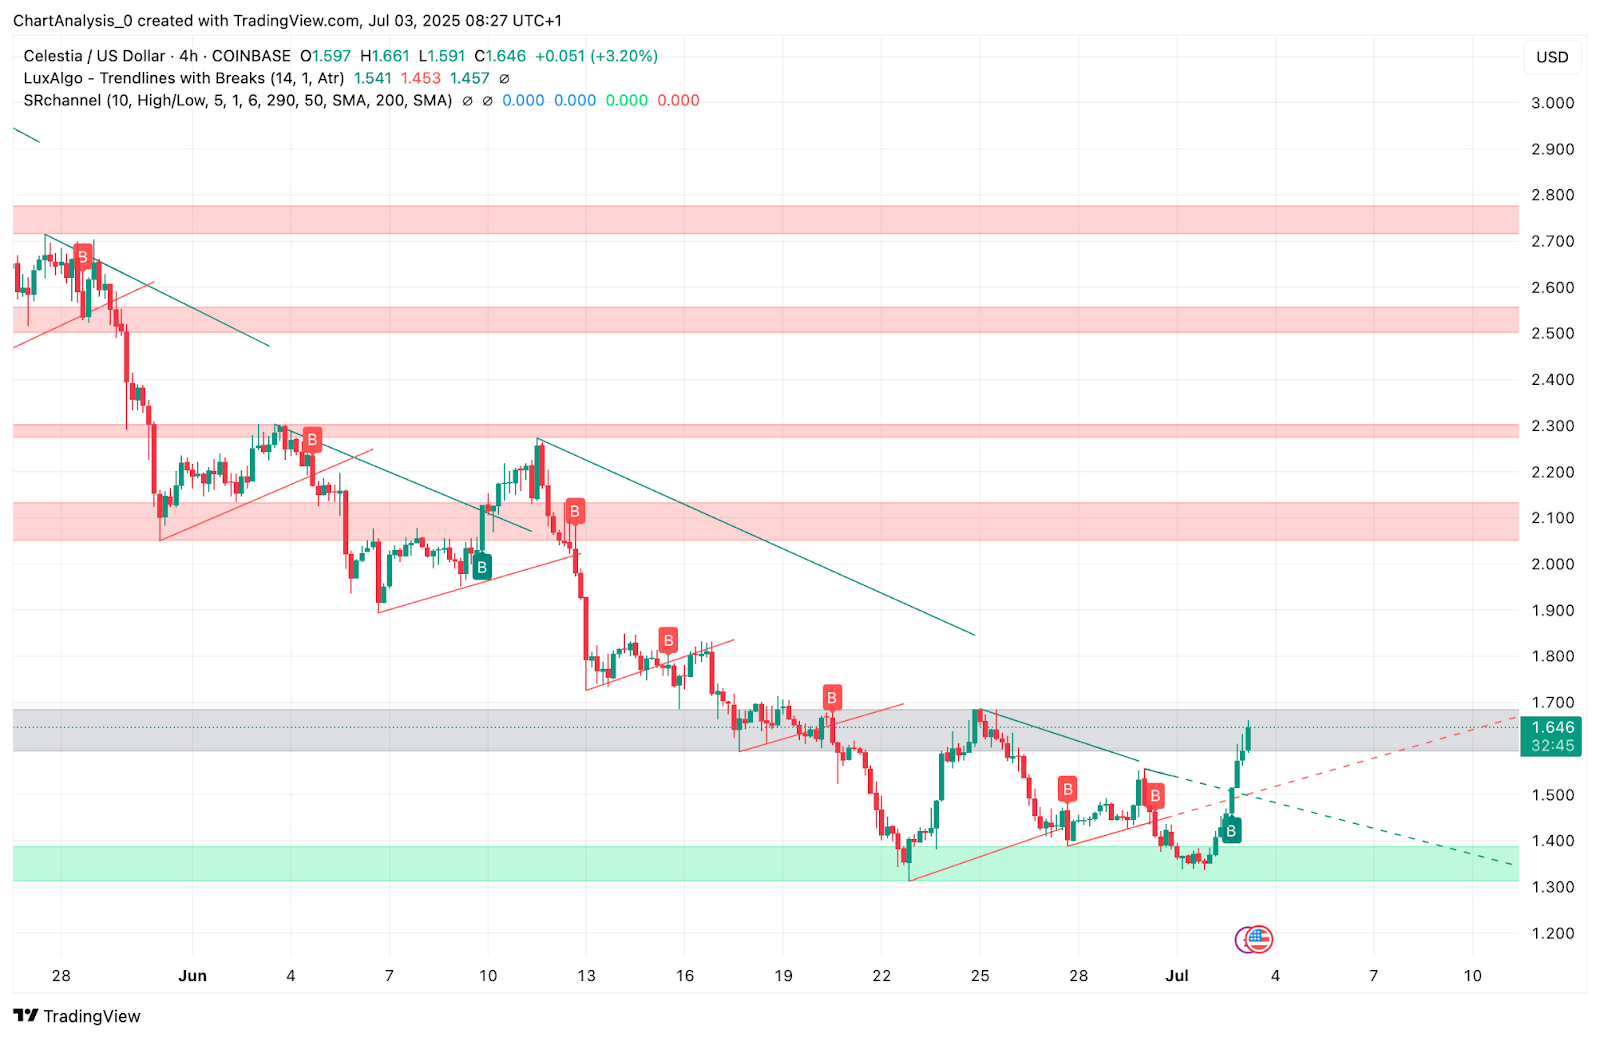
The Celestia price today is trading around $1.64, up sharply from the recent lows near $1.30. This recovery coincides with a structural rebound from a weekly demand block and a short-term break of descending resistance on the 4-hour chart. TIA has now cleared a series of lower highs and is testing the neckline of the previous distribution zone near $1.66–$1.70.
The breakout followed a liquidity sweep below the $1.35 low, marked by a Change of Character (CHoCH) and subsequent Break of Structure (BOS) on the Smart Money Concepts chart. If bulls can defend the $1.55–$1.60 range going forward, price may gradually grind toward the higher supply band between $1.93 and $2.44 before the end of 2025.
Celestia (TIA) Price Indicators, Signals, and Charts (1Y)
Several technical indicators are aligning to support Celestia’s early reversal setup:
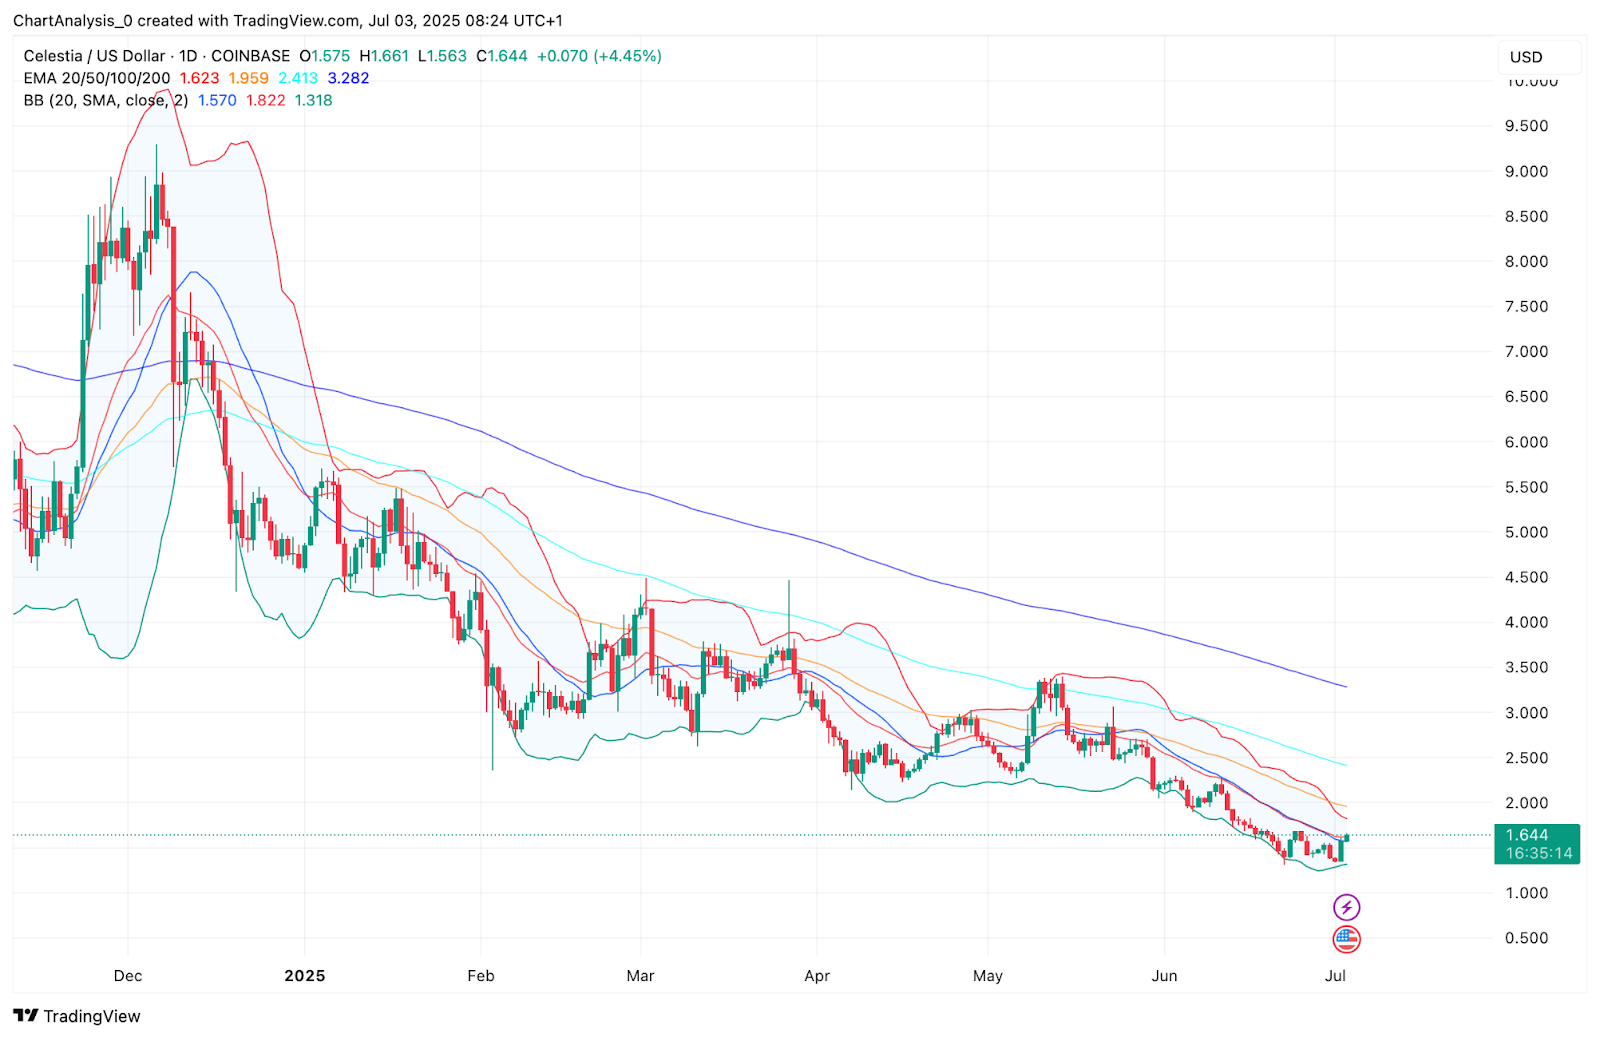
The EMA cluster on the daily chart has started to converge, with price reclaiming the 20 EMA ($1.62) and pushing just below the 50 EMA ($1.95). A confirmed hold above this cluster could shift momentum decisively in favor of the bulls. The longer-term 100 EMA and 200 EMA remain overhead near $2.41 and $3.28, respectively, offering resistance targets if trend continuation unfolds.
Bollinger Bands have expanded after weeks of tight compression. The breakout candle on July 2 closed above the mid-band, marking the first real shift in volatility toward the upside since May.
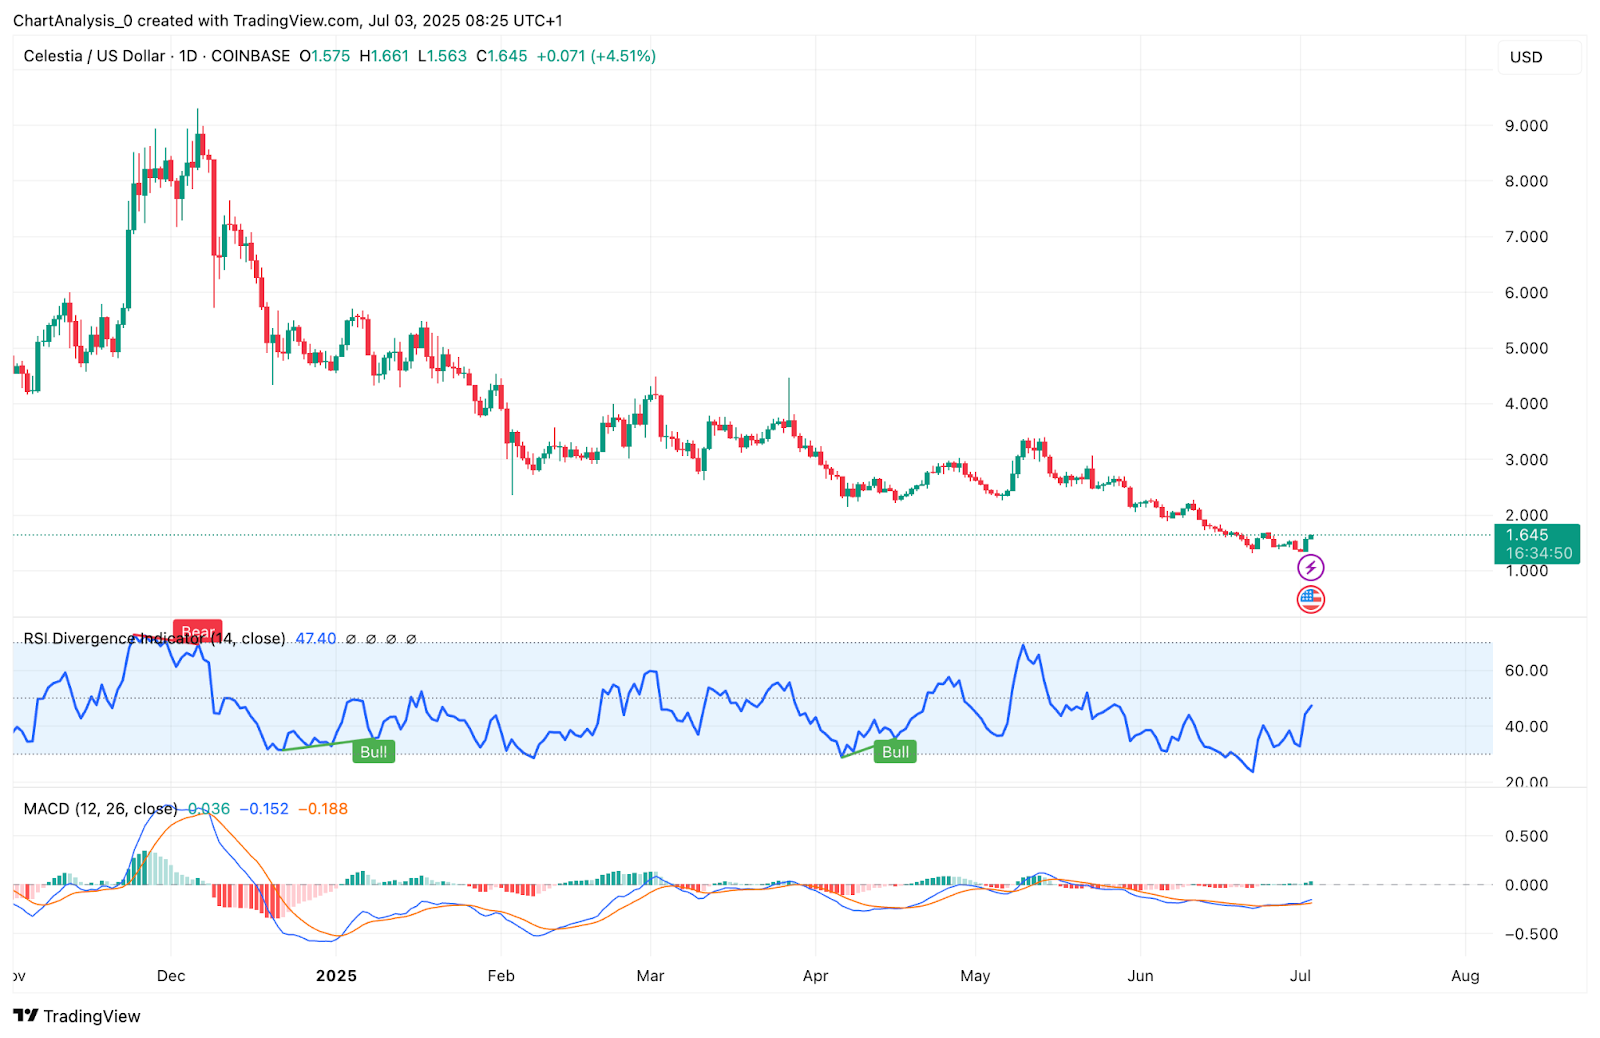
The RSI is currently at 47.40, trending higher after printing multiple bullish divergences below 40. If the RSI clears 50 in the coming sessions, this could indicate a return of sustainable buying pressure.
The MACD has produced a bullish crossover below the zero line, with the histogram flipping green and the MACD line now diverging from the signal line. This is a classic early trend reversal signal, especially after prolonged compression phases.
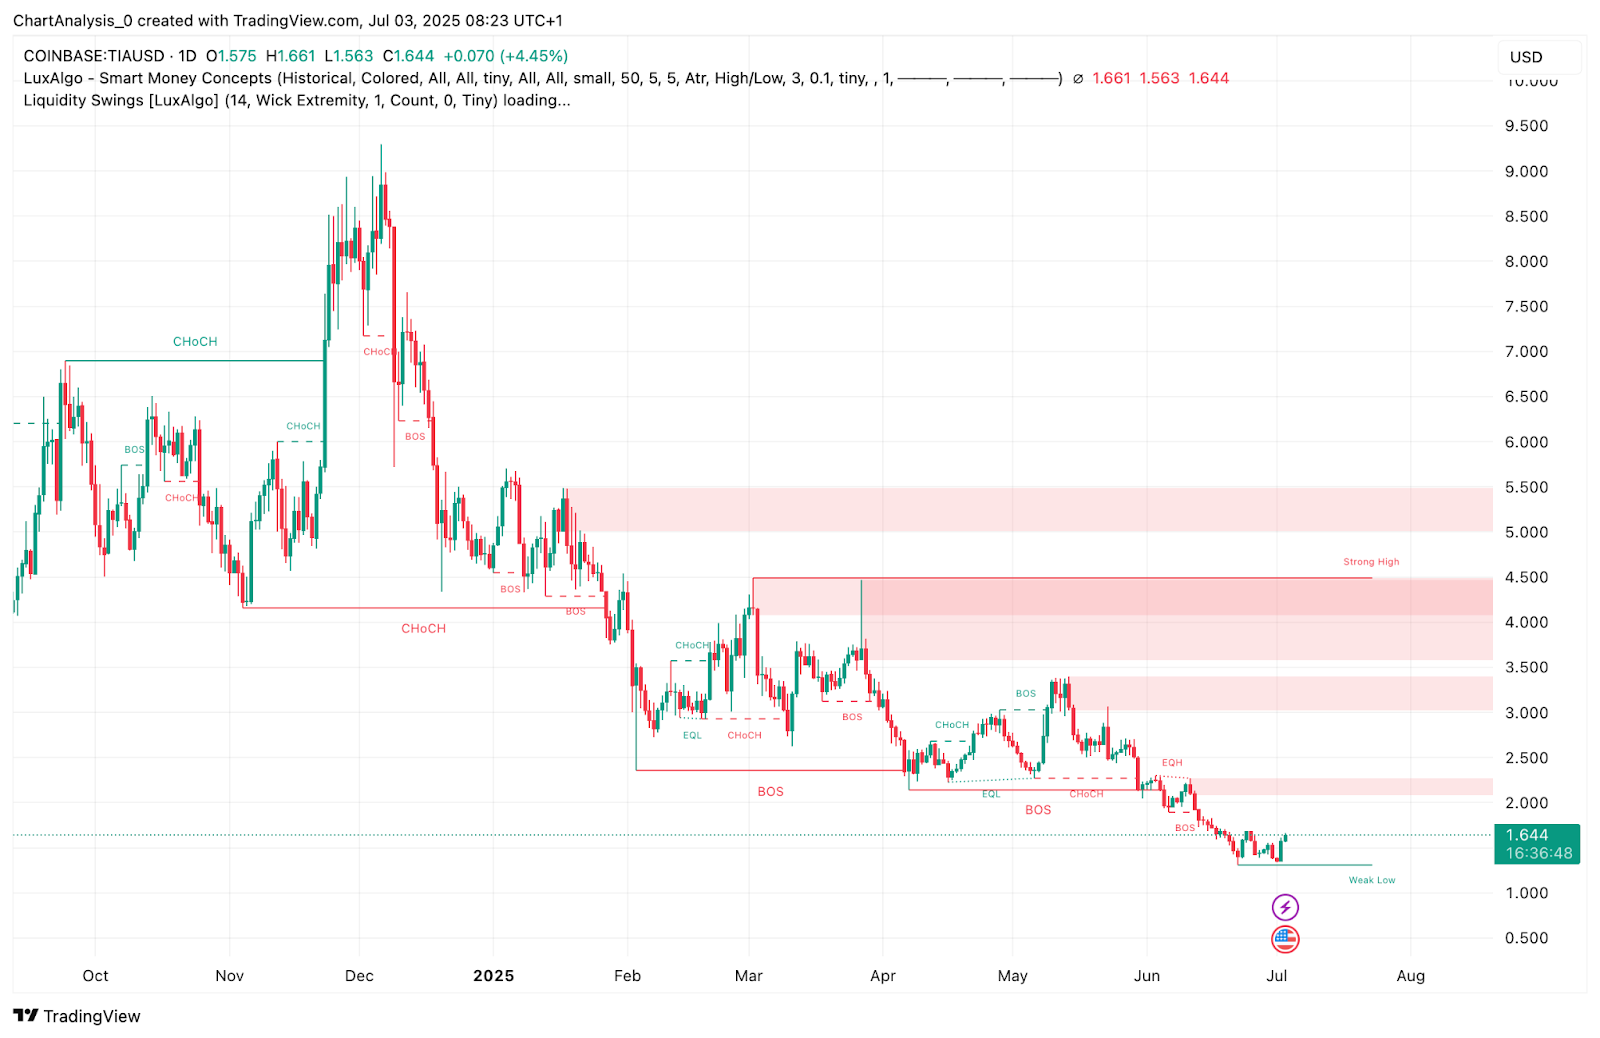
On the Smart Money Concepts (SMC) view, a clear CHoCH–BOS sequence was completed, with the price now trading just beneath a major inefficiency block. If volume supports a move above $1.70, the next imbalance lies near $1.93–$2.00.
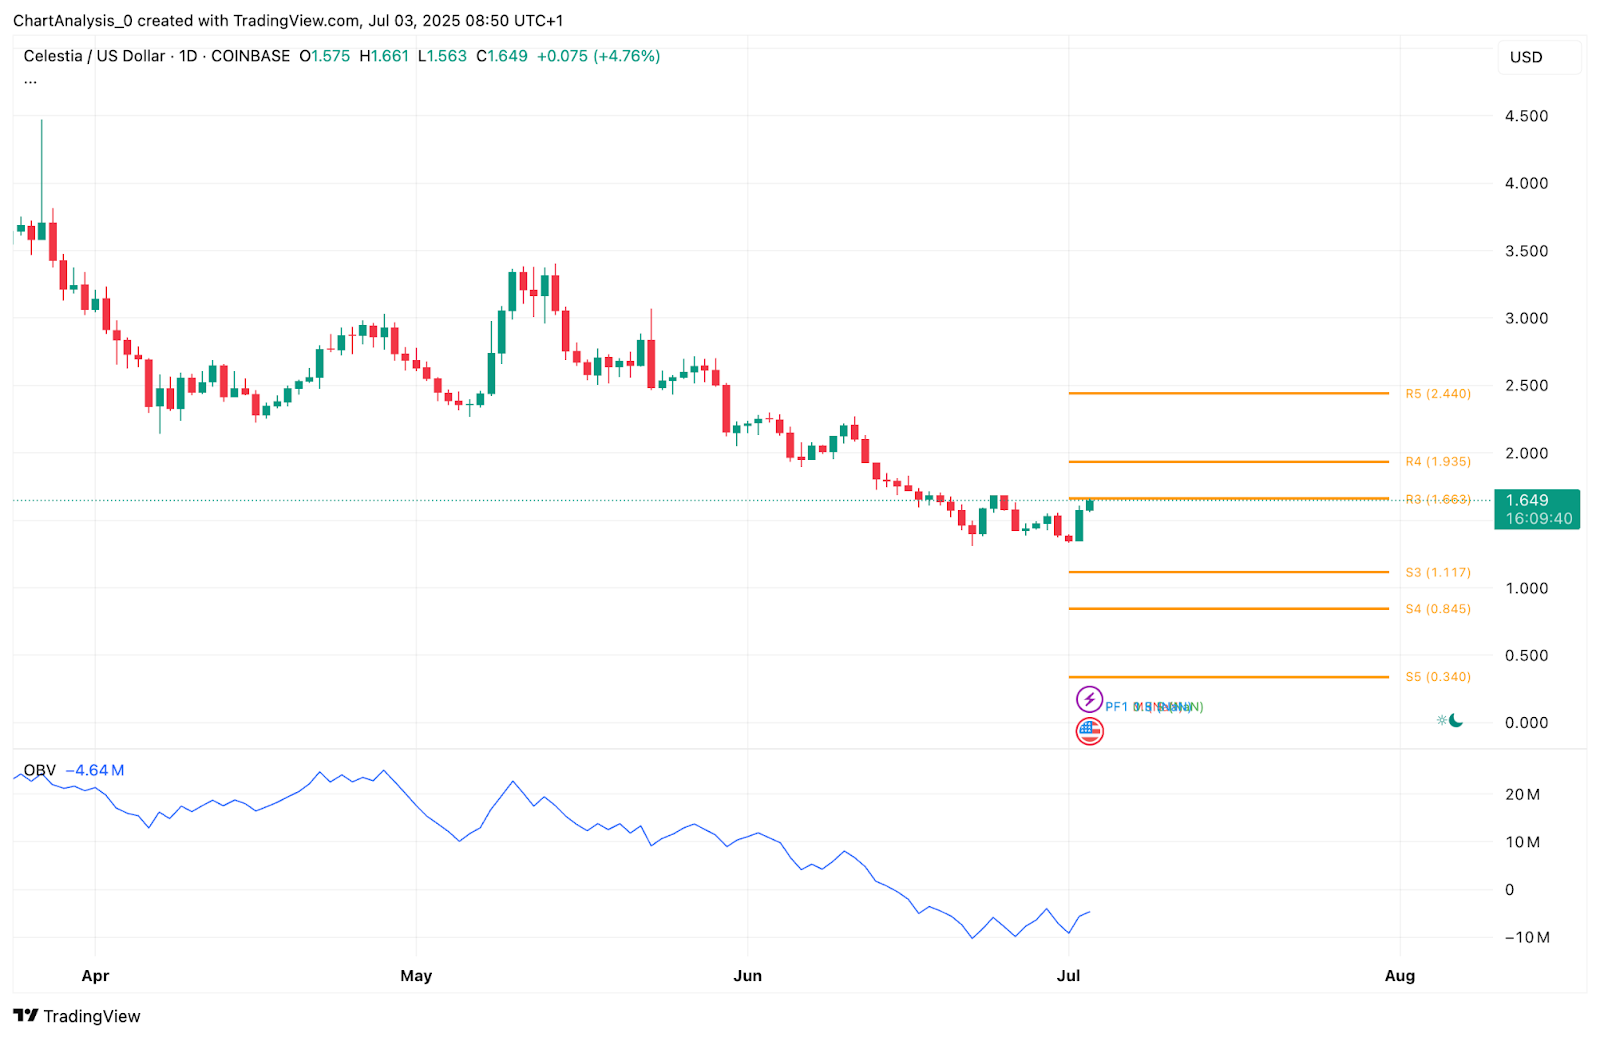
Lastly, pivot levels indicate R3 near $1.66 and R4 around $1.93, aligning closely with the 4H supply blocks and previous price reaction zones. If bulls push through these, a move toward $2.44 remains on the table for this cycle.
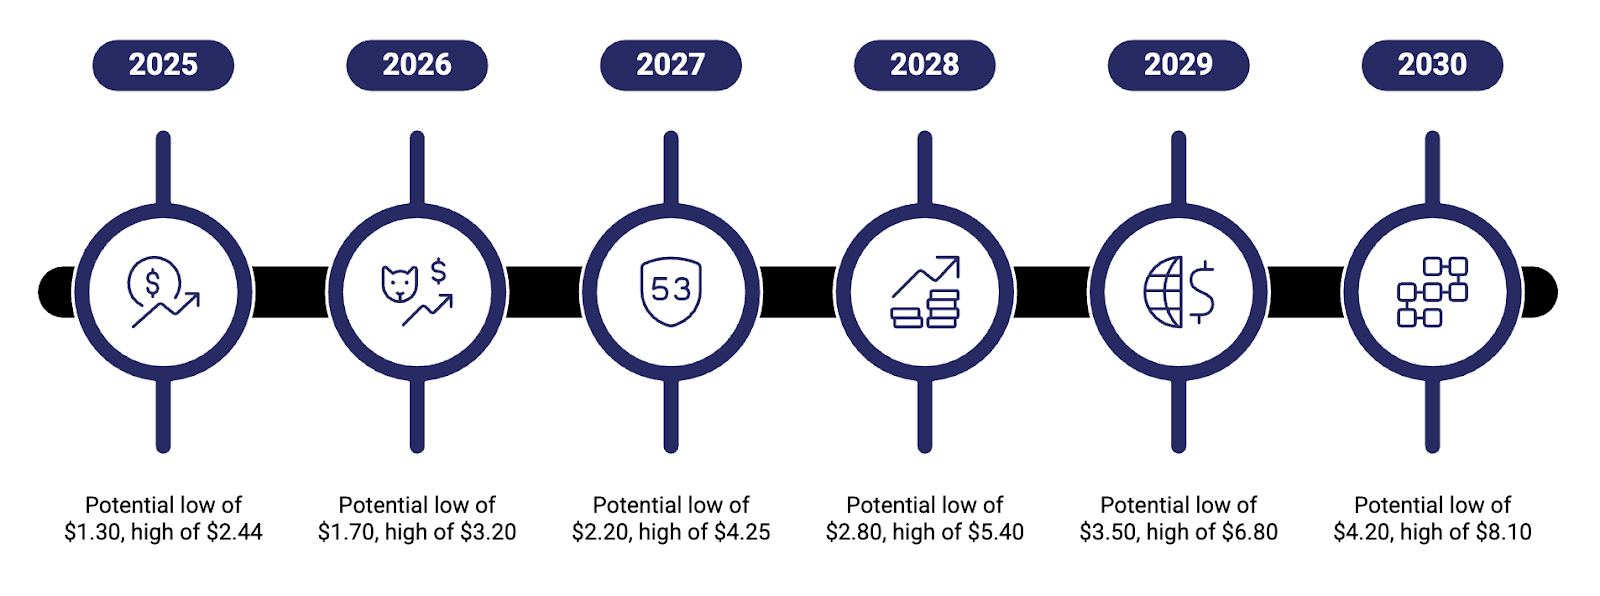
Celestia (TIA) Price Targets 2025–2030
| Year | Potential Low ($) | Potential Average ($) | Potential High ($) |
|---|---|---|---|
| 2025 | 1.30 | 1.95 | 2.44 |
| 2026 | 1.70 | 2.45 | 3.20 |
| 2027 | 2.20 | 3.10 | 4.25 |
| 2028 | 2.80 | 3.85 | 5.40 |
| 2029 | 3.50 | 4.60 | 6.80 |
| 2030 | 4.20 | 5.50 | 8.10 |
Celestia (TIA) Price Prediction 2026
In 2026, if Celestia gains further traction as the modular data availability layer of choice for rollups and L2s, broader adoption could support a push toward $3.00 or more. A breakout above the 200 EMA would reinforce this narrative. Long-term buyers may accumulate near the $1.70–$2.00 zone, forming a reliable structural base.
Celestia (TIA) Price Prediction 2027
By 2027, the rollout of scalable blockchain solutions may place Celestia at the center of the Web3 infrastructure stack. If RSI and MACD trends remain favorable, TIA could retest previous cycle highs near $4.00. Price may consolidate in a higher range between $2.50 and $3.50, with support from expanding development metrics.
Celestia (TIA) Price Prediction 2028
In 2028, institutional use of modular blockchains may ramp up, driving demand for TIA. If price holds a long-term bullish structure, targets near $5.40 are possible. The average yearly range could stay between $3.50–$4.00 during periods of consolidation before higher targets are reached.
Celestia (TIA) Price Prediction 2029
TIA may enter price discovery territory in 2029 if adoption accelerates across global blockchain ecosystems. With reduced selling pressure and strengthened on-chain metrics, price could reach $6.80. Long-term holders may find support forming around $3.50.
Celestia (TIA) Price Prediction 2030
By 2030, Celestia’s modular data layer could become foundational to blockchain architecture. If protocol integrations and ecosystem growth stay on track, a high near $8.10 may be realistic. A strong average yearly price near $5.50 would reflect maturing adoption across multiple industries.
Conclusion
Celestia’s recent bounce from multi-month lows signals the start of a potential structural reversal. Breakout confirmation on the 4H and daily charts, paired with favorable momentum signals across RSI, MACD, and Bollinger Bands, gives bulls an edge heading into Q3 2025. If the $1.55–$1.60 support holds and the price clears $1.93, the path toward $2.44 and beyond could develop steadily through the rest of the cycle.
Disclaimer: The information presented in this article is for informational and educational purposes only. The article does not constitute financial advice or advice of any kind. Coin Edition is not responsible for any losses incurred as a result of the utilization of content, products, or services mentioned. Readers are advised to exercise caution before taking any action related to the company.


