
- LINK exchange outflows signal strong accumulation despite slight price retracement
- Derivatives market activity surges, but Open Interest hints at cautious positioning
- Technicals show neutral RSI and bearish MACD, suggesting a possible consolidation phase
Chainlink (LINK) has recently demonstrated a notable trend, a consistent outflow from exchanges, paired with a rising price. According to Sentora (previously IntoTheBlock) data, since June 20, approximately 3.86 million LINK tokens, worth around $51.26 million, have left centralized exchanges. This pattern often indicates a shift in investor behavior from short-term trading to long-term holding.
Typically, such withdrawals reduce sell pressure and hint at accumulating positions by retail and institutional holders alike. Interestingly, even with a small pullback in LINK’s price as of press time, dropping 1.72% to $13.22, the asset has shown resilience, rising 11.91% over the past week.
Exchange Outflows and Price Resilience
Sentora further indicates from June 21 to June 30, LINK consistently experienced net outflows across major exchanges. On June 22, outflows spiked sharply, falling below 664,000 LINK in a single day. Despite this, the token’s price climbed steadily from below $12 to over $13.60.
Related: Chainlink Facilitates Secure Exchange of Hong Kong CBDC and Australian Stablecoin
This inverse correlation between declining exchange balances and increasing price typically signals bullish investor sentiment. Investors often move assets off exchanges when they intend to hold or stake, rather than sell. This suggests that LINK holders anticipate future gains and prefer to secure their holdings long term.
Derivatives Market Sees Increased Activity
Besides spot market movements, LINK’s derivatives market is showing notable fluctuations. Over the last 24 hours, trading volume surged by 54.13%, reaching over $611 million. This spike reflects increased speculative interest. However, Open Interest dropped slightly by 0.12%, suggesting that some traders may have exited positions or taken profits.
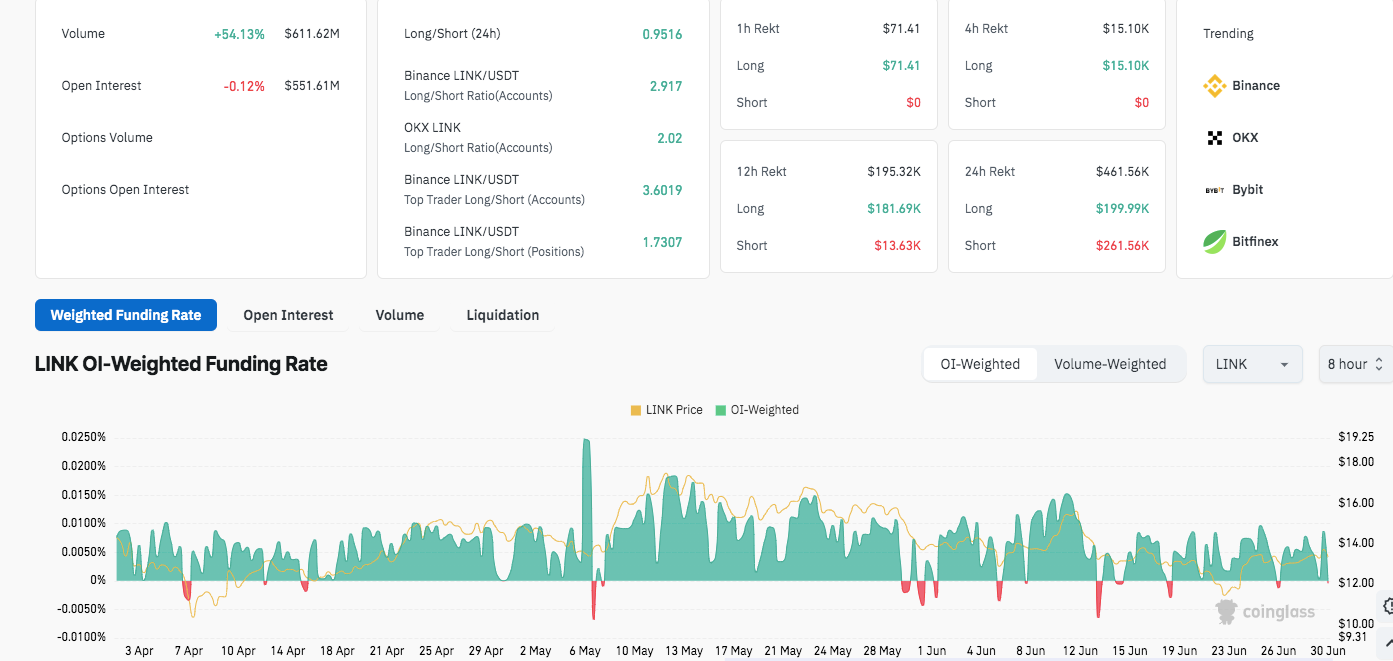
Funding rates remain within typical bullish ranges, mostly between 0.0025% and 0.01%. However, spikes above 0.015% might signal overheated long positions, often a precursor to corrections.
Related: Chainlink Consolidates Near $16, Eyeing Breakout Amid Investor Accumulation
On the other hand, dips below 0.005% may signal potential bottoming and opportunities for contrarian longs.
Technical Indicators Suggest Caution
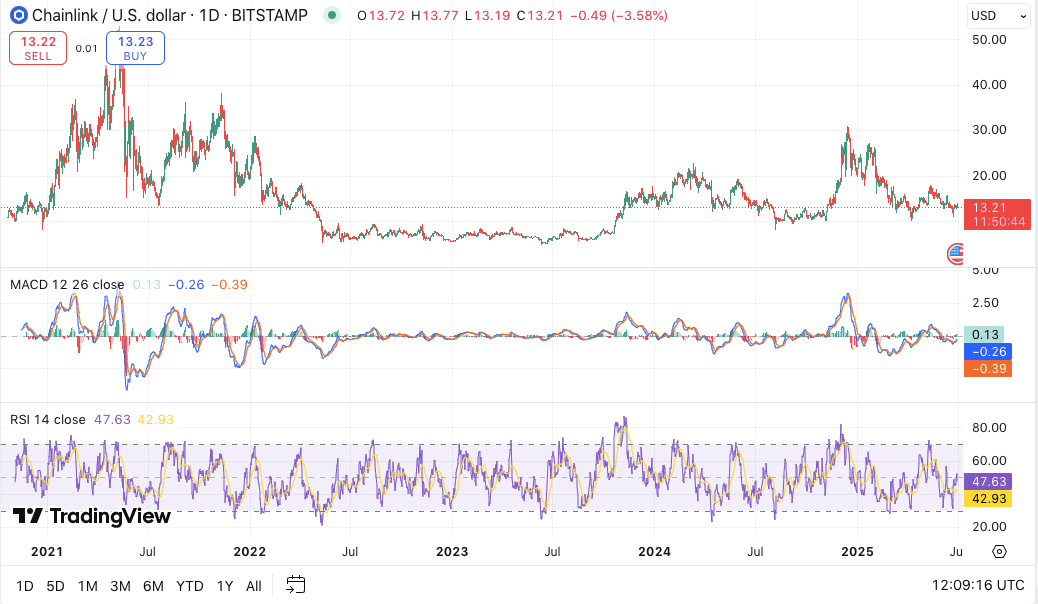
From a technical standpoint, the MACD remains in a neutral to slightly bearish position. The MACD line sits at 0.13, while the signal line lags at 0.26. The histogram reflects minor bearish momentum.
Meanwhile, the RSI stands at 47.80, suggesting that LINK is neither overbought nor oversold. This places the token in a consolidation zone, where the next move could swing in either direction.
Disclaimer: The information presented in this article is for informational and educational purposes only. The article does not constitute financial advice or advice of any kind. Coin Edition is not responsible for any losses incurred as a result of the utilization of content, products, or services mentioned. Readers are advised to exercise caution before taking any action related to the company.


