Price Prediction 2025, 2026, 2027-2030")
After months of range-bound price action, Chainlink (LINK) is once again challenging resistance near the $15 mark. With momentum indicators strengthening and long-term trendlines converging, LINK may be positioning for a major macro breakout.
Chainlink’s Projected Price Growth 2025-2030
Chainlink (LINK) Price Prediction 2025
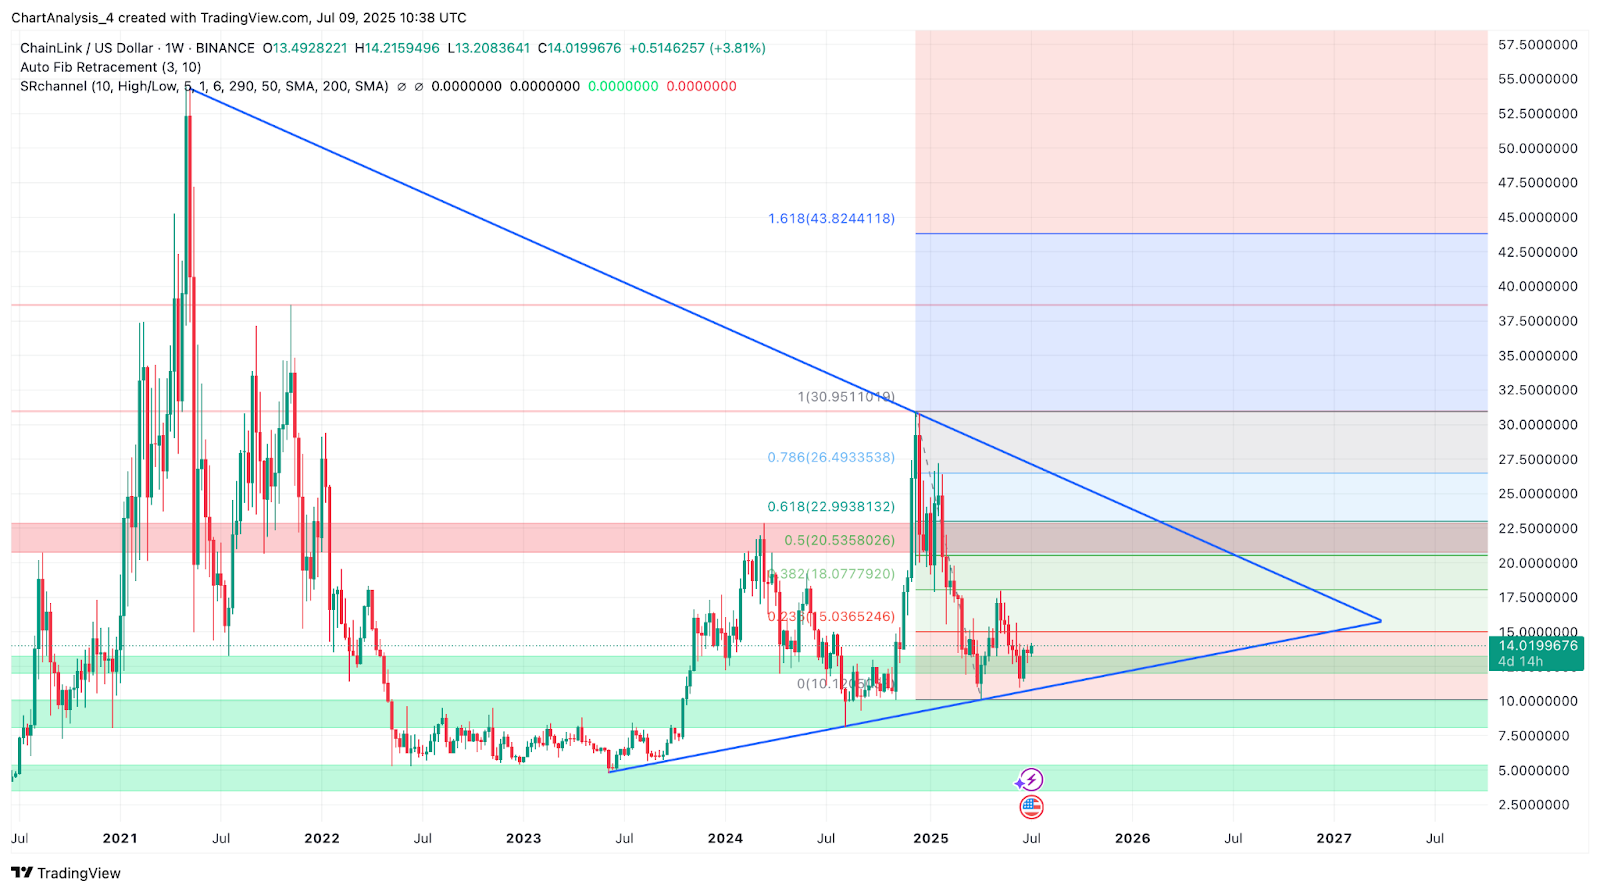
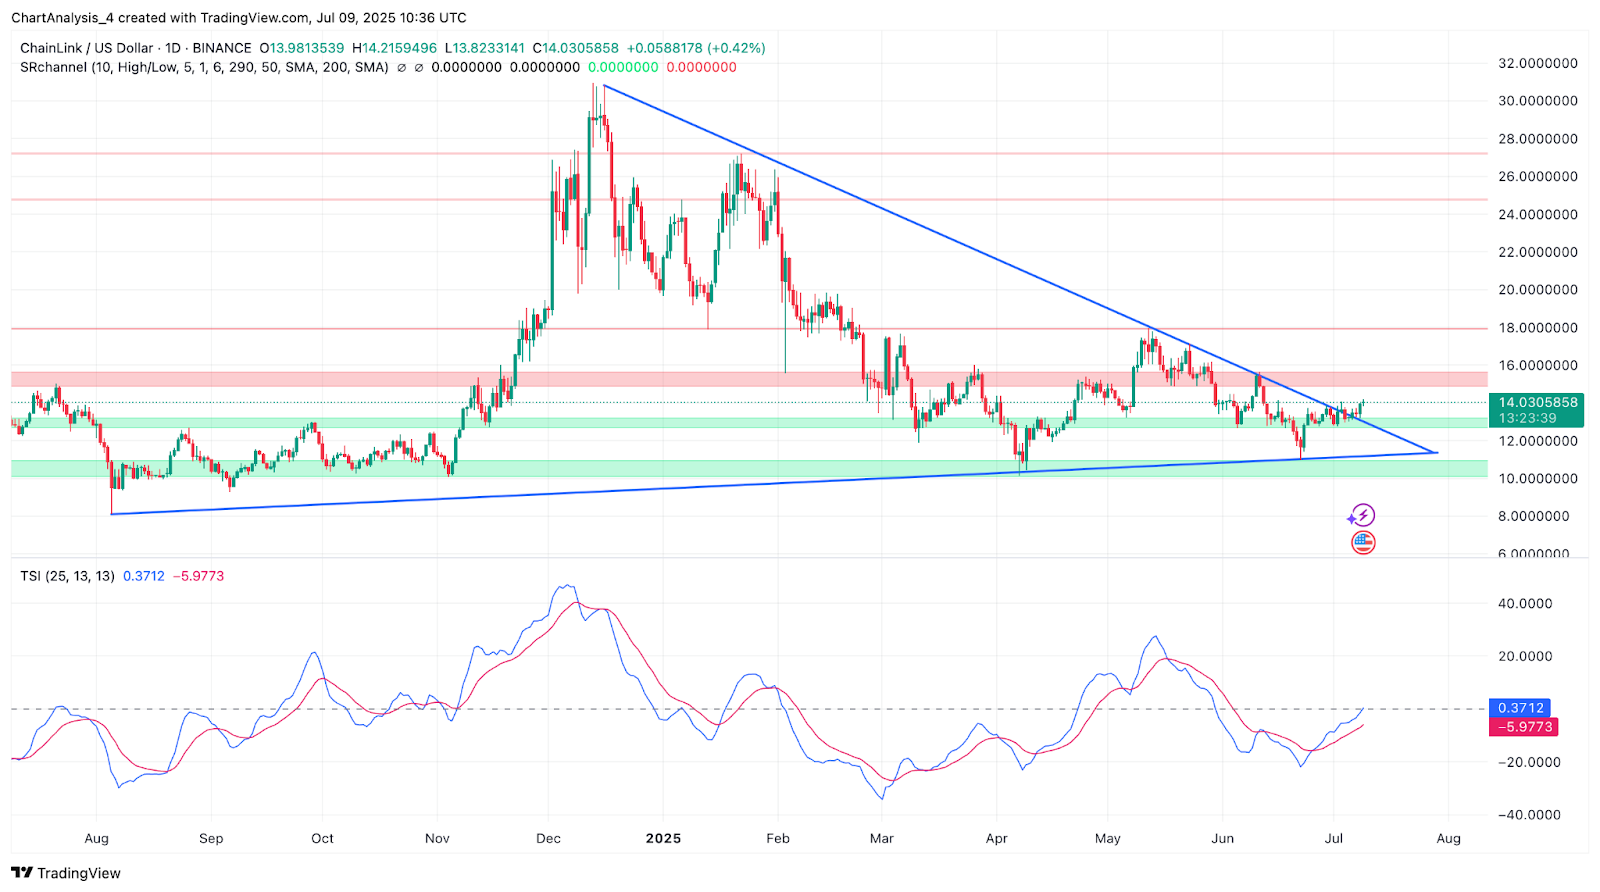
Chainlink (LINK) is currently consolidating near the upper boundary of a long-term symmetrical triangle that began forming in 2022. Price recently bounced from a major ascending support zone near $11, and is now retesting the descending resistance trendline that has capped rallies since 2021. While a confirmed breakout hasn’t occurred yet, daily structure shows signs of strength.
On the higher timeframe, the weekly Fibonacci retracement from the 2021 high to 2022 low shows that price is near the 0.236 level at $15.03, with major targets above at 0.382 ($18.07), 0.618 ($22.99), and 0.786 ($26.49). The 1.0 and 1.618 extension levels sit at $30.95 and $43.82 respectively, though these remain long-term projections.
LINK Price Indicators, Signals and Charts (1y)

Chainlink has reclaimed key moving averages on the daily timeframe, trading above the 20, 50, and 100 EMAs, with the 200 EMA at $15.13 acting as short-term resistance. The alignment of these EMAs near price signals an inflection zone, and a close above the 200 EMA would likely open the door to bullish continuation.
The Bollinger Bands have begun expanding after a tight contraction phase. The current price move is testing the upper band, reflecting early volatility expansion. This suggests momentum is building for a breakout from the months-long coil.
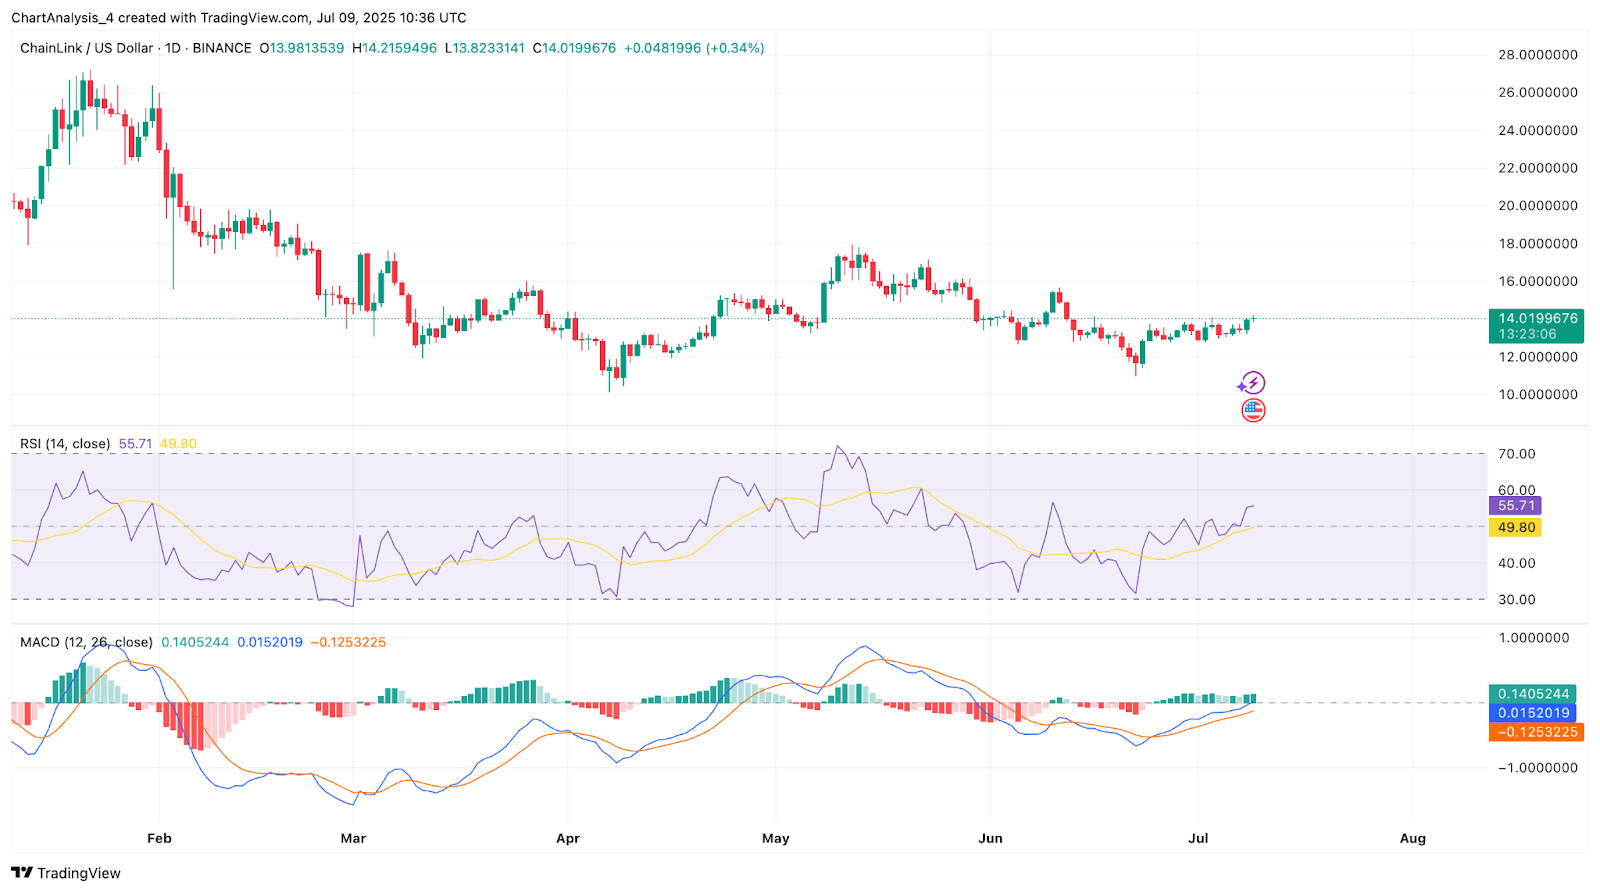
Momentum indicators reinforce the bullish shift. The RSI (14) sits at 55.71, climbing steadily out of neutral territory. Meanwhile, the MACD has completed a bullish crossover, and its histogram is printing increasingly positive bars. This setup is typically associated with trend resumption, especially after prolonged consolidation.
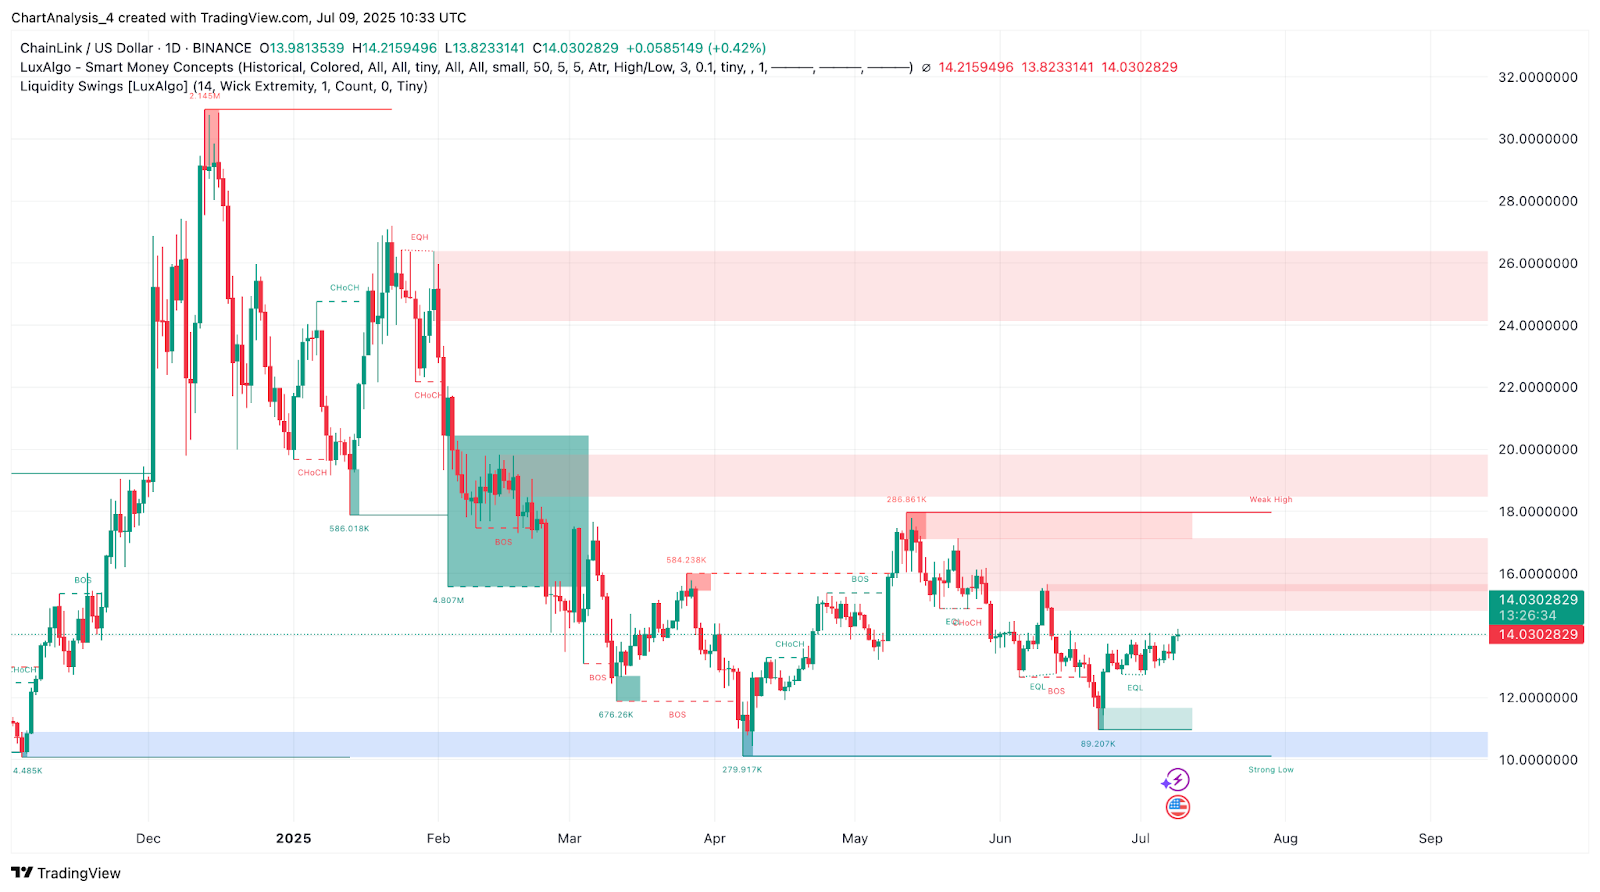
Smart Money Concepts indicate a BOS from the June range, with the recent rally pushing price toward the $14.00–$14.50 liquidity zone. A strong daily close above $15.13 could trigger a run toward the next supply cluster at $18.00–$20.50. The current compression near the apex of the wedge suggests that a larger move is approaching.
True Strength Index (TSI) on the daily is now above zero for the first time in weeks, crossing with upward momentum. This confirms that the July rally is not purely reactive but underpinned by increasing market strength.
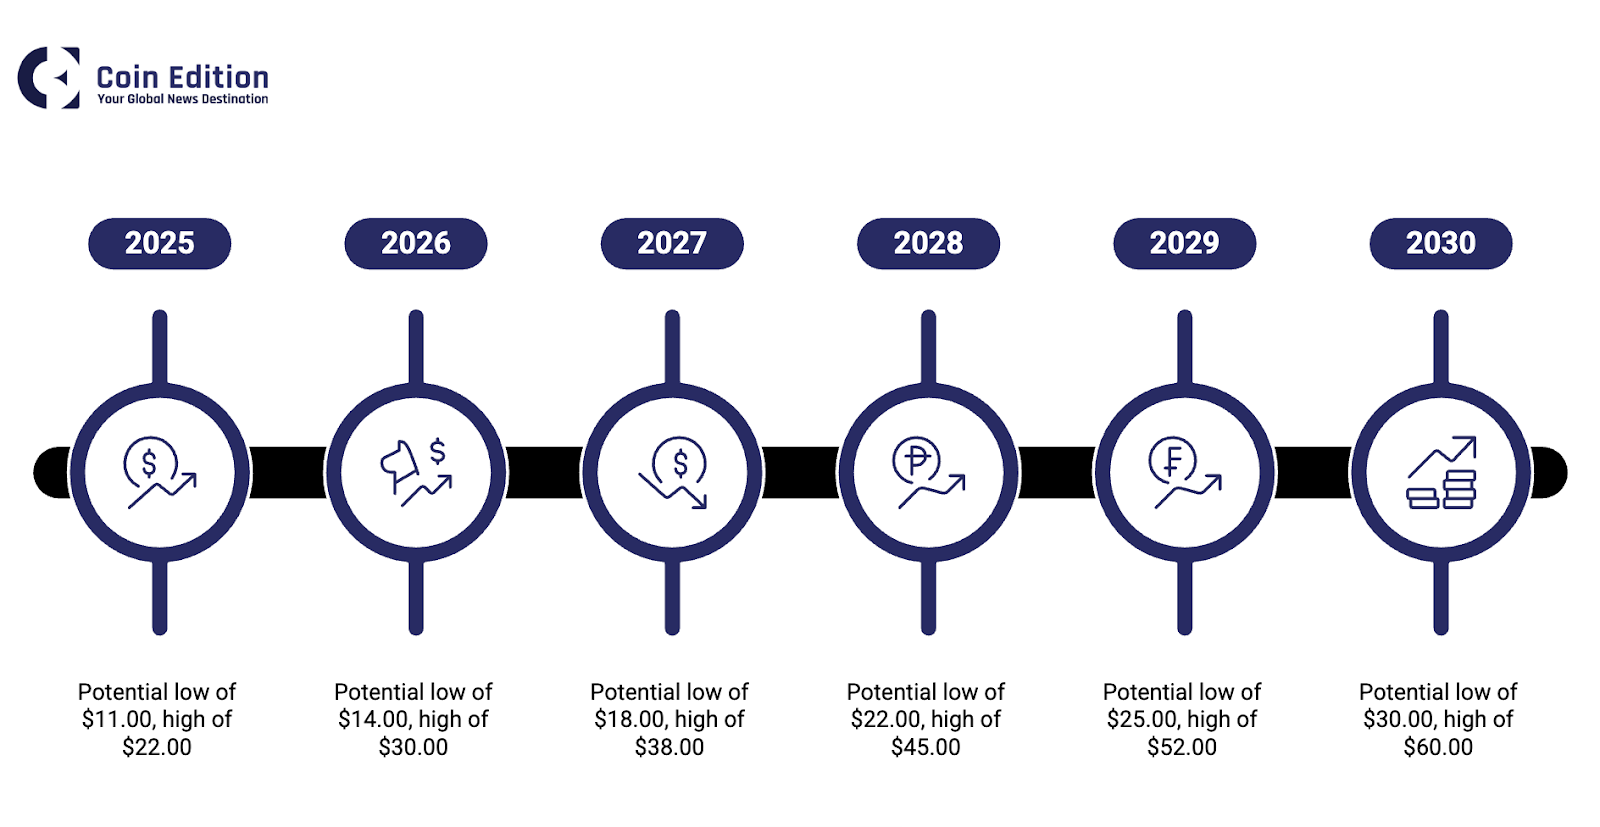
Chainlink (LINK) Price Targets 2025–2030
| Year | Potential Low ($) | Potential Average ($) | Potential High ($) |
| 2025 | 11.00 | 15.00 | 22.00 |
| 2026 | 14.00 | 20.50 | 30.00 |
| 2027 | 18.00 | 26.00 | 38.00 |
| 2028 | 22.00 | 32.00 | 45.00 |
| 2029 | 25.00 | 38.00 | 52.00 |
| 2030 | 30.00 | 44.00 | 60.00 |
Chainlink (LINK) Price Prediction 2026
In 2026, if LINK breaks and sustains above $22.99 (0.618 Fib), the price could gain momentum toward $30. A broader altcoin recovery and Chainlink’s continued role in data infrastructure may attract long-term capital. Support is likely to form between $14.00 and $16.50.
Chainlink (LINK) Price Prediction 2027
As institutional oracles gain prominence, LINK may challenge prior mid-cycle highs. If price maintains trend structure, the 2027 high could reach $38, with average price stabilizing near $26.00. Fibonacci symmetry and wedge breakout momentum would drive the move.
Chainlink (LINK) Price Prediction 2028
A full macro breakout scenario may play out in 2028, where LINK enters a parabolic phase. Price could approach the $45.00 zone if market-wide bullish sentiment peaks. Retracements may retest $22–$25, but long-term structure would remain intact.
Chainlink (LINK) Price Prediction 2029
The 2029 cycle could target extended Fibonacci projections, with $52.00 representing a realistic upper band if LINK continues its multiyear uptrend. The yearly average may hover near $38.00, with dips likely bought up above the $30 zone.
Chainlink (LINK) Price Prediction 2030
By 2030, Chainlink may fully reclaim and exceed its historical all-time highs, especially if the protocol continues evolving as an indispensable oracle layer. Price discovery could push LINK as high as $60.00, while the average stabilizes near $44.00 amid volatility.
Conclusion
Chainlink (LINK) is coiling at the edge of a multi-year symmetrical wedge, with EMAs, volume, and structure aligning for a potential breakout. While the $15–$16 range remains immediate resistance, momentum is building. If bulls reclaim the 200 EMA and push above $18, LINK could unlock its next major leg toward $22–$30. Long-term technicals remain supportive through 2030.
Disclaimer: The information presented in this article is for informational and educational purposes only. The article does not constitute financial advice or advice of any kind. Coin Edition is not responsible for any losses incurred as a result of the utilization of content, products, or services mentioned. Readers are advised to exercise caution before taking any action related to the company.