
- LINK is pressing a critical rising trendline near $12, with repeated tests increasing breakdown risk.
- Short-term structure remains weak below the EMA cluster, keeping rallies corrective rather than trend-changing.
- Long-term infrastructure narratives around CCIP and value capture support the broader outlook, but charts still demand confirmation.
Chainlink price today trades near $12.15 after another rejection from short-term resistance, keeping LINK pinned near the lower end of its December range. Sellers continue to control momentum as price compresses above a rising long-term trendline, while buyers hesitate to step in aggressively ahead of the $12 support zone.
Short-Term Structure Weakens As Intraday Momentum Slows
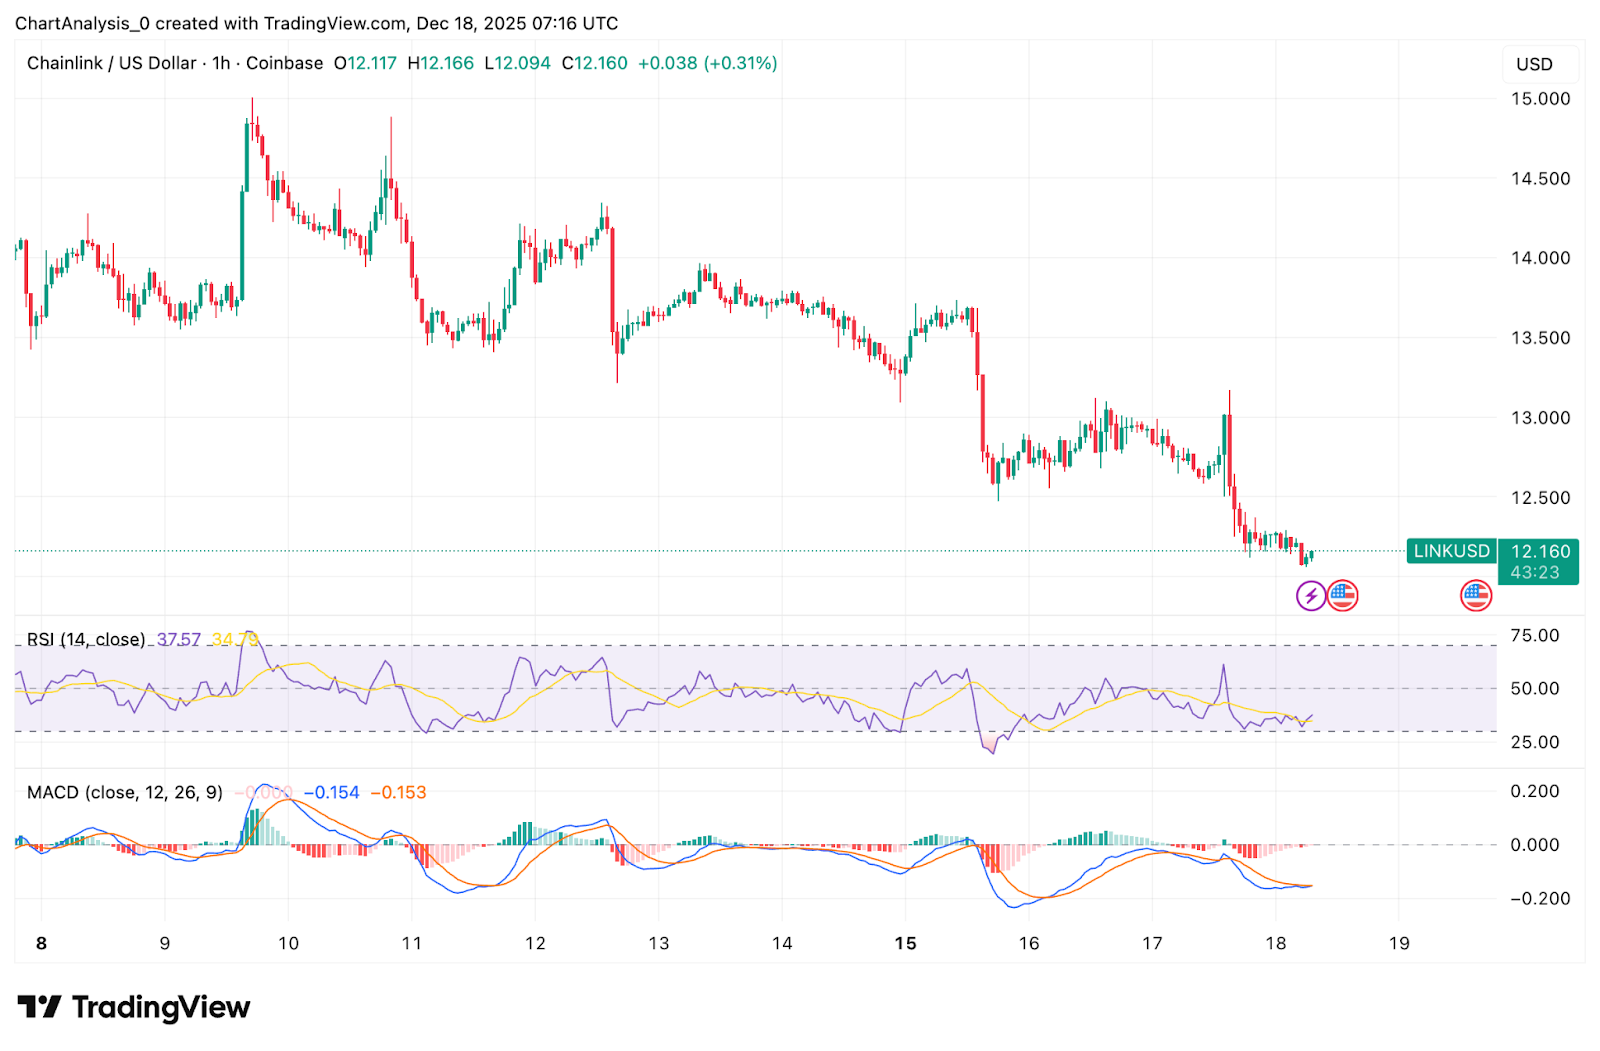
On the 1-hour chart, LINK has shifted into a clear short-term downtrend. Price has printed a sequence of lower highs since the sharp selloff earlier this week, with rebounds repeatedly failing near the $12.90 to $13.10 area. That zone has now turned into firm intraday resistance.
Momentum indicators confirm the slowdown. RSI is holding in the mid-30s, signaling persistent downside pressure without reaching deeply oversold conditions. That behavior suggests sellers are still in control, but aggressive downside acceleration has paused for now.
MACD remains below the zero line, with signal lines drifting sideways. The lack of bullish crossover reflects fading upside momentum rather than capitulation. In short, LINK is not bouncing with conviction. It is stabilizing under pressure.
As long as price remains below $12.60 on the hourly timeframe, intraday rallies are likely to attract supply rather than fresh demand.
Daily Chart Shows LINK Pressing Long-Term Trend Support
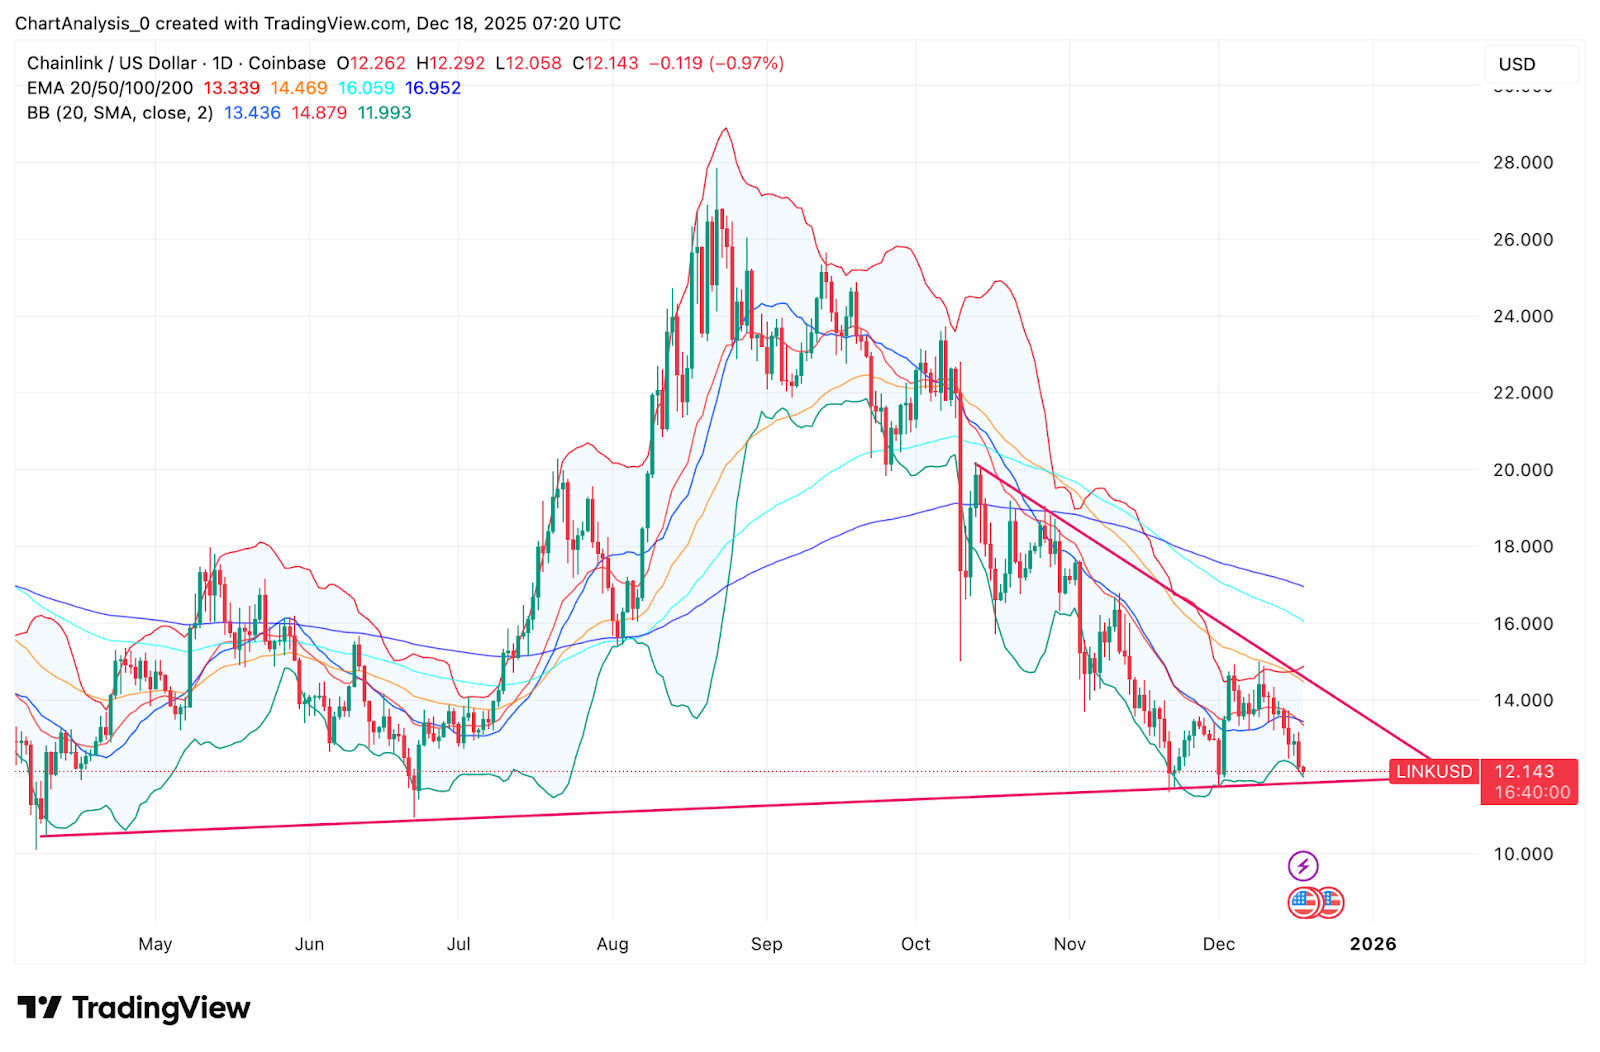
The daily chart adds more context to the current standoff. LINK is trading below all major EMAs, with the 20-day near $13.34, the 50-day around $14.47, and the 100-day and 200-day stacked well above price. This downward EMA structure confirms that the broader trend remains bearish.
More importantly, LINK is now pressing directly against a rising long-term trendline that has held since early 2024. This trendline intersects near the $12.00 to $12.10 region, making it the most critical level on the chart.
Related: Pi Price Prediction: PI Faces Selling Pressure as Price Weakens & Unlocks Loom
Repeated tests of this support without a meaningful bounce increase the risk of a breakdown. However, the fact that price continues to respect this line suggests buyers are still defending longer-term structure, even as short-term momentum fades.
Bollinger Bands have narrowed on the daily chart, reflecting compression after weeks of decline. When volatility contracts at major trend support, the next move often carries follow-through.
Resistance Stacks Above As Sellers Defend EMA Cluster
Any recovery attempt faces immediate hurdles. The first upside barrier sits near $13.30, aligned with the 20-day EMA and recent breakdown structure. A move above that level is required just to relieve short-term pressure.
Beyond that, the $14.40 to $14.90 zone represents heavier resistance, where the 50-day EMA and prior consolidation overlap. Sellers have defended this area aggressively throughout November and December.
As long as LINK trades below this EMA cluster, the broader market will continue to view rallies as corrective rather than trend-changing.
Long-Term Narrative Resurfaces Amid Infrastructure Focus
While charts remain fragile, the fundamental narrative around Chainlink has resurfaced this week. During a recent discussion, Lark Davis described LINK as an “infinitely better asset” than XRP over the next decade, citing Chainlink’s role as infrastructure rather than a closed payment system.
The argument centers on interoperability. Chainlink’s CCIP framework positions it as connective tissue between blockchains, a theme gaining relevance as tokenized assets, regulated access, and cross-chain settlement expand.
Davis also pointed to recent token buyback initiatives as a shift toward clearer value capture for LINK holders. After years of focusing on utility and adoption, that change has begun to alter long-term perception.
This narrative contrast matters. While XRP continues to attract institutional inflows through ETFs, questions around daily usage and growth remain. Chainlink’s appeal lies less in speculation and more in infrastructure demand, which tends to play out over longer cycles.
Outlook. Will Chainlink Go Up?
The bullish case depends on defending the $12.00 to $12.10 trendline and reclaiming $13.30. A daily close above the 20-day EMA would signal stabilization and open room toward $14.50, where sellers are likely to re-engage.
The bearish case triggers if LINK loses the rising trendline on a daily close. A clean break below $12.00 would invalidate long-term support and expose downside toward the $11.00 and $10.20 demand zones.
Disclaimer: The information presented in this article is for informational and educational purposes only. The article does not constitute financial advice or advice of any kind. Coin Edition is not responsible for any losses incurred as a result of the utilization of content, products, or services mentioned. Readers are advised to exercise caution before taking any action related to the company.


 Price Prediction: Canton Eyes Key Break After Market Activity Spike")

