
- LINK trades in a tight range as bearish structure limits upside attempts
- Weak open interest signals reduced leverage and cautious market positioning
- Spot inflows hint at early accumulation despite broader market weakness
Chainlink (LINK) continues to trade within a narrow range after a sharp decline that began earlier in the year. The broader structure shows sustained bearish pressure, while recent price action reflects consolidation rather than a clear reversal. The market currently balances between weakening momentum and short bursts of buying interest.
Price Structure and Key Levels
LINK maintains a clear bearish structure marked by consistent lower highs and repeated rejections at resistance. The price trades within a defined range between approximately $8.40 and $9.50.
This zone acts as a short-term battleground for buyers and sellers. However, repeated failures to hold above $9.96 suggest that sellers maintain control.
Moreover, downside risk remains present if LINK loses support near $8.40. A break below this level could open the path toward $7.20, which represents a recent swing low. Besides, this level may attract buyers again if price approaches it.
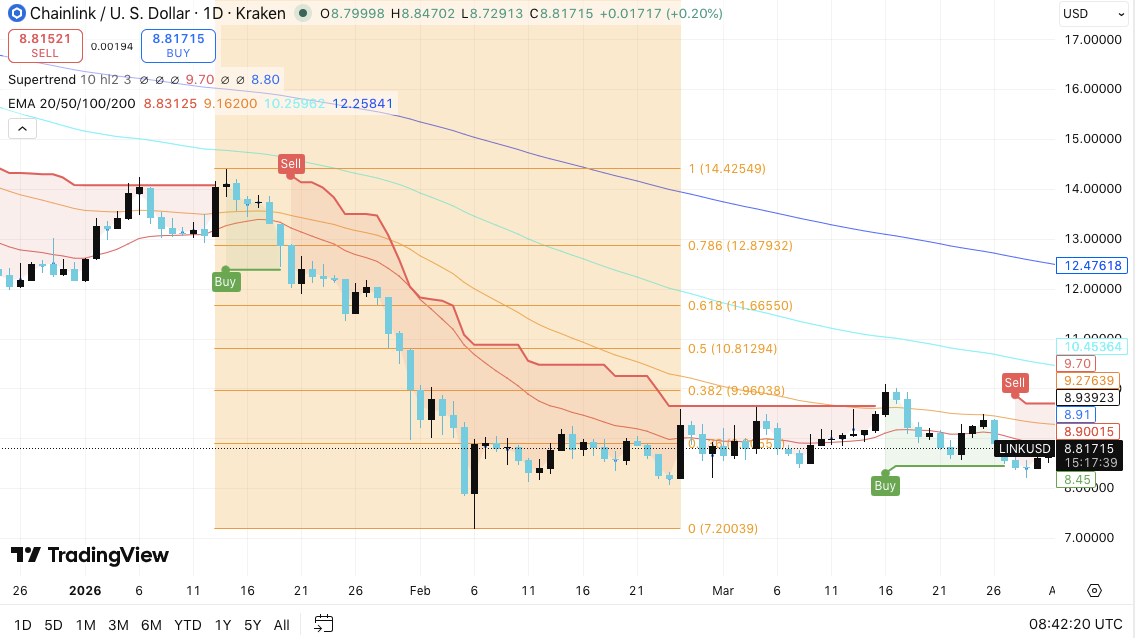
On the upside, LINK faces layered resistance at $9.96, $10.81, and $11.66. These levels align with Fibonacci retracement zones, which often act as decision points. Consequently, price must reclaim and hold above these levels to signal a meaningful trend shift.
Related: RedStone Price Prediction: RED Jumps 118% as Bulls Target $0.276
Additionally, the moving averages reinforce the bearish outlook. The 20 EMA near $8.83 and 50 EMA near $9.16 both act as overhead resistance. The 100 EMA and 200 EMA remain far above current price. Hence, LINK must break several technical barriers before confirming a bullish reversal.
Market Activity and Capital Flows
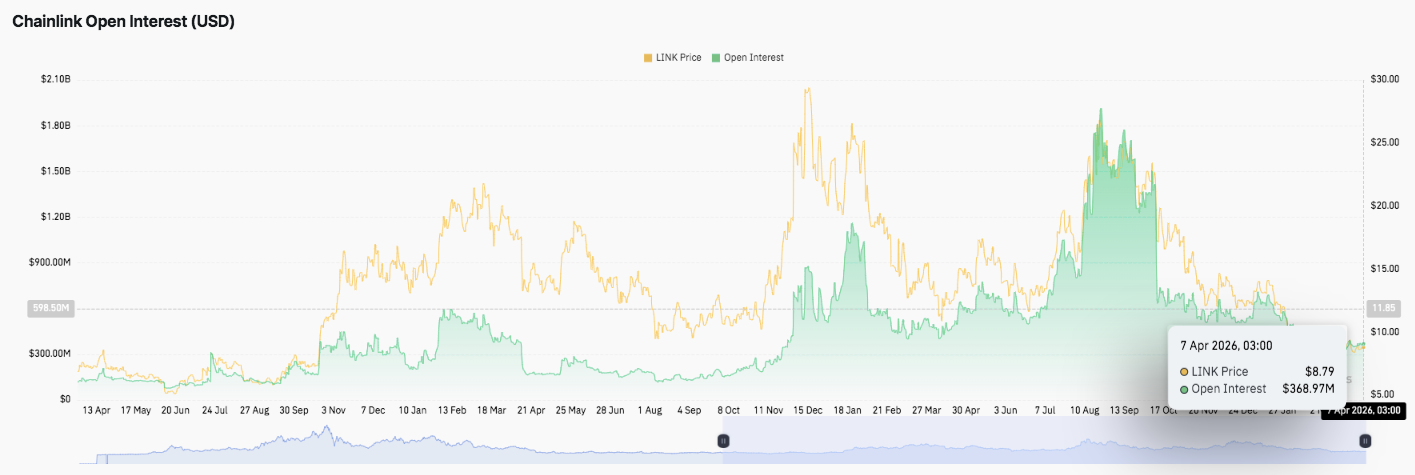
Open interest data shows a declining trend after earlier spikes in 2025. These spikes often aligned with strong price movements and increased speculation. However, the recent drop in open interest to around $368.97 million signals reduced leverage and lower aggressive positioning.
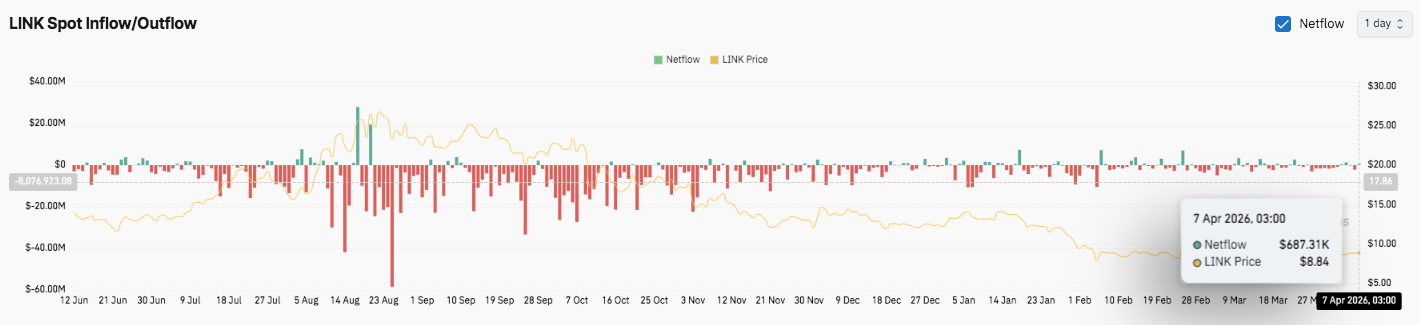
Additionally, the current spot flow data reveals a net inflow of approximately $687,310. This suggests mild accumulation despite the broader weakness. Moreover, inflows during consolidation periods often indicate early positioning by long-term participants.
Related: Solana Price Prediction: Can SOL Hold Steady After Circle Pours $3.25B Into The Network?
Consequently, this mix of low open interest and modest inflows suggests a market in transition. Traders appear to wait for a clearer breakout before committing to strong directional bets.
Technical Outlook for Chainlink (LINK) Price
Key levels remain well-defined as Chainlink (LINK) consolidates within a tightening range, suggesting a potential breakout ahead.
- Upside levels: $9.96, $10.81, and $11.66 act as immediate resistance zones. A breakout above this cluster could open the path toward $12.47 and $14.42.
- Downside levels: $8.40 remains the first critical support, followed by $7.20 as the deeper support zone. A breakdown below this level could accelerate downside momentum toward lower accumulation areas.
- Resistance ceiling: The $12.25 area, aligning with the 200-day EMA, stands as the key level to flip for a stronger medium-term bullish trend.
The technical structure shows LINK trading inside a compressed range after a sharp decline. This setup often leads to volatility expansion once price breaks decisively in either direction. Additionally, multiple EMAs above price continue to act as overhead barriers, reinforcing the current bearish bias.
Will Chainlink Break Out or Break Down?
Chainlink’s near-term outlook depends on whether buyers can defend the $8.40 support long enough to challenge the $9.96 resistance zone. Besides, a strong move above $10.80 would confirm growing bullish momentum and weaken seller control.
Consequently, if inflows increase and buyers regain confidence, LINK could attempt a move toward $11.66 and later test the $12.25–$12.47 resistance band. A successful breakout above this region would signal a shift in market structure.
However, failure to hold $8.40 risks breaking the current range and triggering further downside pressure. In that case, LINK could revisit the $7.20 level, where buyers previously stepped in.
Moreover, declining open interest suggests reduced speculative activity, which often precedes a major move. This environment supports the idea of an imminent breakout, though direction remains uncertain.
Related: Shiba Inu Price Prediction: SHIB Stuck At $0.0000058 As Burn Rate Collapses 89%
Disclaimer: The information presented in this article is for informational and educational purposes only. The article does not constitute financial advice or advice of any kind. Coin Edition is not responsible for any losses incurred as a result of the utilization of content, products, or services mentioned. Readers are advised to exercise caution before taking any action related to the company.
 Price Prediction: Can Bulls Sustain Above $2,100?")


