- Bullish momentum is currently strengthening as CFX price surges to a 7-day high.
- However, the downward trend potential looms as CMF nears the negative territory in the CFX price chart.
- The current bullish strength remains high, signaling possible price increases.
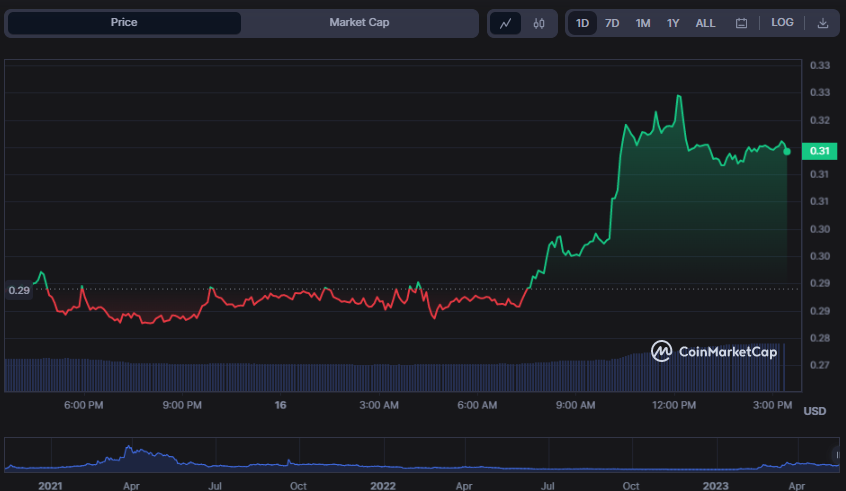
The bulls won a bull-bear war for dominance of the Conflux (CFX) market, pushing the price from an intra-day low of $0.2823 to a 7-day high of $0.3253 in hours. The price gain of 9.50% to $0.3158 demonstrates that the optimistic sentiment remained strong during press time.
CFX’s market capitalization and 24-hour trading volume increased by 9.26% and 48.91%, to $909,189,982 and $267,849,809, respectively. If bulls break above the 24-hour high of $0.3253, the next resistance level might be $0.3350. However, if bears take control, the support level to watch is $0.3050.

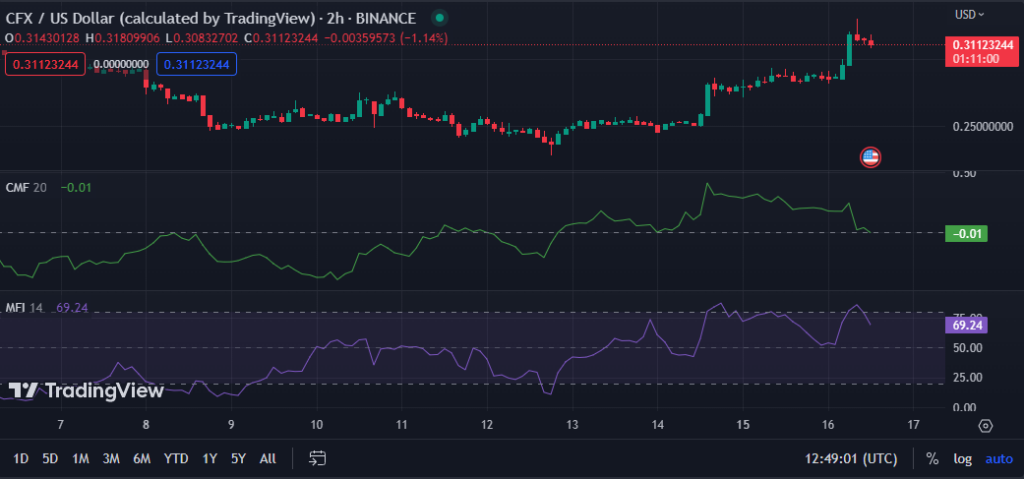
The Chaikin Money Flow (CMF) on the CFX 2-hour price chart is heading towards the “0” line as it enters the negative area with a value of -0.00. This CMF move indicates that there is now a dearth of purchasing pressure in the market and that sellers may be gaining control.
The Money Flow Index rating is 69.29, and sliding south indicates the possibility of a negative trend emerging in the market. This movement implies that traders are taking profits after the market reached a 7-day high in the previous few hours.
If the MFI goes below 50, it might signal a more significant negative trend, and traders must liquidate their holdings.

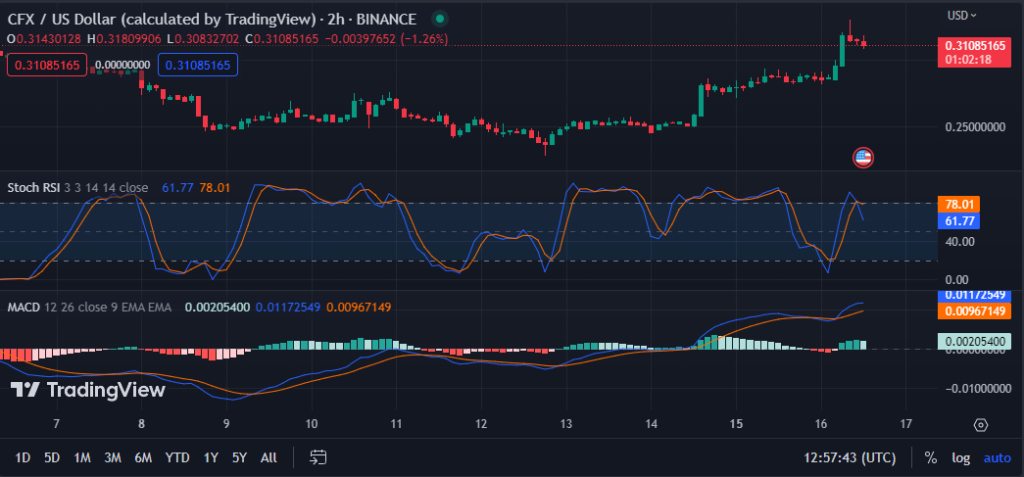
The stochastic RSI’s recent drop below its signal line with a value of 62.77 implies that bullish strength in the CFX market is diminishing. If the stochastic RSI falls below the oversold level of 30, it may suggest a probable trend reversal. However, since it has not yet been verified, traders should stay cautious and actively follow the market.
The MACD line movement in positive territory with a value of 0.01173137 and above its signal line indicates that the bullish strength in the market is still strong.
This shows buyers are more active than sellers, which might lead to more price increases. The MACD histogram likewise displays a bullish trend, with a rising slope suggesting that momentum is on the bulls’ side.

In conclusion, CFX shows signs of bullish strength with high market capitalization and trading volume, but caution is advised as negative trends may emerge.
Disclaimer: The views, opinions, and information shared in this price prediction are published in good faith. Readers must do their research and due diligence. Any action taken by the reader is strictly at their own risk. Coin Edition and its affiliates will not be liable for direct or indirect damage or loss.
Disclaimer: The information presented in this article is for informational and educational purposes only. The article does not constitute financial advice or advice of any kind. Coin Edition is not responsible for any losses incurred as a result of the utilization of content, products, or services mentioned. Readers are advised to exercise caution before taking any action related to the company.


