
- ETH trades near $3,500 after dipping below $3,400 earlier today; Binance market feed flags the breakdown
- Over $362 million in liquidations occurred within four hours amid surging volatility.
- SoftBank’s Nvidia stake sale and U.S. shutdown uncertainty deepened the risk-off sentiment.
The cryptocurrency market witnessed one of its heaviest liquidation waves this quarter, with over $362 million in leveraged positions wiped out within four hours on Wednesday. The move was triggered by a sharp selloff in Ethereum (ETH), which slipped below $3,400 for the first time in November.
Macro Narrative Keeps Risk Tight Even As Shutdown Ends
SoftBank’s decision to sell part of its stake in Nvidia, initially rattled global tech and adjacent crypto assets on Tuesday. The looming U.S. government shutdown vote on Wednesday added further uncertainty, prompting traders to unwind positions and pushing derivatives markets into cascading liquidations.
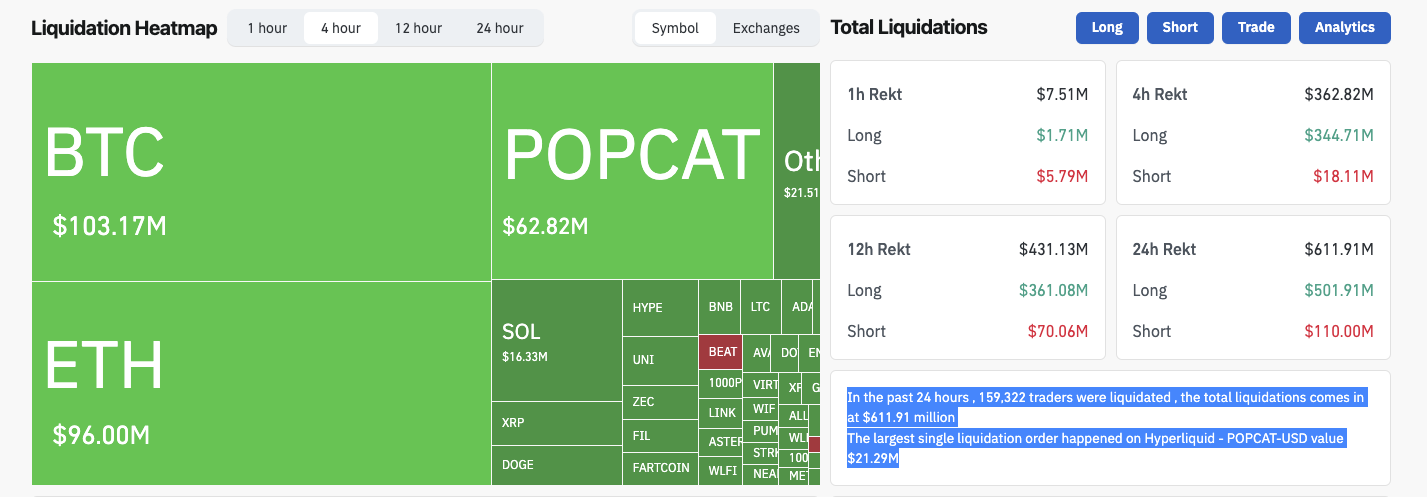
According to Coinglass data, more than 160,000 traders were liquidated in the past 24 hours, totaling $613.16 million in wiped positions. Of this, $503.23 million came from long traders, while shorts accounted for roughly $110 million. The largest single liquidation occurred on Hyperliquid’s POPCAT-USD pair, worth $21.29 million.
The one-hour liquidation chart showed $9.09 million in rekt positions, split between $3.24 million longs and $5.85 million shorts, highlighting extreme intraday volatility.
Bitcoin and Solana futures also saw sharp drawdowns, with open interest dropping nearly 8% across major exchanges as traded cut down risk exposure.
Ethereum Price Analysis: What Next for ETH After Falling Below the 20-Day Average?
Ethereum’s 12-hour chart shows ETH trading near $3,448, down 2.86%, following a rejection at $3,587. The breakdown dragged price below the 20-day simple moving average (SMA) around $3,463, a key short-term equilibrium line for traders.
The Bollinger Bands indicate widening volatility, with the upper band at $3,701 and the lower boundary near $3,225, defining the next compression zone. A close below $3,225 could invite further selling pressure toward $3,100, while a reclaim above $3,463 would signal an attempt to restore short-term bullish control.
The MACD remains in bearish territory with a -73.12 signal gap, suggesting declining momentum despite minor histogram recovery. Bulls must defend the $3,300–$3,350 support range to prevent a deeper drawdown toward the psychological $3,000 level.
Conversely, a sustained rebound above $3,550 could reestablish upward momentum, targeting resistance at $3,700. Until volatility stabilizes, Ethereum price outlook remains neutral-to-bearish amid heightened liquidation risk and macro uncertainty.
Disclaimer: The information presented in this article is for informational and educational purposes only. The article does not constitute financial advice or advice of any kind. Coin Edition is not responsible for any losses incurred as a result of the utilization of content, products, or services mentioned. Readers are advised to exercise caution before taking any action related to the company.


