 Price Prediction: Analyst Eyes $0.22 Test as Outflows Threaten Market")
Dogecoin price today is trading at $0.212 after a volatile week that saw repeated defenses of the $0.21 mark. While buyers have managed to prevent deeper breakdowns, momentum remains capped by overhead resistance zones around $0.22 to $0.23.
The token’s consolidation reflects mixed signals. Short-term structures suggest compression within a descending channel, but long-term charts highlight a possible breakout setup that resembles past cycles. This leaves traders debating whether the next move will be a rebound or further decline.
Dogecoin Price Action Holds Within Descending Channel
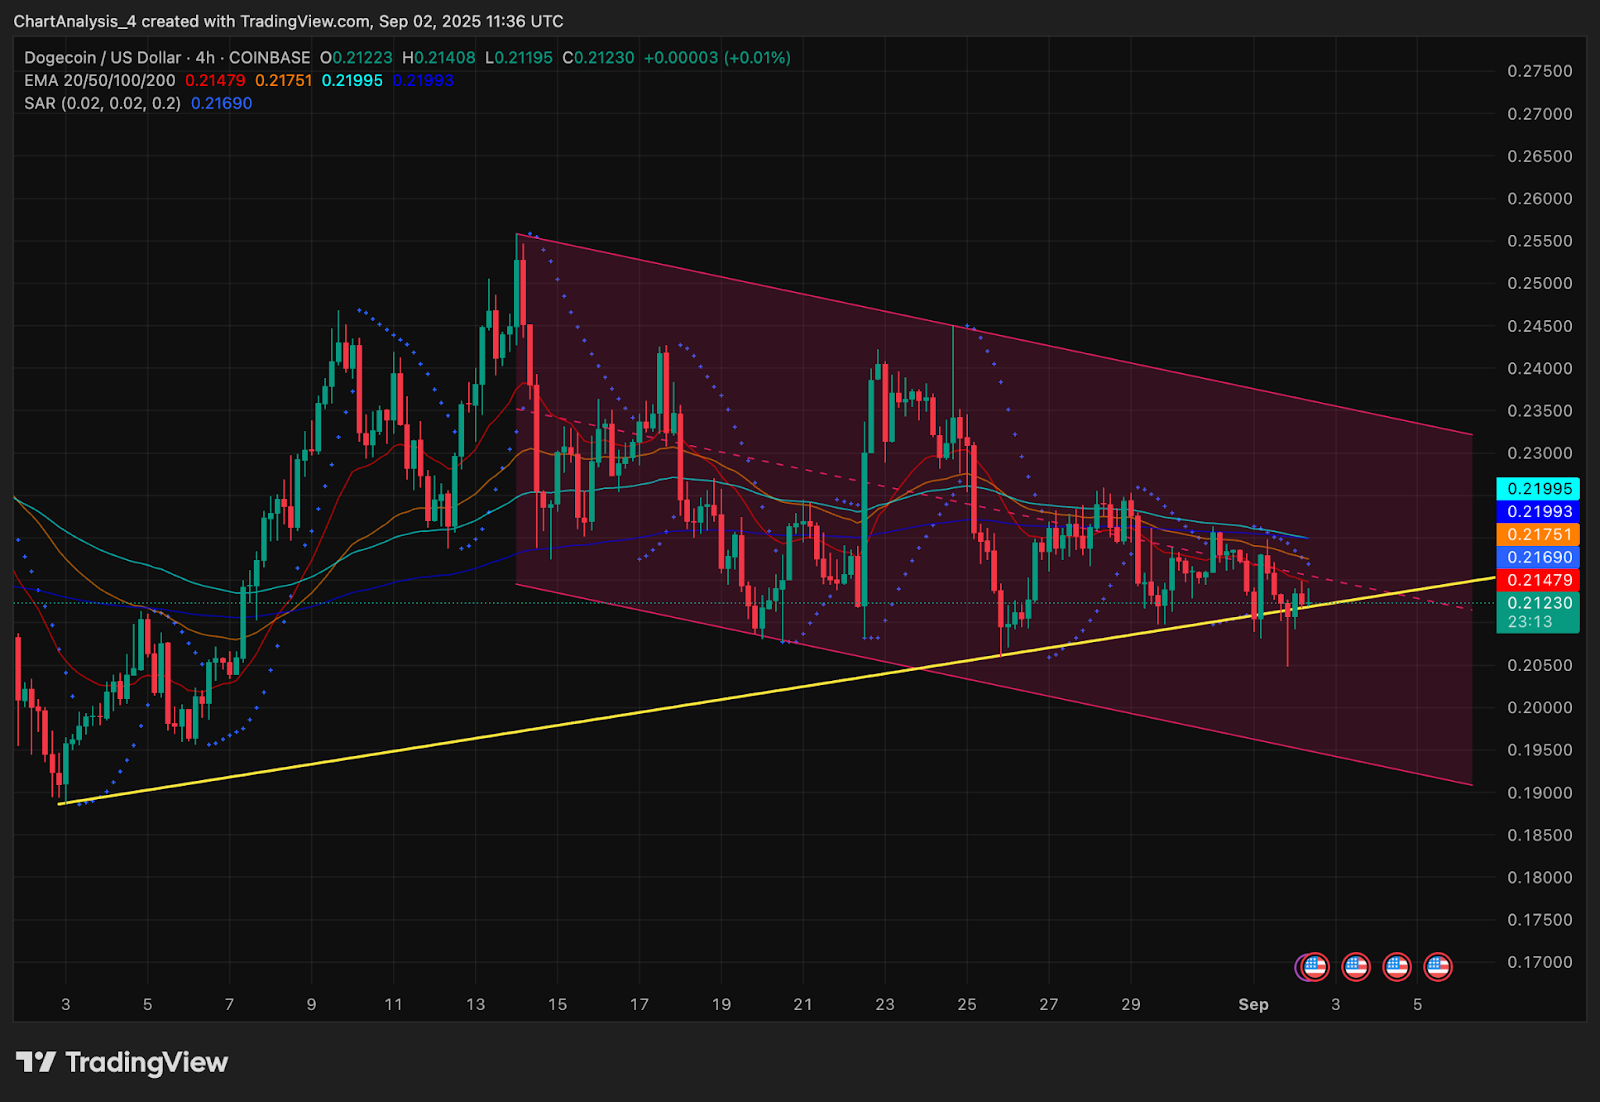
On the 4-hour chart, Dogecoin price action remains confined in a descending channel, with repeated rejections at the $0.22 zone. Exponential moving averages are stacked just overhead, with the 20-EMA near $0.214 and the 50-EMA at $0.217, reinforcing near-term resistance.
Related: Solana (SOL) Price Prediction: Breakout Or Pullback Next?
Support sits near $0.21, where price recently bounced from a trendline connecting June lows. A decisive break below this level risks opening the door to $0.20 and $0.197. Conversely, a close above $0.222 would signal strength and expose the $0.23–$0.24 region.
Momentum indicators remain neutral. Parabolic SAR dots have flipped bearish on recent candles, while the MACD is flat. RSI trends near midline, reflecting indecision as traders await confirmation of trend direction.
Whale Flows And Net Outflows Weigh On Sentiment
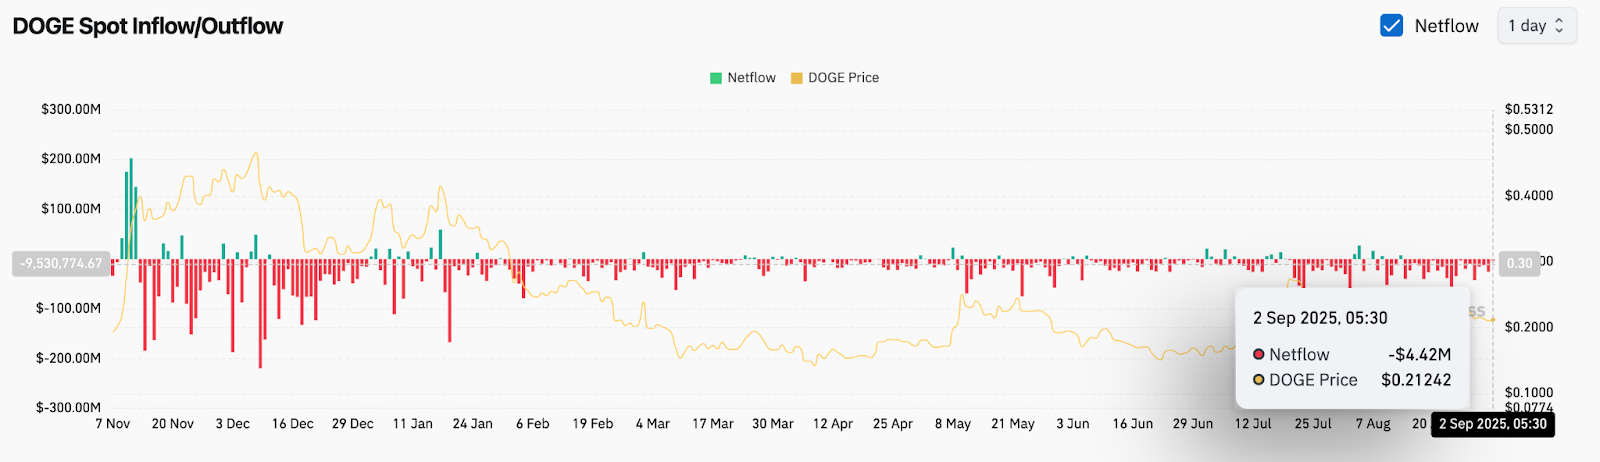
On-chain data underscores current weakness. Coinglass figures show Dogecoin recorded $4.42 million in net outflows on September 2, reflecting sustained selling pressure from large holders. Persistent negative flows through August and into early September have capped upside attempts, suggesting whales remain cautious.
This aligns with technical headwinds at the $0.22 resistance cluster. Without a reversal in netflows, bulls may find it difficult to sustain breakouts, leaving the asset vulnerable to deeper pullbacks if liquidity thins.
Related: Cardano (ADA) Price Prediction and Analysis for September 3
Long-Term Chart Hints At Accumulation Base
Despite near-term weakness, some analysts see structural similarities with past Dogecoin cycles. GalaxyBTC on X highlighted a weekly chart showing DOGE repeatedly forming ascending base structures before explosive rallies. The latest formation mirrors earlier setups from 2017 and 2020, where extended consolidation preceded large upside moves.
If history rhymes, Dogecoin could be approaching another breakout window. The long-term support trendline sits firmly intact, with price holding above key cycle lows. For bulls, defending the $0.20 zone remains critical in preserving this larger bullish pattern.
Contrasting Views: Bulls Eye $0.25, Bears Warn Of $0.20 Break
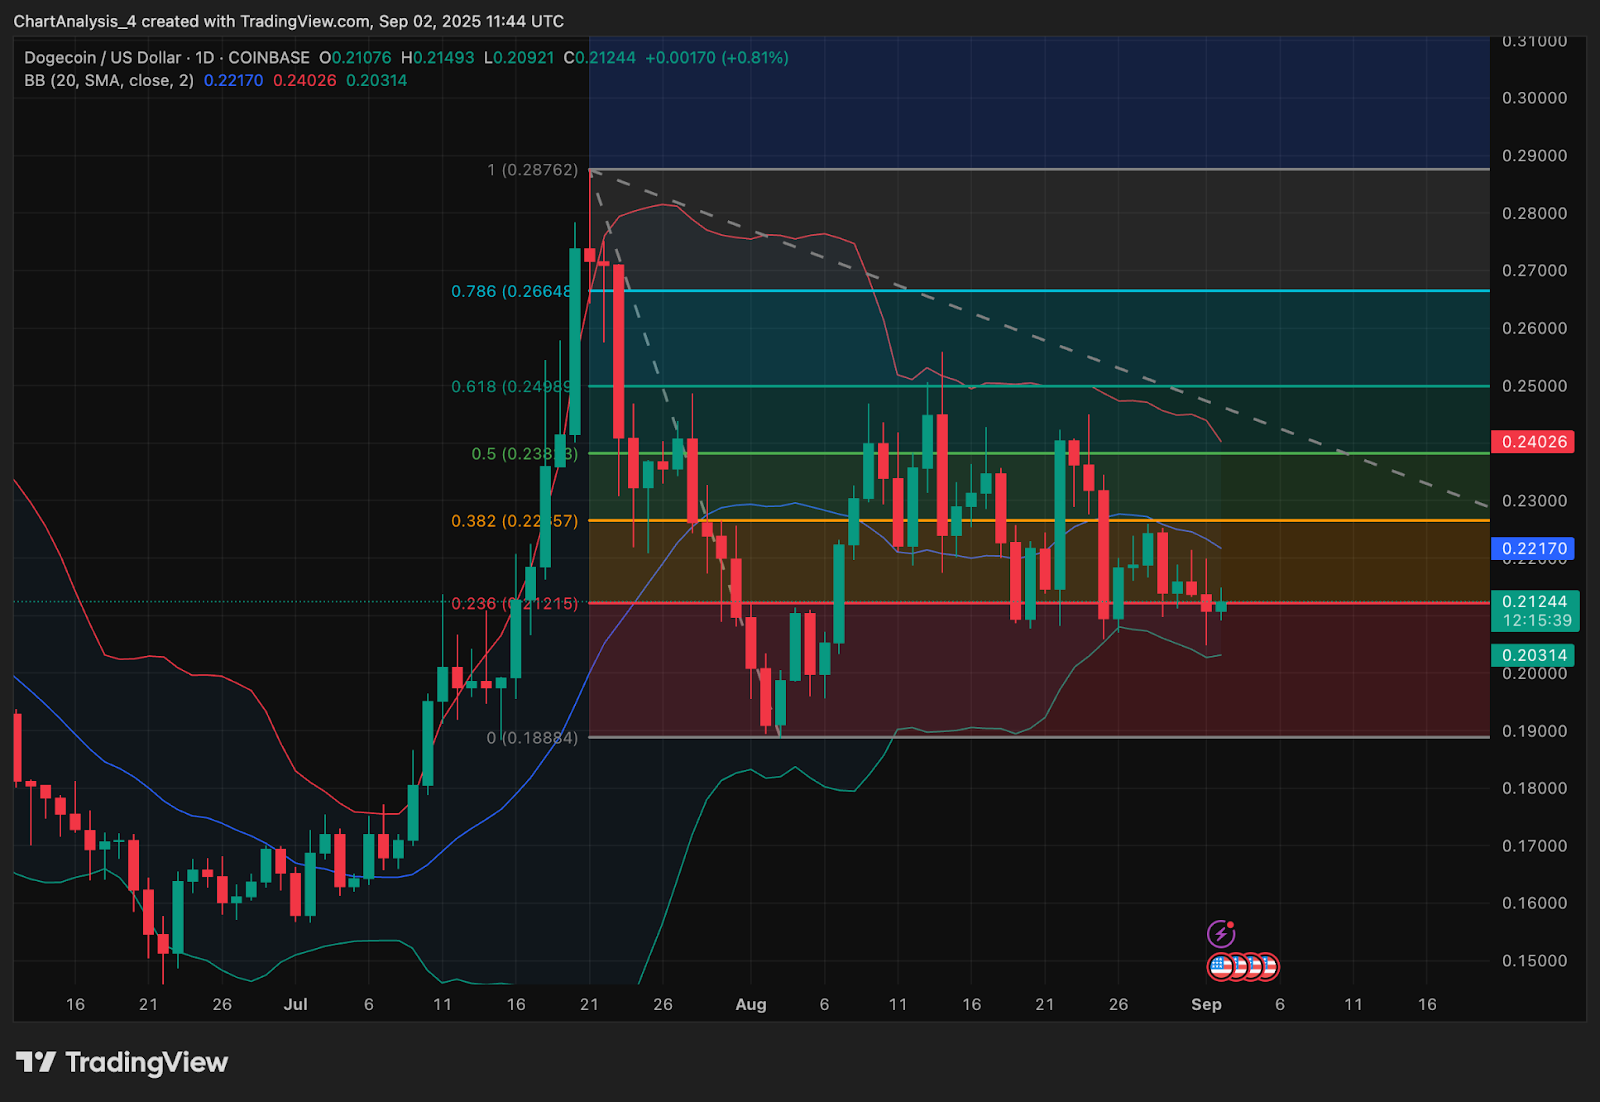
Bulls argue that DOGE’s repeated defenses of $0.21 show resilience. Clearing the Fibonacci 0.382 retracement near $0.225 could spark a move to $0.238 and $0.249, where the 0.5 and 0.618 levels align with mid-August highs. Beyond that, $0.266 remains a major resistance target.
Bears counter that persistent negative flows and channel rejection increase the probability of a downside extension. Failure to hold $0.21 risks exposing $0.20 and $0.188, where the July breakout began. A breakdown here would flip the broader structure bearish and undermine the bullish cycle narrative.
Related: XRP (XRP) Price Prediction: Breakout or Breakdown Ahead?
Dogecoin Short-Term Outlook: Breakout Or Breakdown Ahead?
Heading into September 3, the Dogecoin price prediction hinges on whether buyers can reclaim the $0.22 pivot. A daily close above this level would likely draw momentum buyers, targeting $0.23–$0.24. Conversely, failure to defend $0.21 could accelerate selling into $0.20 and possibly $0.197.
With long-term structures hinting at bullish potential but short-term flows still negative, traders are left balancing between accumulation signals and immediate downside risk. The next sessions will be pivotal in defining whether DOGE confirms a base or slides further.
DOGE Price Forecast Table
| Indicator | Signal | Levels/Notes |
| Price Today | $0.212 | Trading near channel support |
| Support | $0.210 / $0.200 | Key trendline and July base |
| Resistance | $0.222 / $0.238 | EMA cluster and Fib 0.5 level |
| RSI | Neutral | Midline, no extremes |
| MACD | Flat | No strong momentum shift |
| Pattern | Descending channel | Breakout needed for trend reversal |
| Flows | –$4.42M outflow | Selling pressure persists |
| Supertrend | Bearish | Trend bias remains under $0.22 |
Disclaimer: The information presented in this article is for informational and educational purposes only. The article does not constitute financial advice or advice of any kind. Coin Edition is not responsible for any losses incurred as a result of the utilization of content, products, or services mentioned. Readers are advised to exercise caution before taking any action related to the company.
 Price Prediction for April 2026: Will Chainlink Move Higher?")
 Price Prediction: Can Bulls Sustain the $0.045 Push?")


