 Price Prediction for July 11")
After breaking out of a multi-week compression channel, Dogecoin price rallied sharply toward the $0.185 zone. This area had previously acted as a key supply region throughout June, and the latest push has once again triggered selling pressure. As of writing, Dogecoin price today is hovering near $0.181 with signs of slowing momentum as bulls pause below a trend-defining resistance zone.
What’s Happening With Dogecoin’s Price?
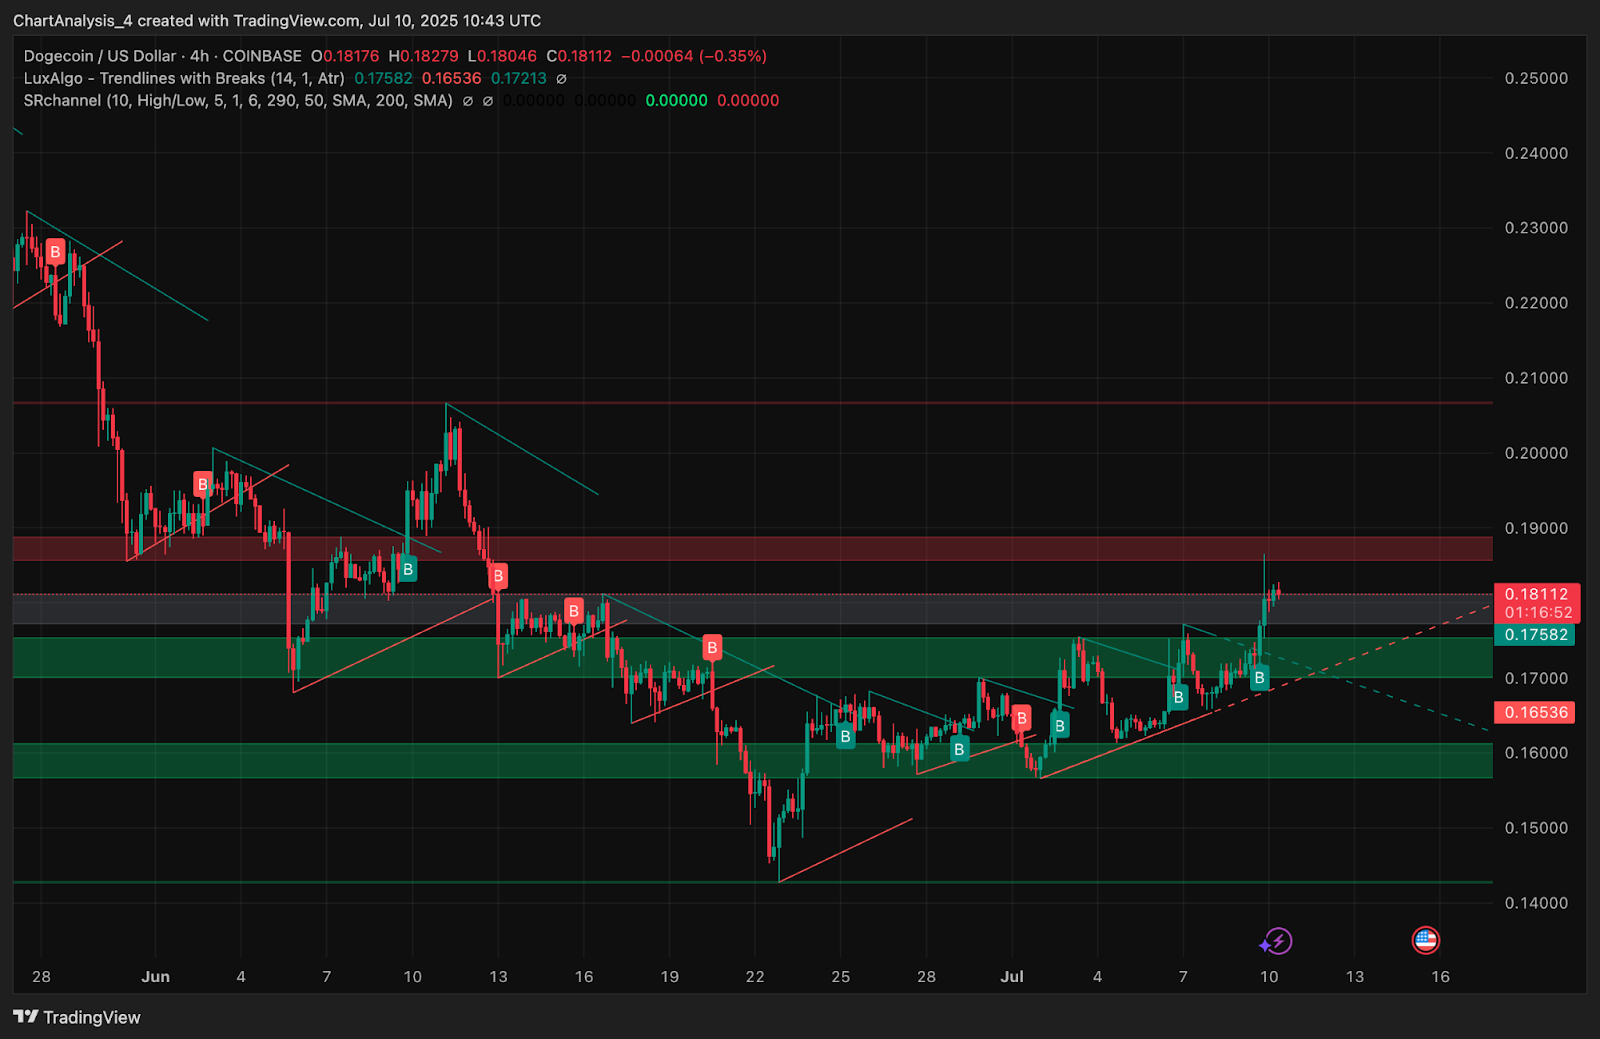
The broader structure on the 4-hour chart shows DOGE breaking out from a descending wedge pattern that extended from mid-June to early July. Price climbed through the $0.172 resistance and surged into the $0.182–$0.185 supply band before stalling. This region aligns with the R4 pivot level and previously marked a rejection area in late June.
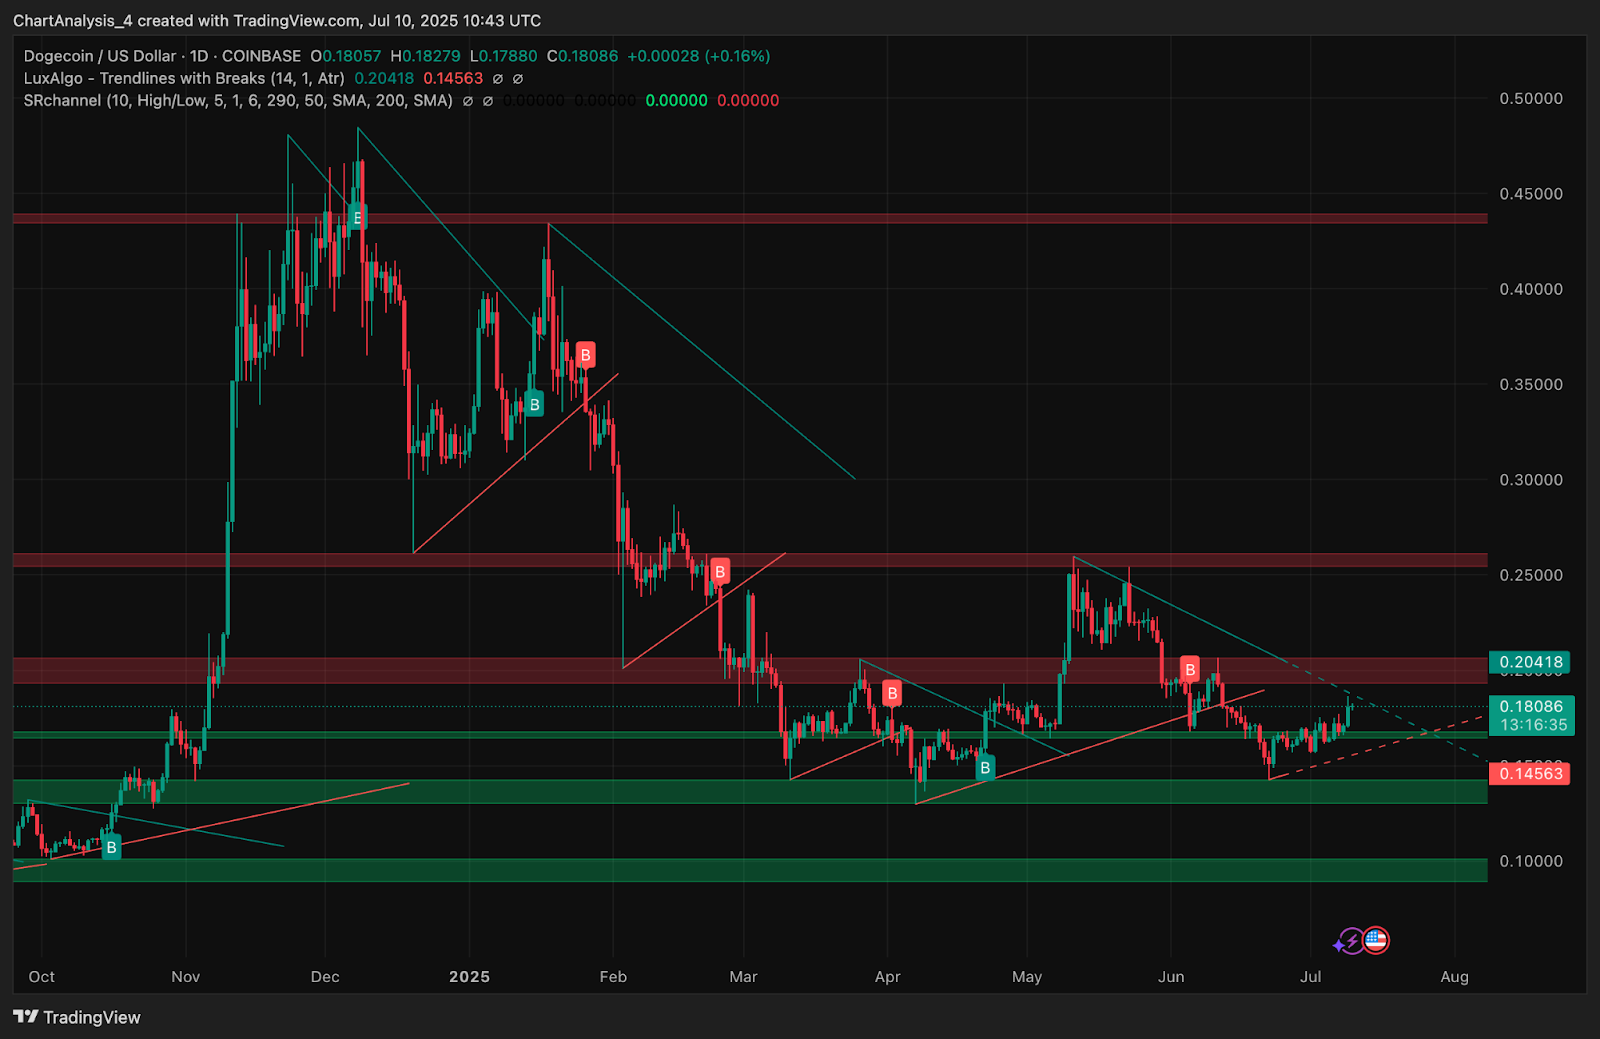
Support has now been established at $0.1758, where demand has responded strongly in recent sessions. Trendline support also extends from the July 5 swing low, reinforcing the bullish trend. On the daily chart, DOGE is challenging a macro downtrend line stretching back to April, a breakout from which could define the next leg toward $0.20 and beyond.
Why Dogecoin Price Going Up Today?
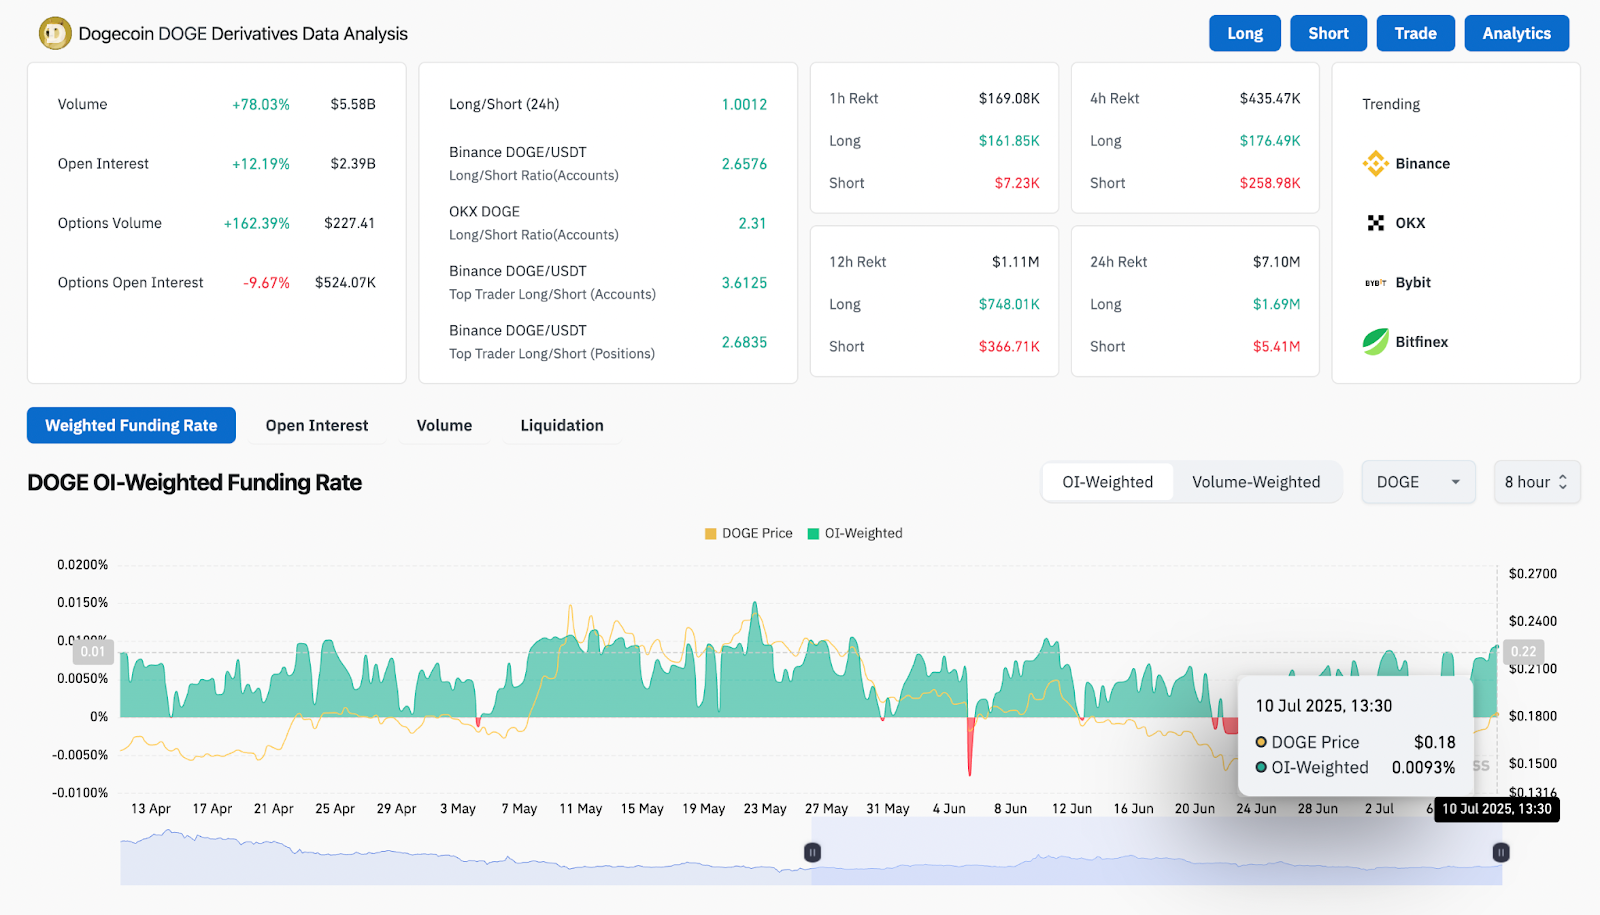
The question of why Dogecoin price going up today is answered by rising derivatives demand and structural reversal signals. According to Coinglass data, DOGE open interest has surged by 12.19% in the past 24 hours, while volume jumped over 78% to $5.5B. Options activity also spiked 162%, suggesting speculators are repositioning for upside continuation.
Funding rates remain positive, while long/short ratios show a bullish skew, especially on Binance and OKX, where top trader ratios hover above 2.5. These metrics signal aggressive long positioning behind the breakout.
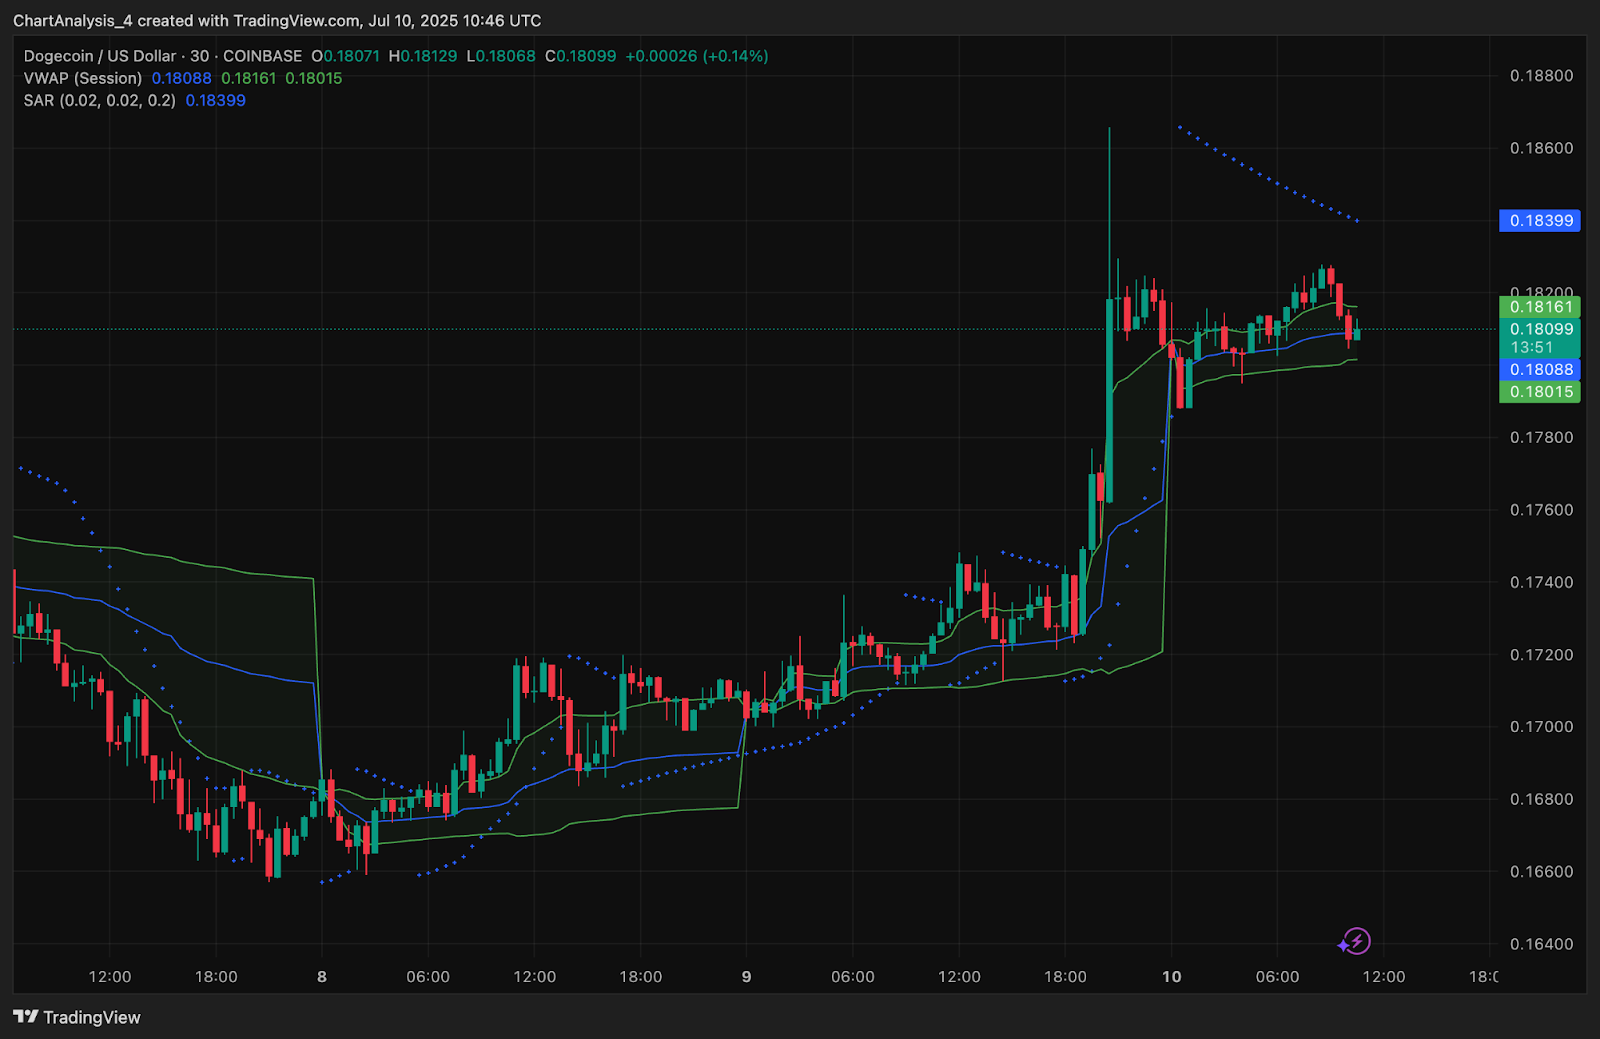
Technically, the Parabolic SAR flipped bullish on the 30-minute chart just before the rally began, while VWAP and Supertrend both turned supportive. Price remains above session VWAP and continues to hold near the upper Bollinger Band — a sign of persistent demand.
Price Indicators Suggest Breakout Exhaustion Near Resistance
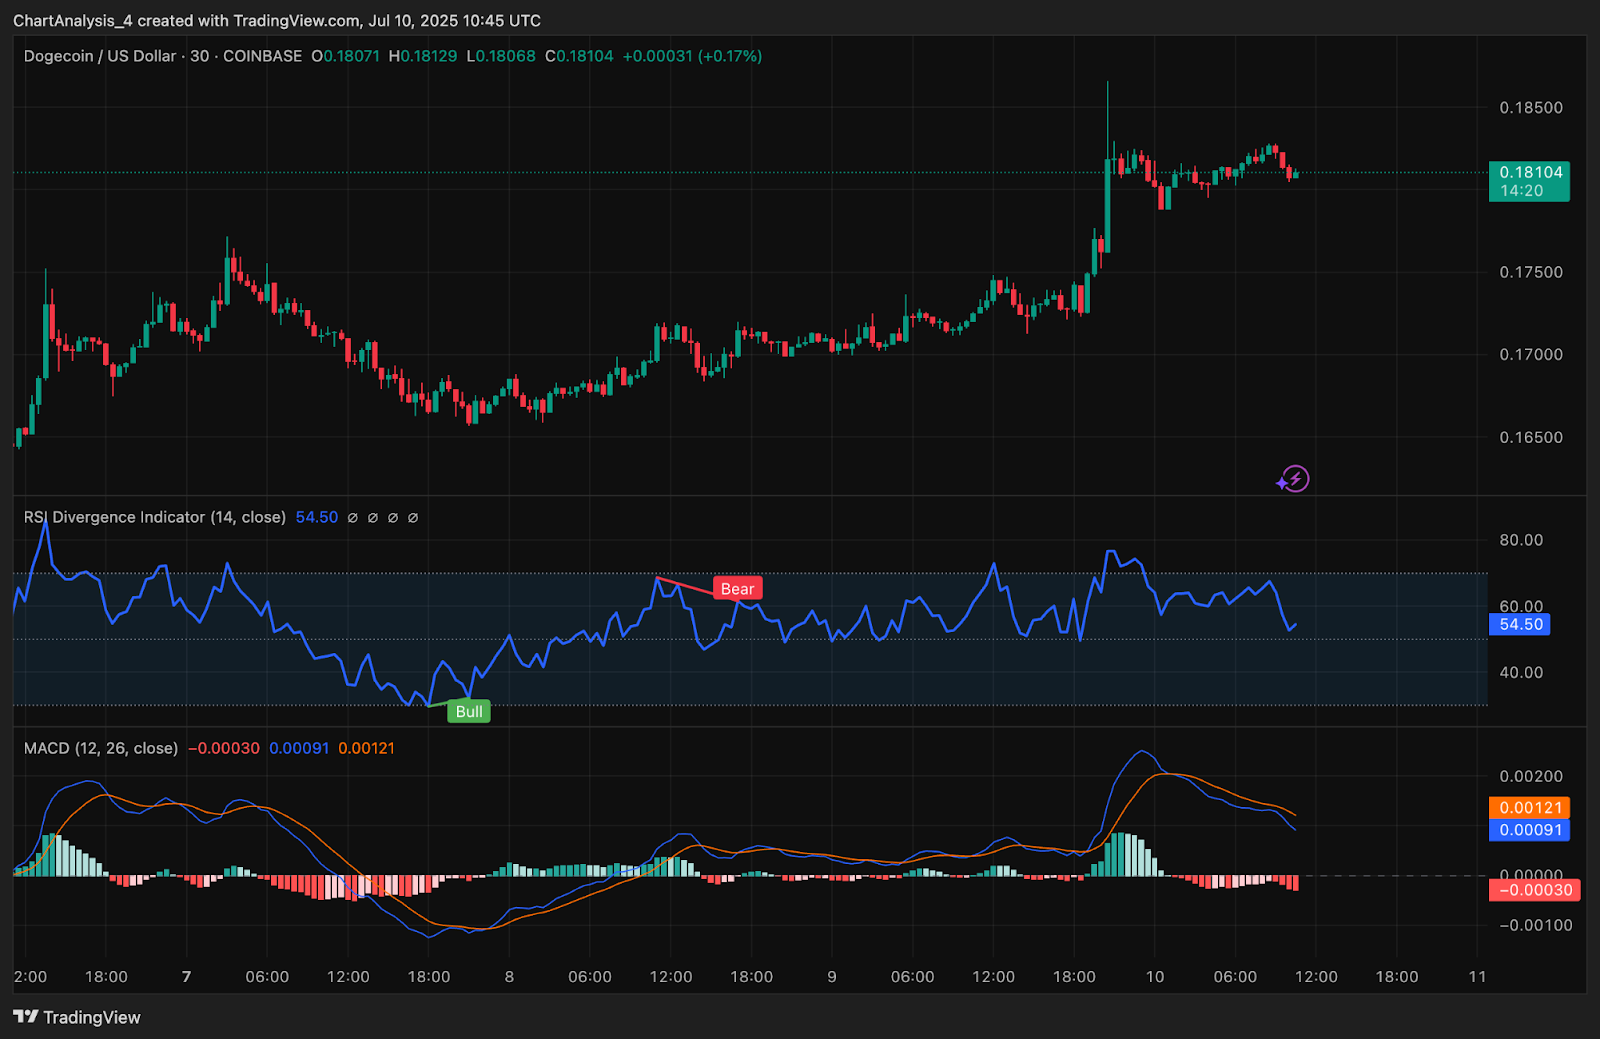
Momentum indicators suggest the rally is cooling off but not reversing yet. On the 30-minute chart, RSI has pulled back to 54.5 after hitting overbought territory near 74, and MACD is flattening with a weak bearish crossover.
The 4-hour Bollinger Bands show DOGE still hugging the upper band around $0.182, though the band expansion has begun to slow. This typically precedes either a consolidation phase or minor pullback.
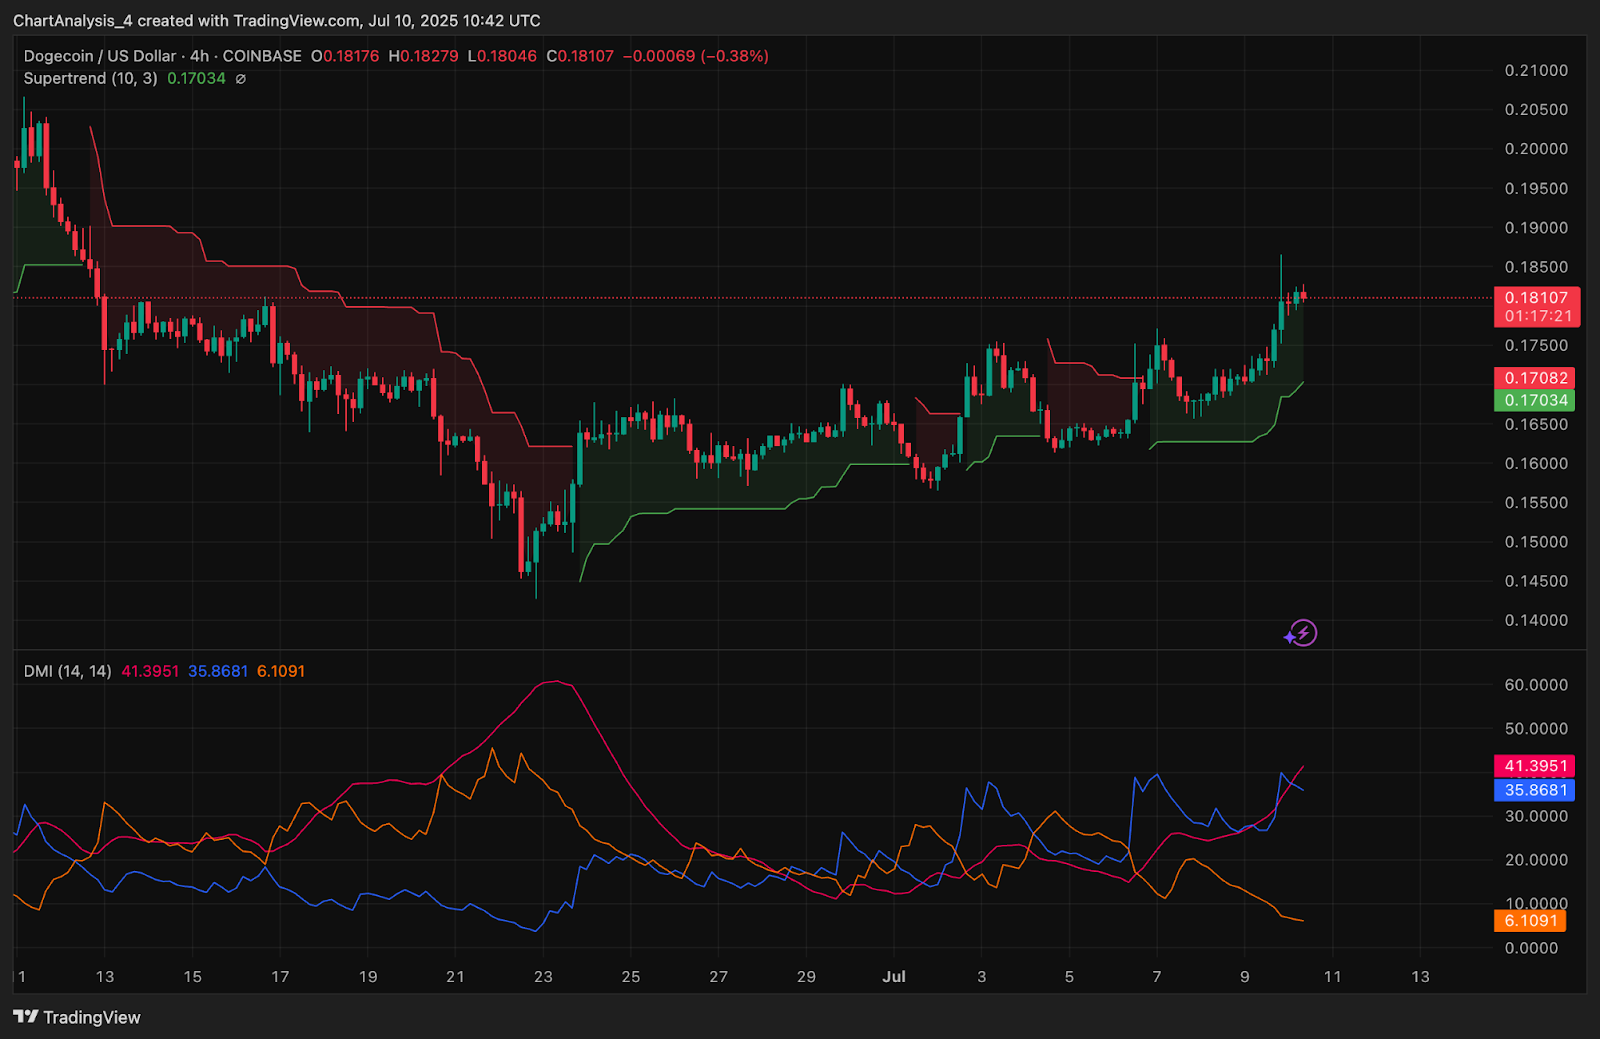
Directional Movement Index (DMI) shows the +DI at 35.86, trailing the -DI at 41.39. However, ADX is still relatively low at 6.1, implying a developing rather than confirmed trend.
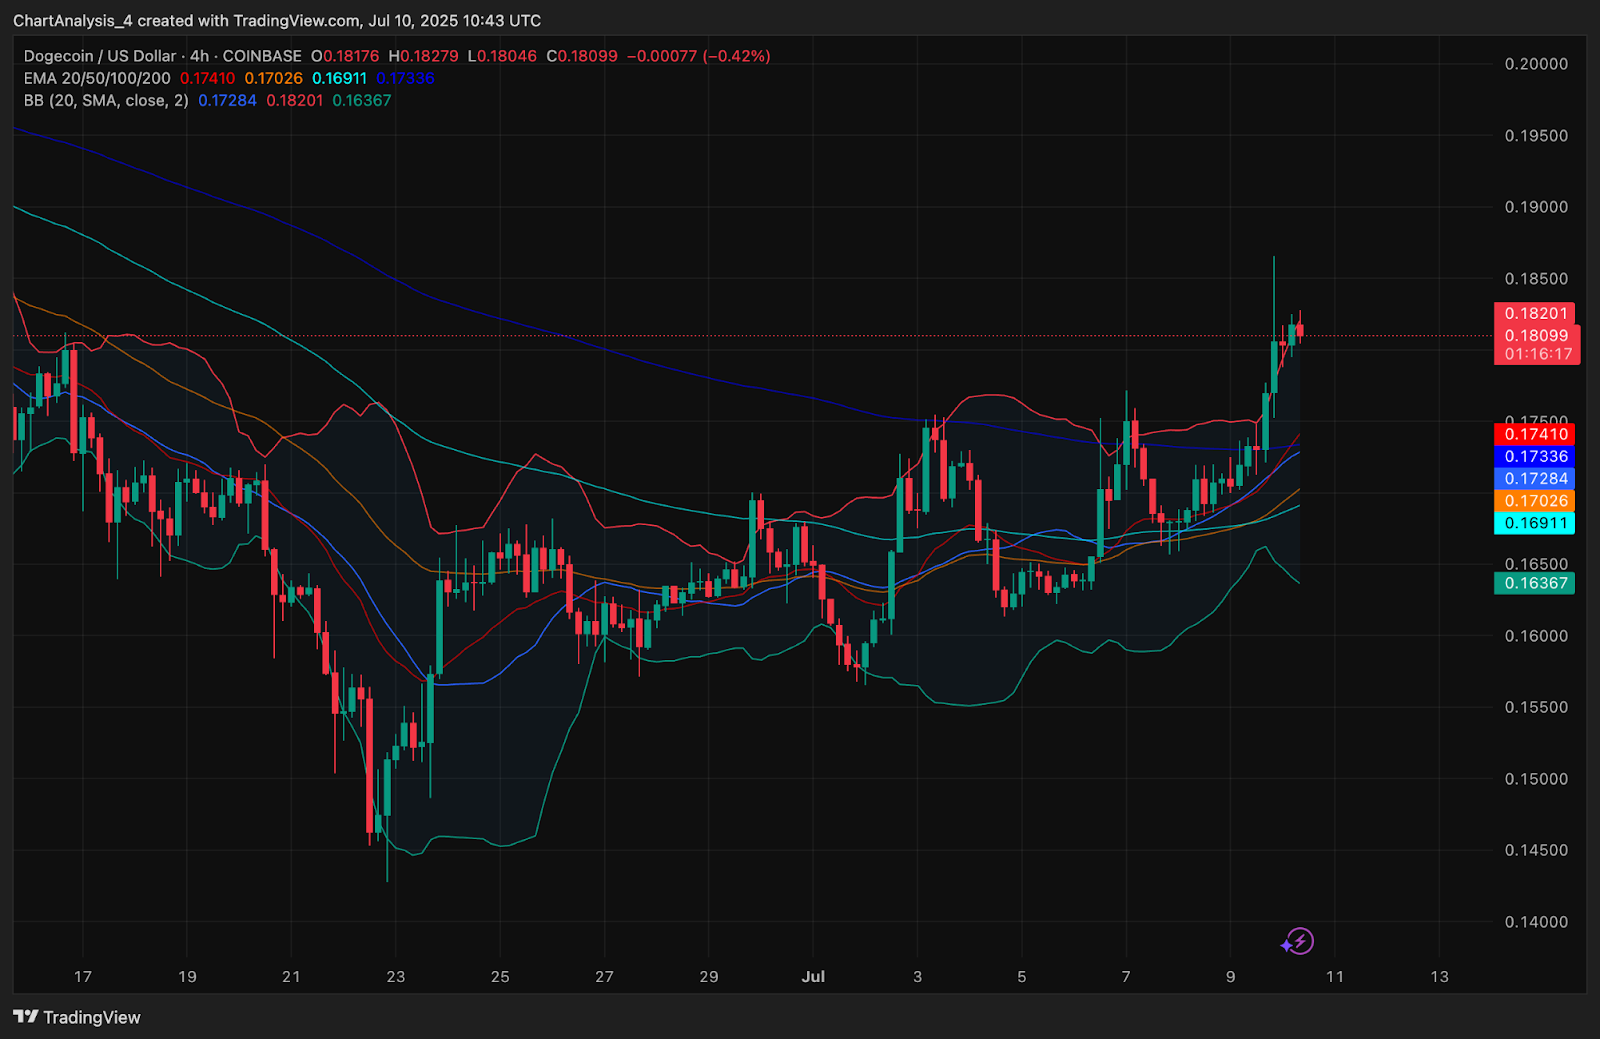
From a trend perspective, the EMA cluster (20/50/100/200) is now fully aligned below price on the 4-hour chart. The 200 EMA at $0.169 acts as deeper trend support, while the 20 EMA near $0.174 is closer to price and likely to be tested first on any retracement.
DOGE Price Prediction: Short-Term Outlook (24H)
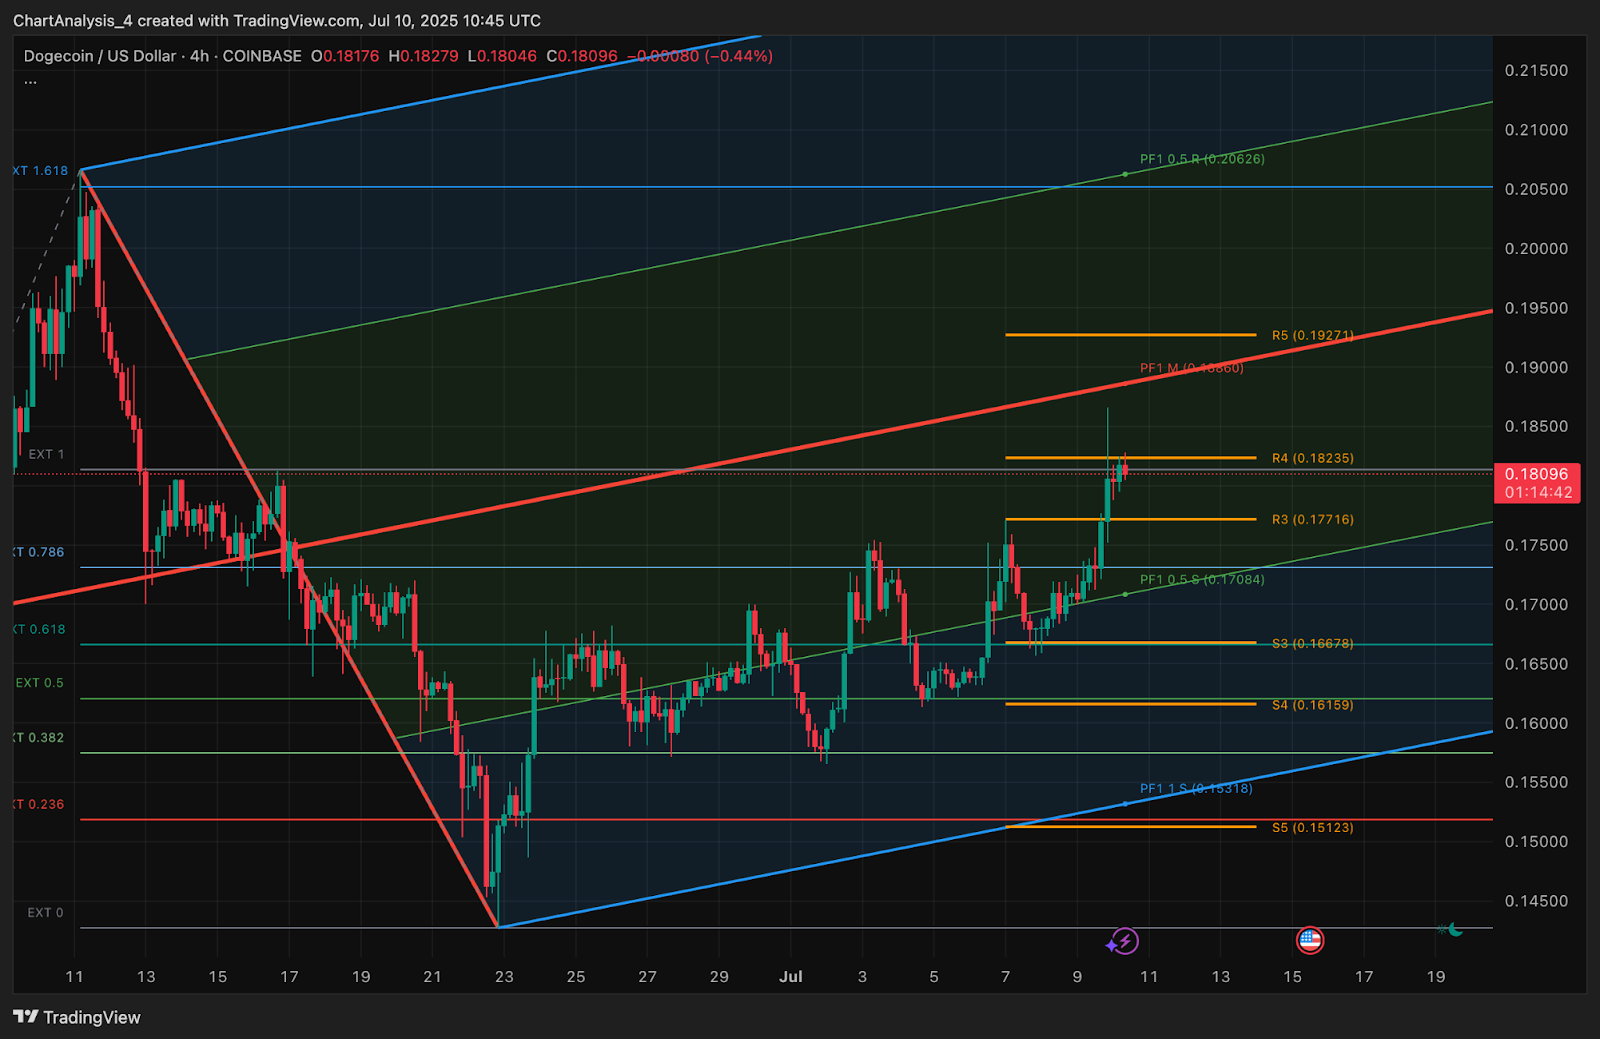
The near-term structure favors a continued bullish bias, but only if DOGE manages to reclaim and hold above $0.185. This zone coincides with the red supply band and R4 pivot level. A clean breakout could send price toward the next resistance at $0.1927, followed by a broader move to $0.2041 if volume expands.
On the downside, immediate support lies at $0.1758, and a break below this could open a drop toward $0.1708 (R3 level) and possibly back to the ascending trendline near $0.1653. If broader market conditions deteriorate or if long positions unwind, the breakdown could extend toward the $0.151 zone, which is the next confluence of Fib extension and support cluster.
For now, Dogecoin price action remains bullish but capped, and traders should watch for volume confirmation above $0.185 or failure near this level to determine the next impulse.
Dogecoin Price Forecast Table: July 11, 2025
| Indicator/Zone | Level / Signal |
| Dogecoin price today | $0.181 |
| Resistance 1 | $0.185 (Supply + R4 Pivot) |
| Resistance 2 | $0.1927 (R5 Pivot) |
| Support 1 | $0.1758 (Previous breakout level) |
| Support 2 | $0.1708 / $0.1653 (Trendline zone) |
| EMA Cluster (20/50/100/200) | Bullishly aligned below price |
| Bollinger Bands (4H) | Expanded, slight upper band stall |
| RSI (30-min) | 54.5 (Cooling from overbought) |
| MACD (30-min) | Flat with minor bearish signal |
| Supertrend (4H) | Bullish above $0.1703 |
| VWAP (30-min) | Price above, confirming support |
| Derivatives Volume | +78.03%, long-heavy bias |
Disclaimer: The information presented in this article is for informational and educational purposes only. The article does not constitute financial advice or advice of any kind. Coin Edition is not responsible for any losses incurred as a result of the utilization of content, products, or services mentioned. Readers are advised to exercise caution before taking any action related to the company.


 Price Prediction: Canton Eyes Key Break After Market Activity Spike")

