 Price Prediction for July 25")
After rising above $0.29 earlier this month, Dogecoin price today has reversed sharply, dropping below $0.24 as sellers reclaimed short-term control. The move follows a clear market structure shift on the daily chart, with DOGE now returning inside its previous trend channel. The recent decline also coincides with significant changes in derivative metrics and intraday momentum.
What’s Happening With Dogecoin’s Price?
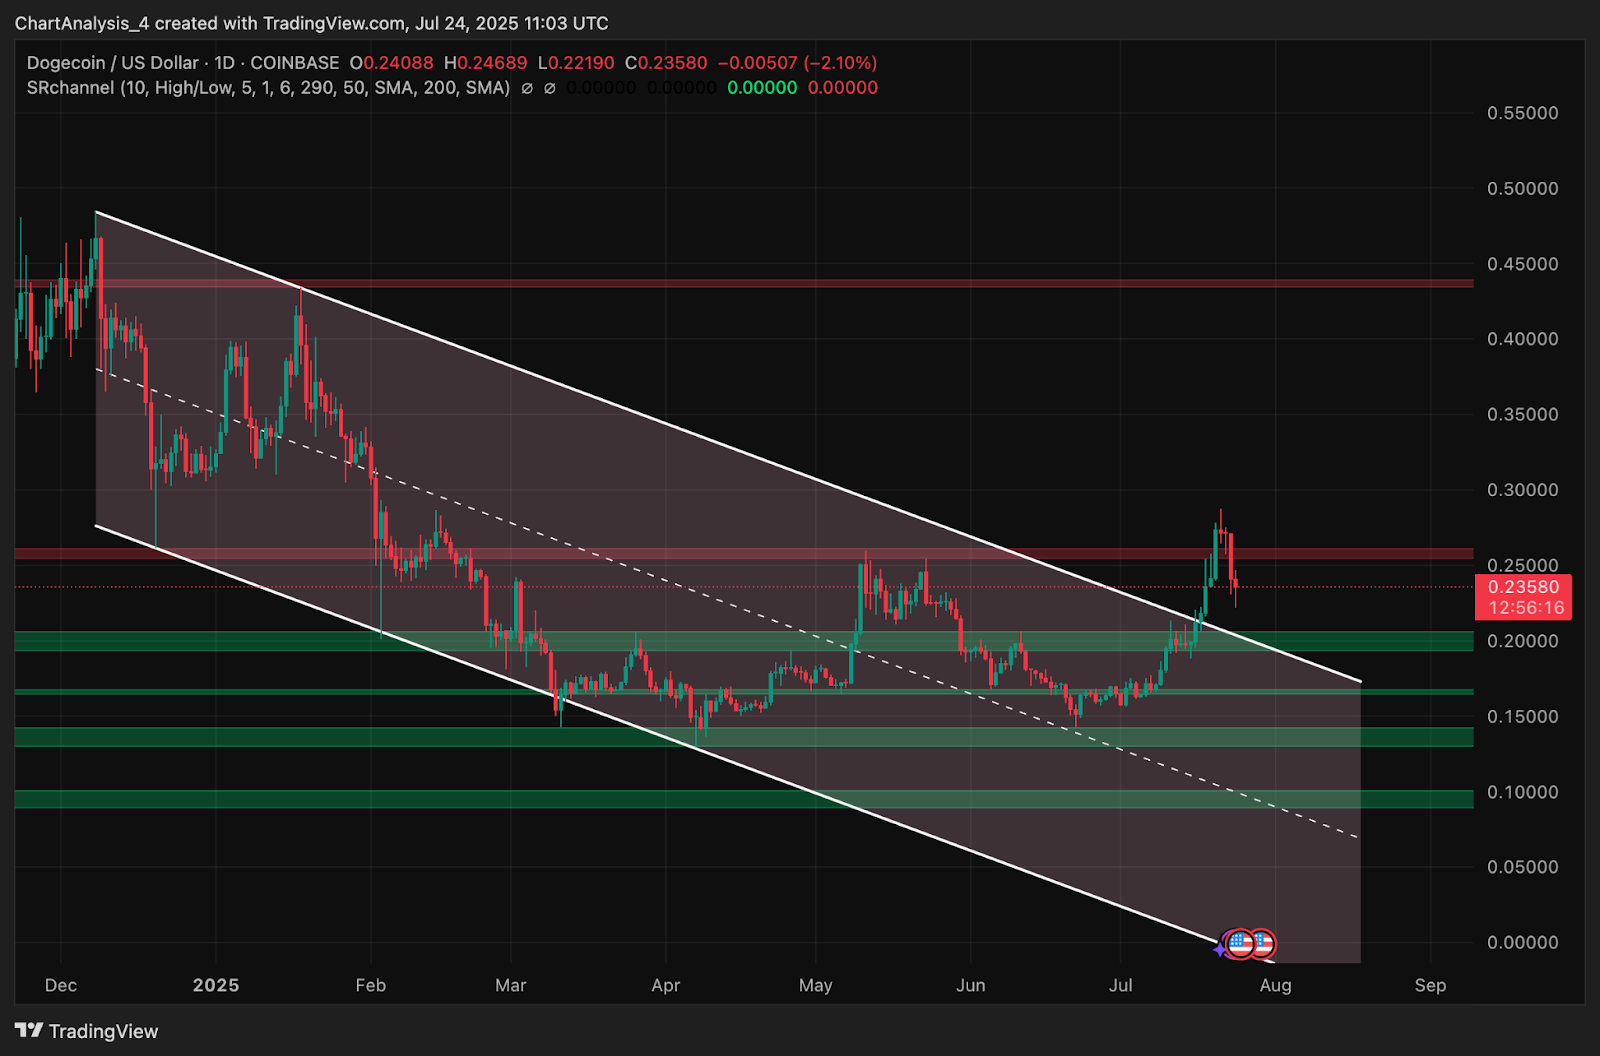
On the daily chart, Dogecoin has fallen back into the long-standing descending channel that it had briefly broken out of. The rejection from the red supply zone near $0.29 has created a strong bearish engulfing pattern. Price is currently hovering near $0.235, sitting just above the channel midline and below the previously broken structure.
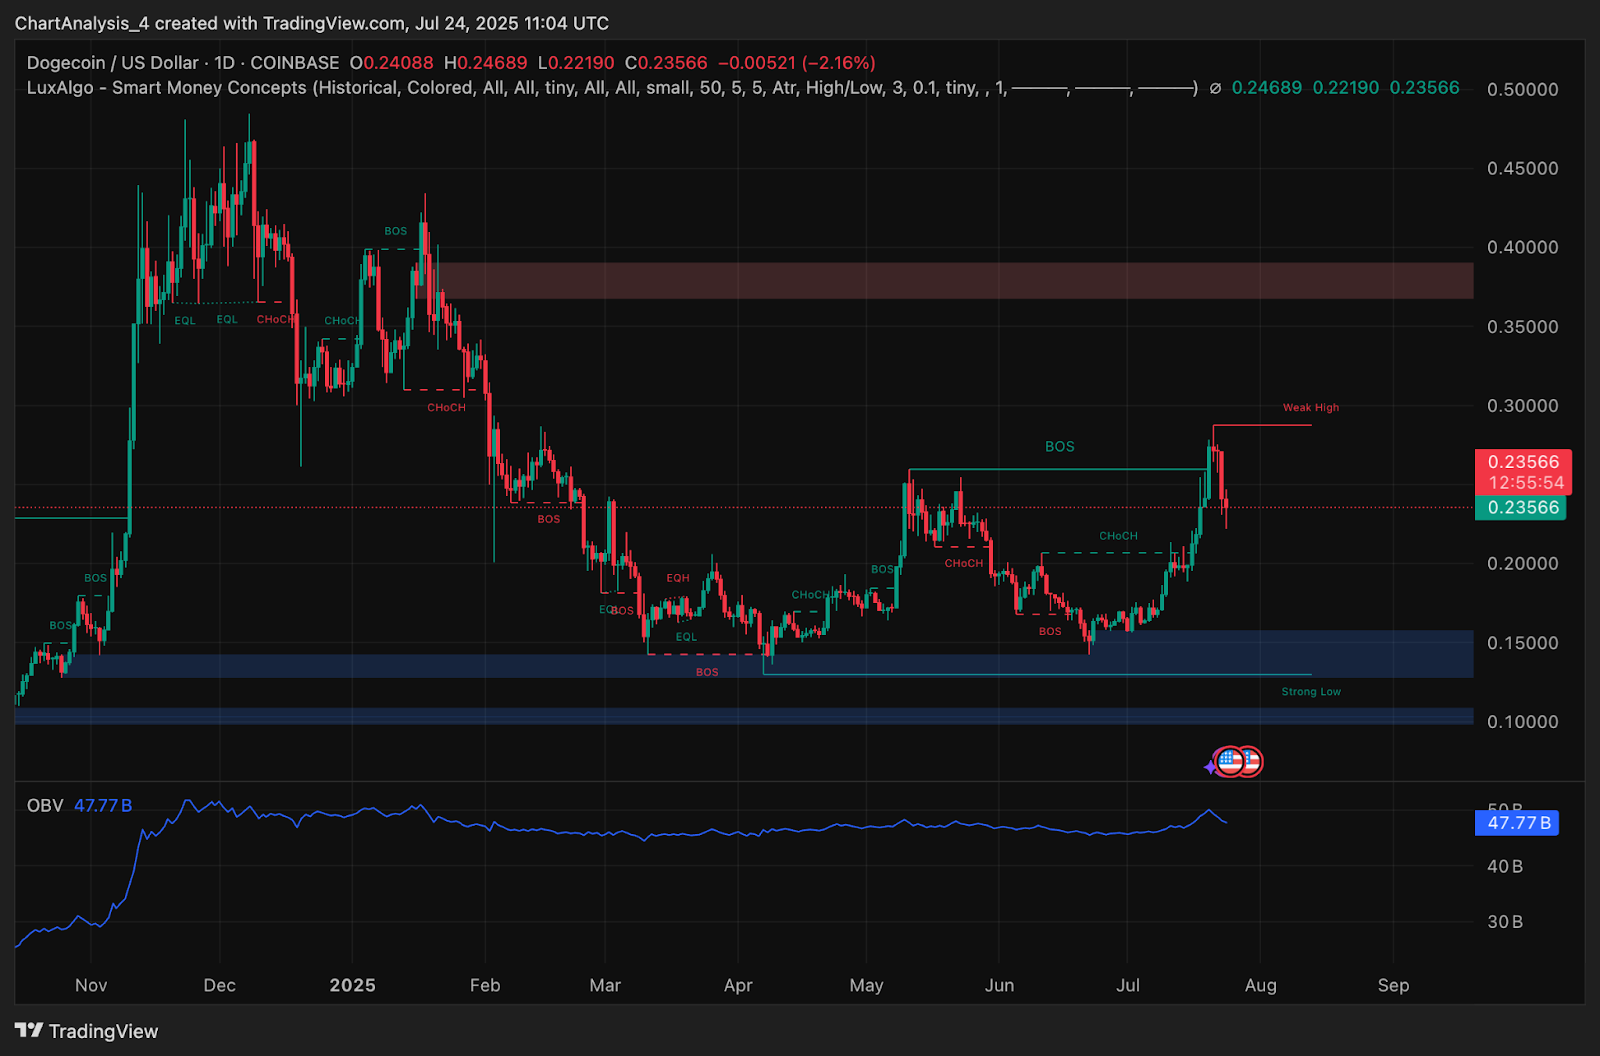
The Smart Money Concepts chart confirms a bearish Change of Character (CHoCH) after DOGE failed to sustain its breakout above $0.26. The latest candle reflects a return into the earlier liquidity pocket, with the weak high around $0.29 now acting as a firm rejection level.
From the OBV perspective, flow has flattened around 47.77B, which shows no active accumulation and reinforces the ongoing stall in momentum.
Why Is The Dogecoin Price Going Down Today?
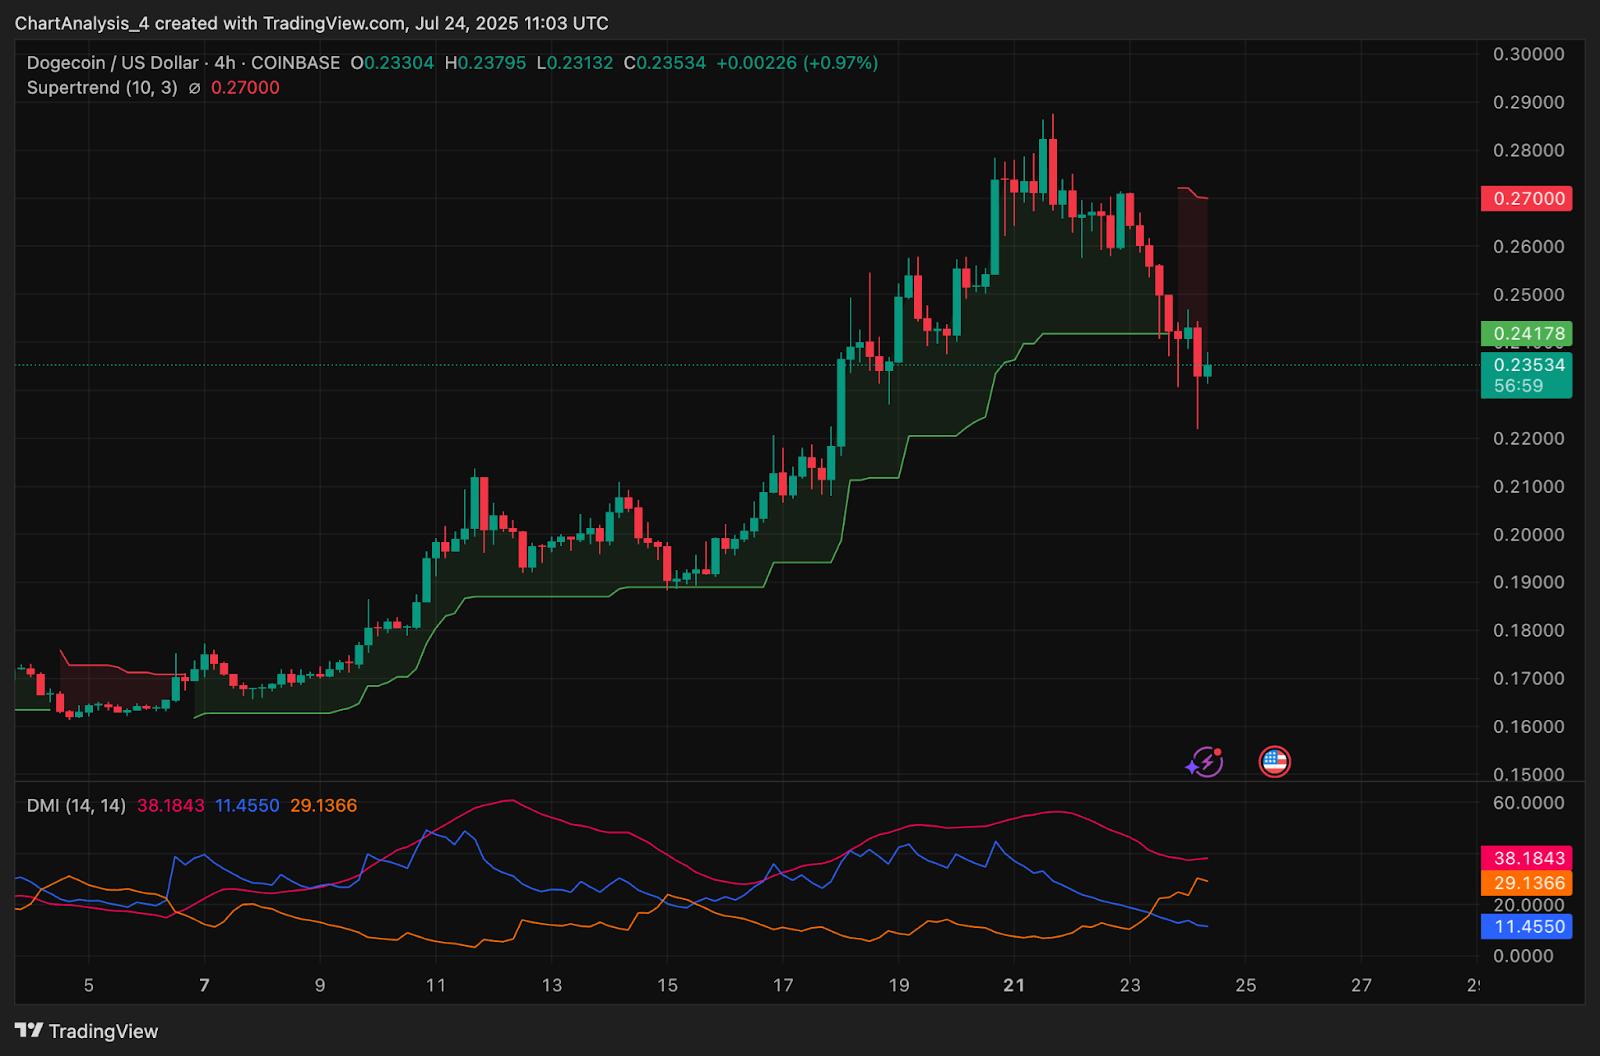
Why Dogecoin price going down today is linked to both technical pressure and derivatives behavior. First, the Supertrend on the 4-hour chart has flipped bearish, with the trend resistance now at $0.27. This shift confirms broader trend weakness, especially as the current candle struggles to reclaim $0.2417.
Next, the Directional Movement Index (DMI) shows a clear dominance of sellers. The -DI is leading at 38.18 while +DI lags at 11.45. The ADX reads 29.13, confirming that this trend has strength behind it.
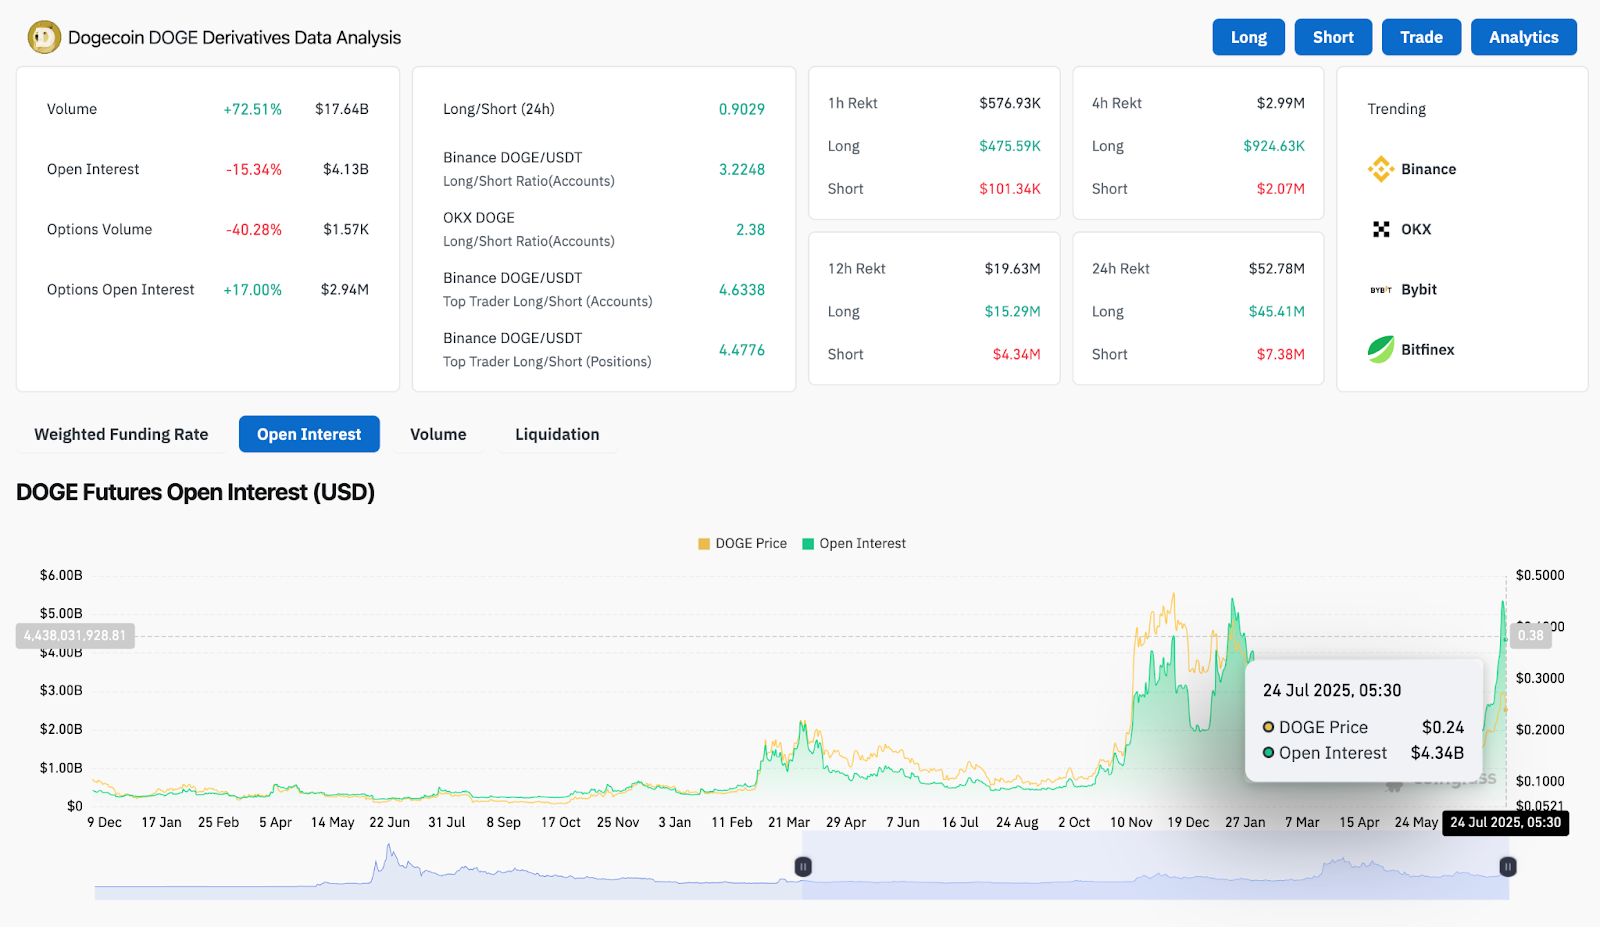
In the derivatives market, despite a 72.5% surge in volume to $17.64B, open interest dropped by 15.3% and options volume fell by 40.2%, which are classic signs of long liquidations. However, the 17% rise in options open interest suggests that directional bets or hedging activity is increasing again.
Binance’s long/short ratio for DOGE/USDT accounts remains at 3.22, while top trader positioning is even more skewed at 4.47. This creates a scenario where crowded long trades could lead to further downside risk if selling continues.
RSI Bounce Meets Resistance as MACD Stays Weak
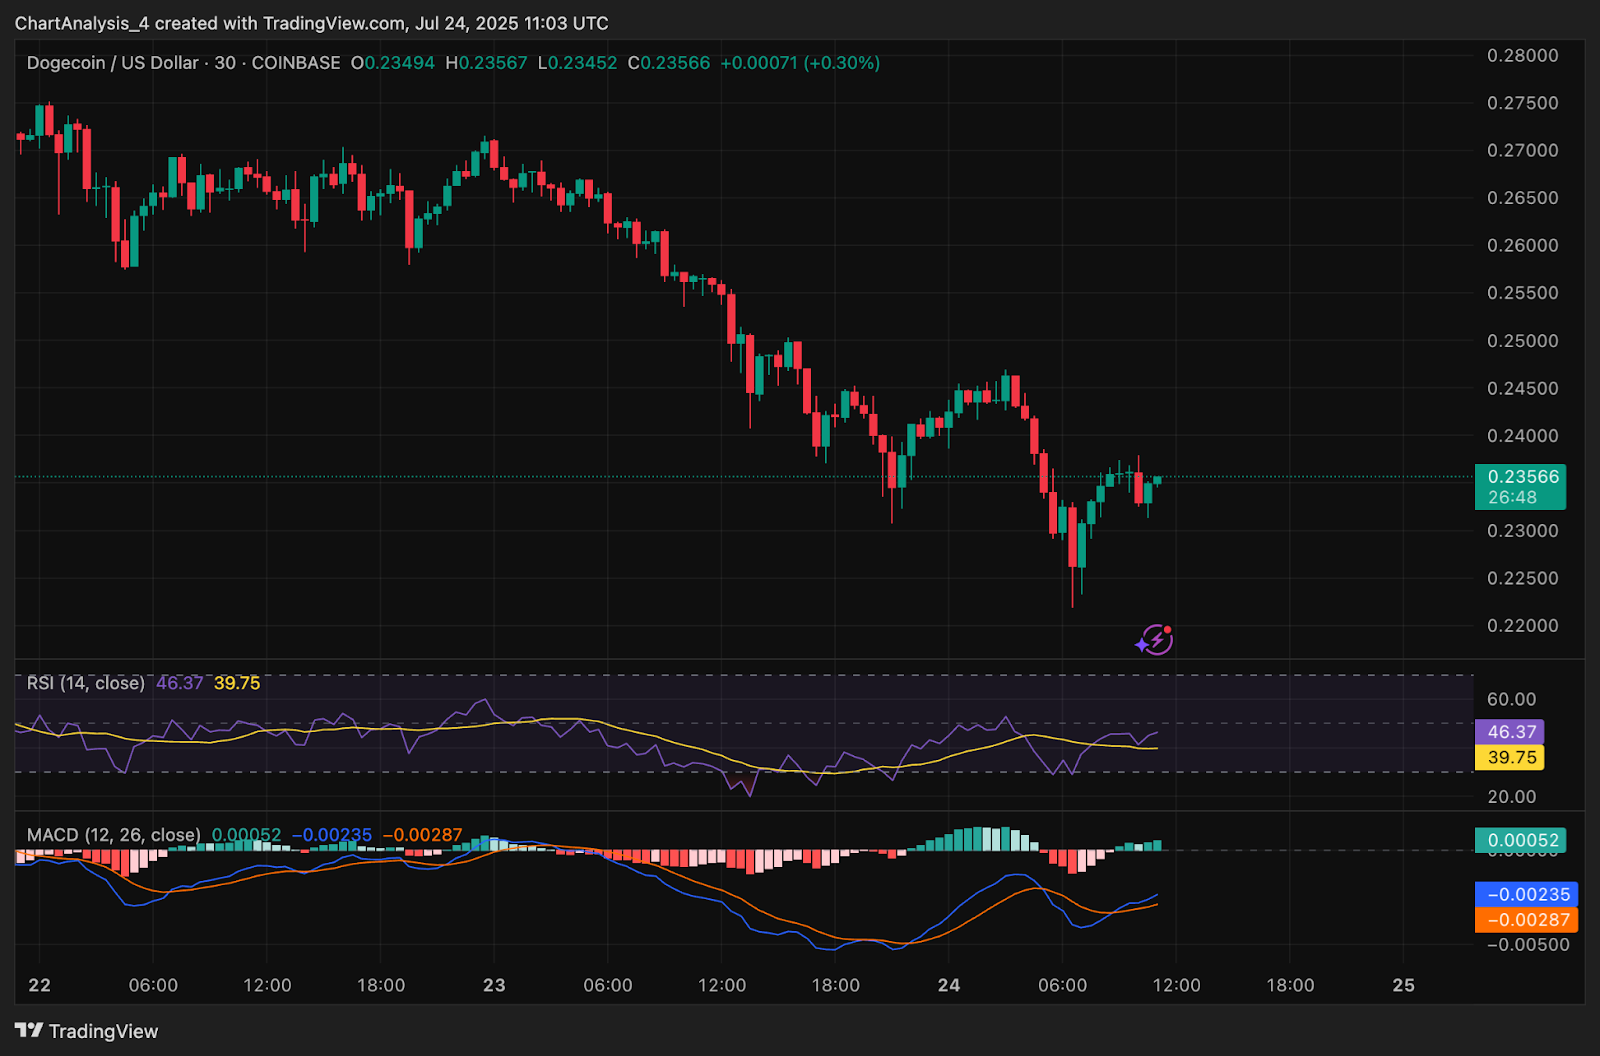
On the 30-minute chart, RSI has recovered from oversold 39.7 to 46.3, hinting at a possible short-term bounce. However, the move remains confined within a lower-high structure. The MACD line is still below zero at -0.00287, and histogram bars show no strong momentum either way.
Unless RSI pushes above 50 and MACD crosses bullish, this bounce could remain corrective rather than a reversal.
Bollinger Bands and EMAs Signal Breakdown Expansion
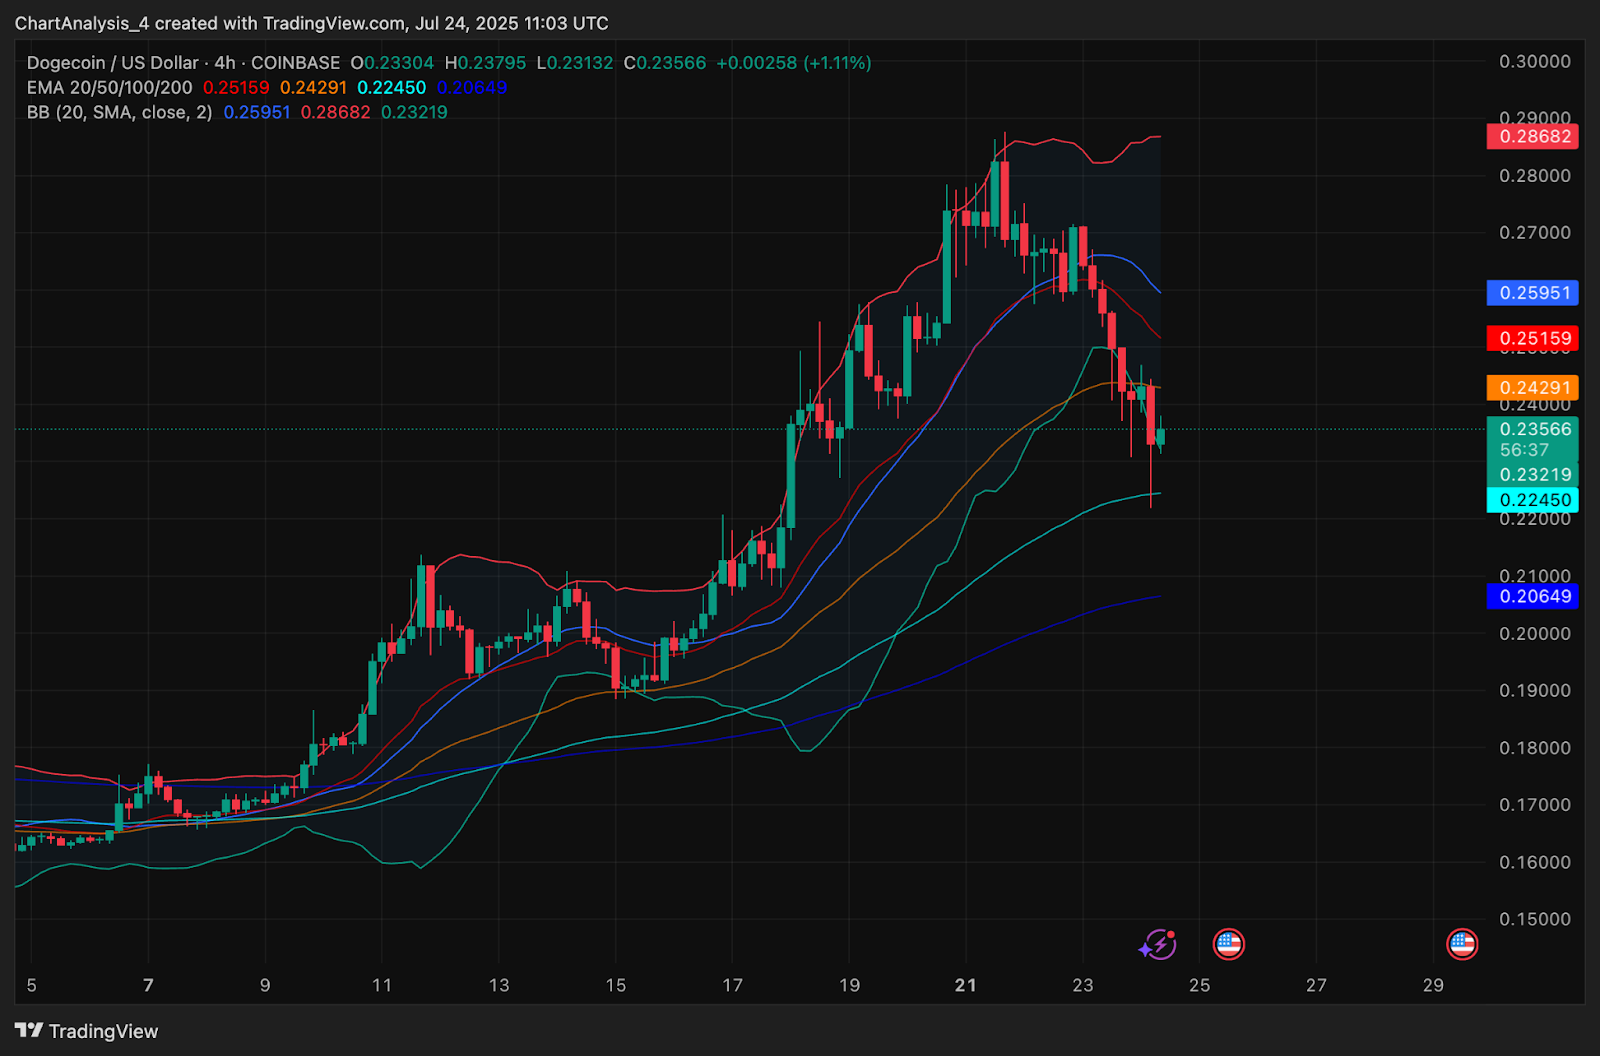
The Bollinger Bands on the 4-hour chart are widening, and price has dropped below the median band (basis at $0.2595). Current price action sits near the lower band at $0.2322, confirming that volatility is expanding in favor of sellers.
DOGE is now trading below the 20, 50, 100, and 200 EMAs. The 20 EMA at $0.2515 is acting as immediate resistance. The 100 EMA at $0.2245 and the lower Bollinger Band together form a nearby demand zone, but the overall structure remains bearish unless DOGE can push back above $0.2440 to $0.2510.
DOGE Price Prediction: Short-Term Outlook (24H)
In the next 24 hours, if Dogecoin price reclaims the $0.242 to $0.244 area and sustains above it, a move toward $0.2515 (EMA20) and $0.2595 (Bollinger basis) may follow. On the other hand, if price fails to clear $0.2417 with strong volume, a drop to retest $0.2240 and possibly $0.2060 becomes likely.
Given the failed breakout structure, Supertrend flip, DMI favoring bears, and falling open interest, DOGE may remain in correction unless buyers reclaim the $0.2510 level with conviction.
Dogecoin Price Forecast Table: July 25, 2025
| Indicator/Zone | Level / Signal |
| Dogecoin price today | $0.2356 |
| Resistance 1 | $0.2420 – minor recovery hurdle |
| Resistance 2 | $0.2515 – EMA20 ceiling |
| Support 1 | $0.2245 – EMA100 and lower band |
| Support 2 | $0.2064 – EMA200 support |
| RSI (30-min) | 46.3 – mild bounce below neutral |
| MACD (30-min) | -0.00287 – weak, bearish signal |
| DMI (4H) | -DI leads at 38.18 – seller control |
| Bollinger Bands (4H) | Widening, price near lower band |
| Supertrend (4H) | Bearish flip below $0.2700 |
| Smart Money CHoCH | Bearish near $0.26 |
| OBV (1D) | Flat at 47.77B – no accumulation |
| Open Interest | $4.13B – declined by 15.3% |
| Derivatives Bias | Long-heavy, elevated squeeze risk |
Disclaimer: The information presented in this article is for informational and educational purposes only. The article does not constitute financial advice or advice of any kind. Coin Edition is not responsible for any losses incurred as a result of the utilization of content, products, or services mentioned. Readers are advised to exercise caution before taking any action related to the company.


 Price Prediction: Canton Eyes Key Break After Market Activity Spike")

