 Price Prediction for July 8")
Dogecoin price today is hovering near $0.171 after briefly spiking above $0.175 earlier this week. While the broader structure remains compressed, DOGE has pushed off its $0.16 support level with a strong impulse move, but now faces significant overhead resistance near $0.175–$0.180. The next 24–48 hours could prove critical for price direction.
What’s Happening With Dogecoin’s Price?
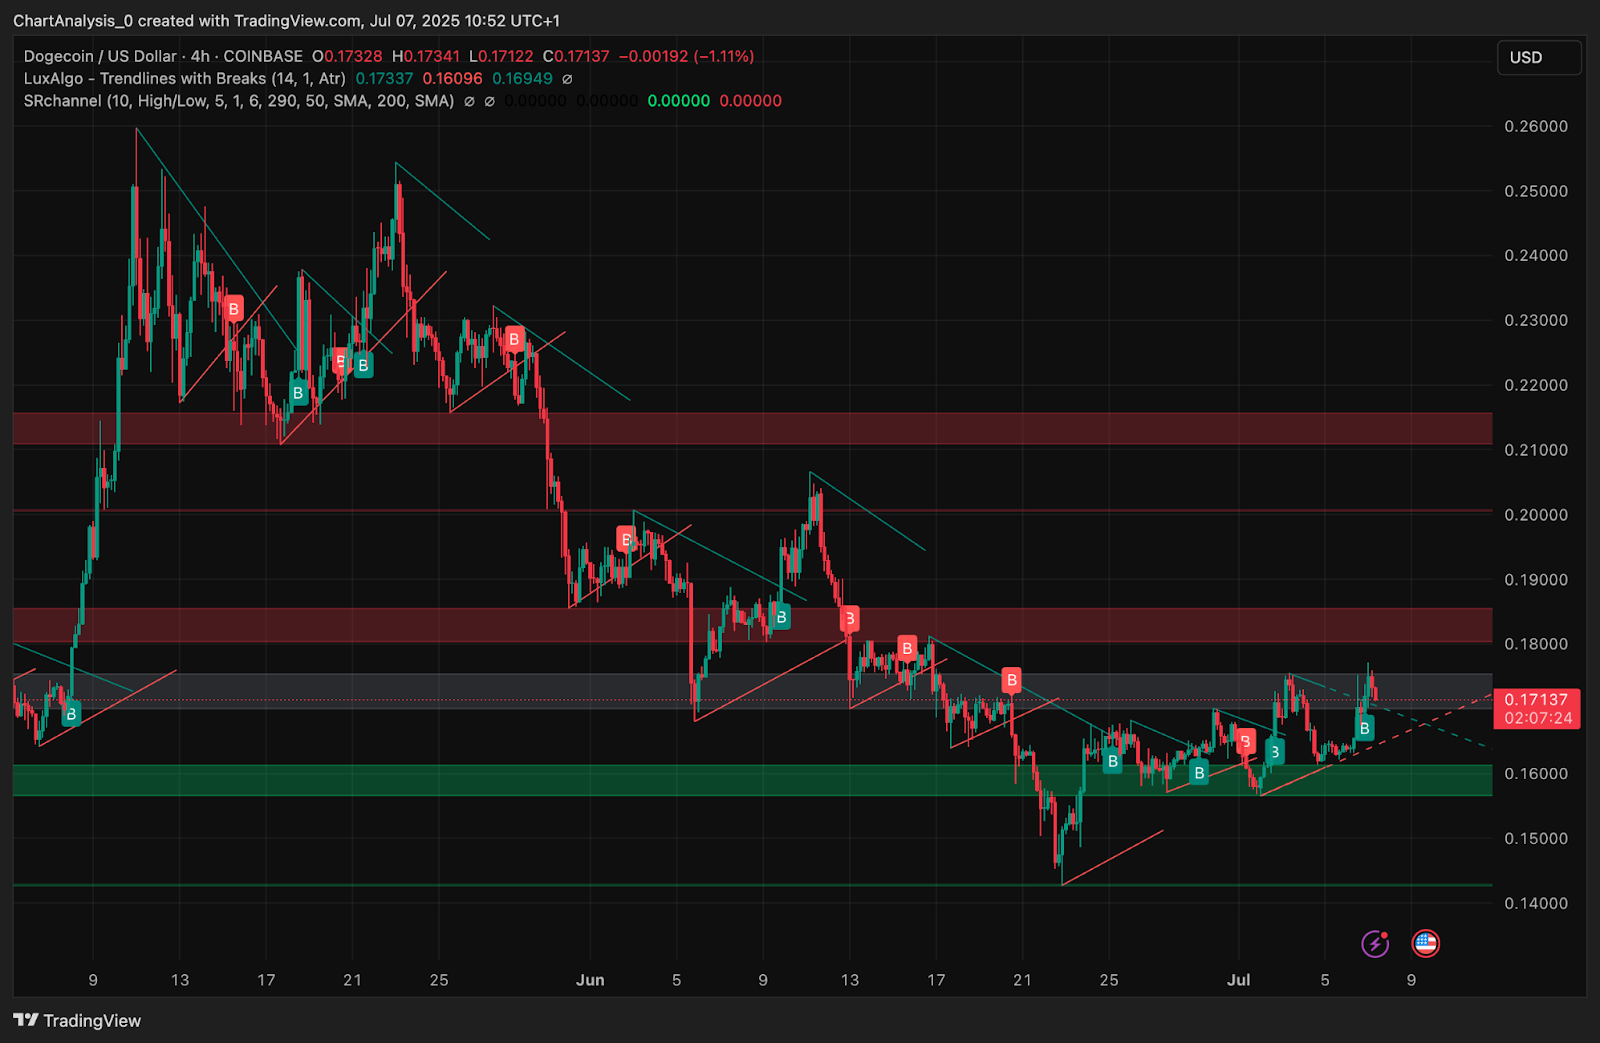
Dogecoin price has climbed over 5% off the July 3 low of $0.162, with bulls attempting to reclaim ground above key trendlines. On the 4-hour chart, DOGE has broken above a falling wedge structure and is now consolidating just beneath the upper Bollinger Band at $0.174, while the mid-band supports at $0.1665.
Parabolic SAR dots have flipped beneath price action, confirming a shift toward bullish control in the short term.
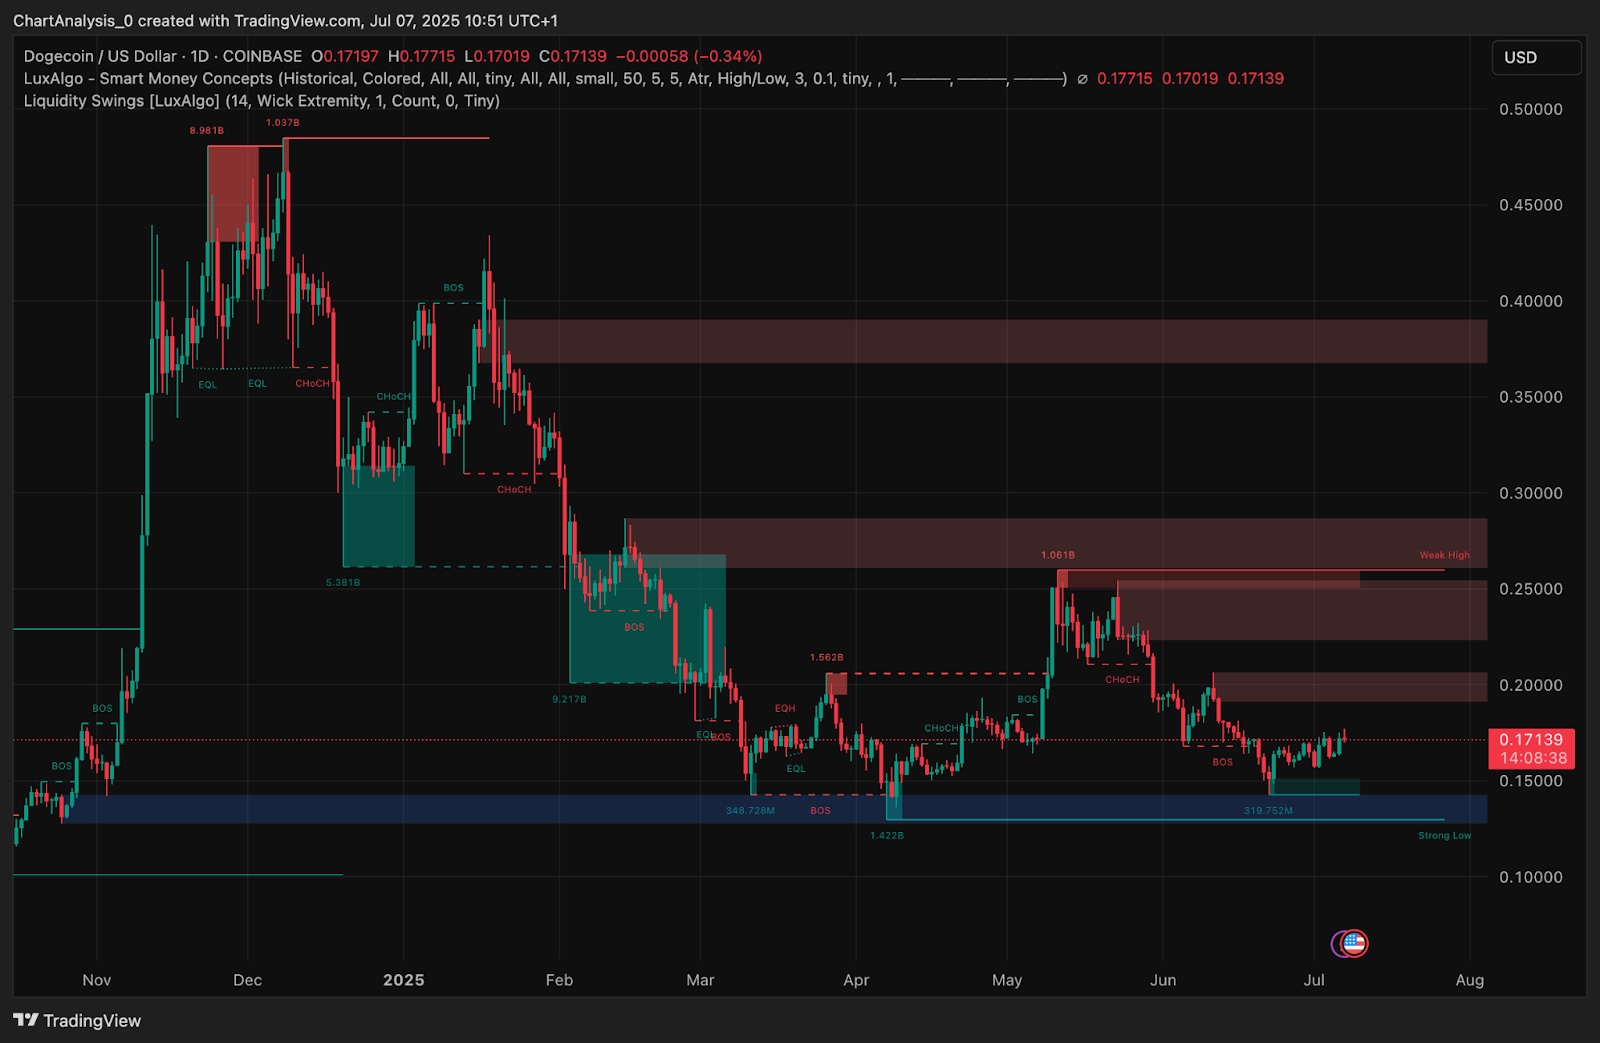
From a Smart Money Concepts (SMC) perspective, DOGE has maintained structure above the latest BOS level near $0.158 and is now retesting a prior CHoCH zone between $0.170–$0.175. Price is trading within a tight liquidity pocket, indicating that bulls are cautiously attempting to absorb supply near a historical resistance band.
Why Dogecoin Price Going Up Today?
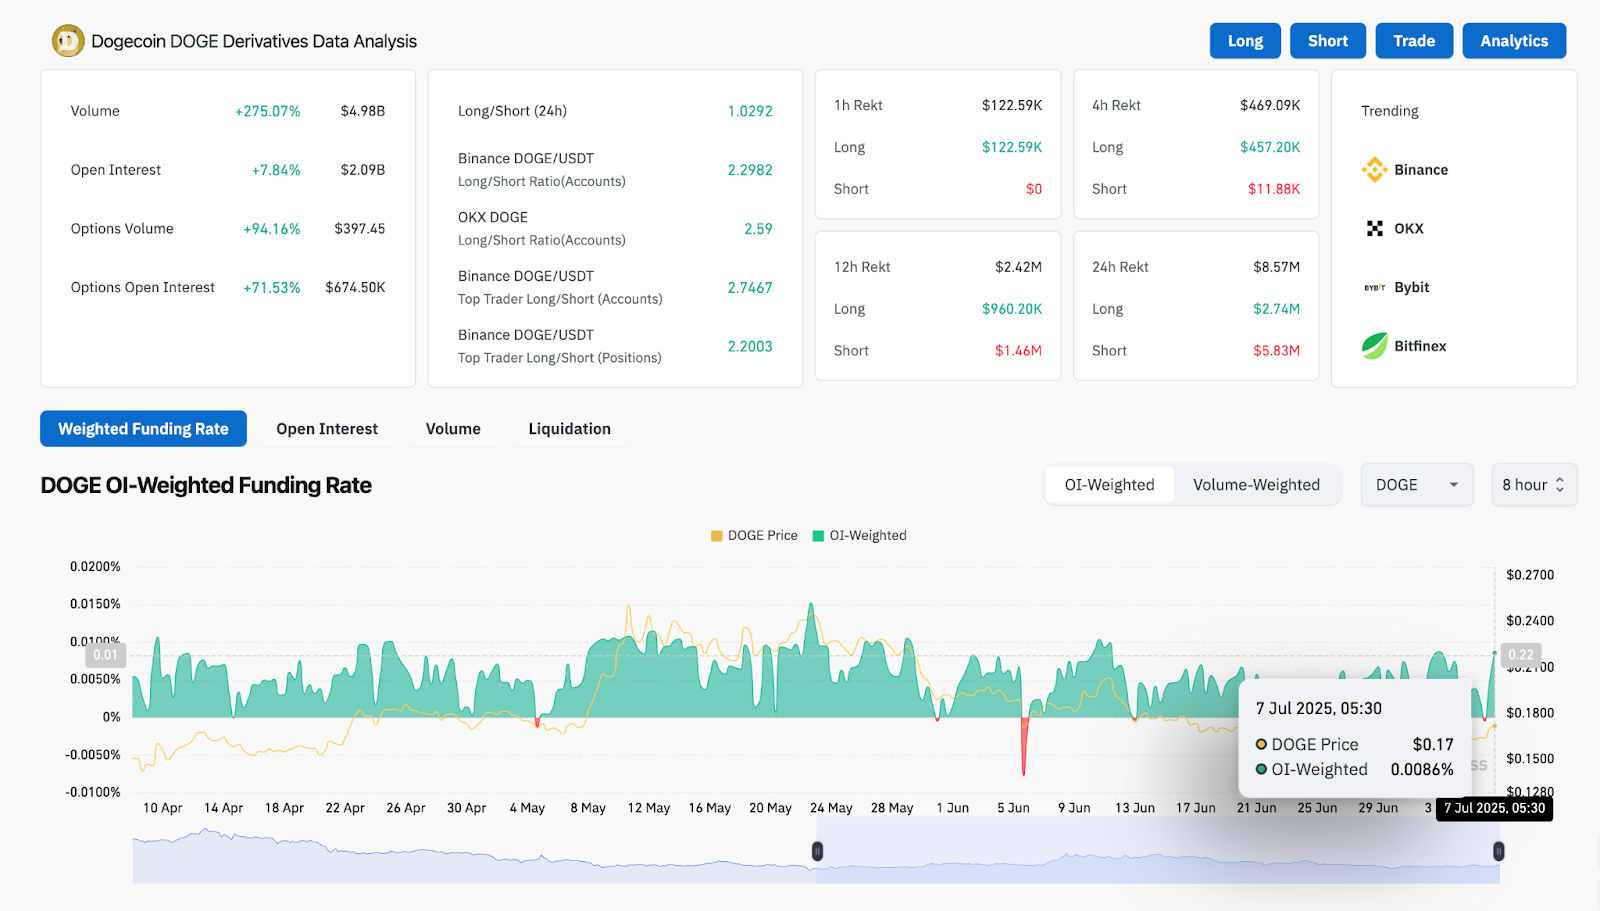
The recent rally in Dogecoin price today is largely fueled by growing momentum in the derivatives market. According to Coinglass data, DOGE volume surged 275% to $4.98B in the last 24 hours, with open interest climbing nearly 8%. The Binance top trader long/short ratio stands at 2.74, while the overall long bias across exchanges is above 2.0 — reflecting firm bullish expectations.
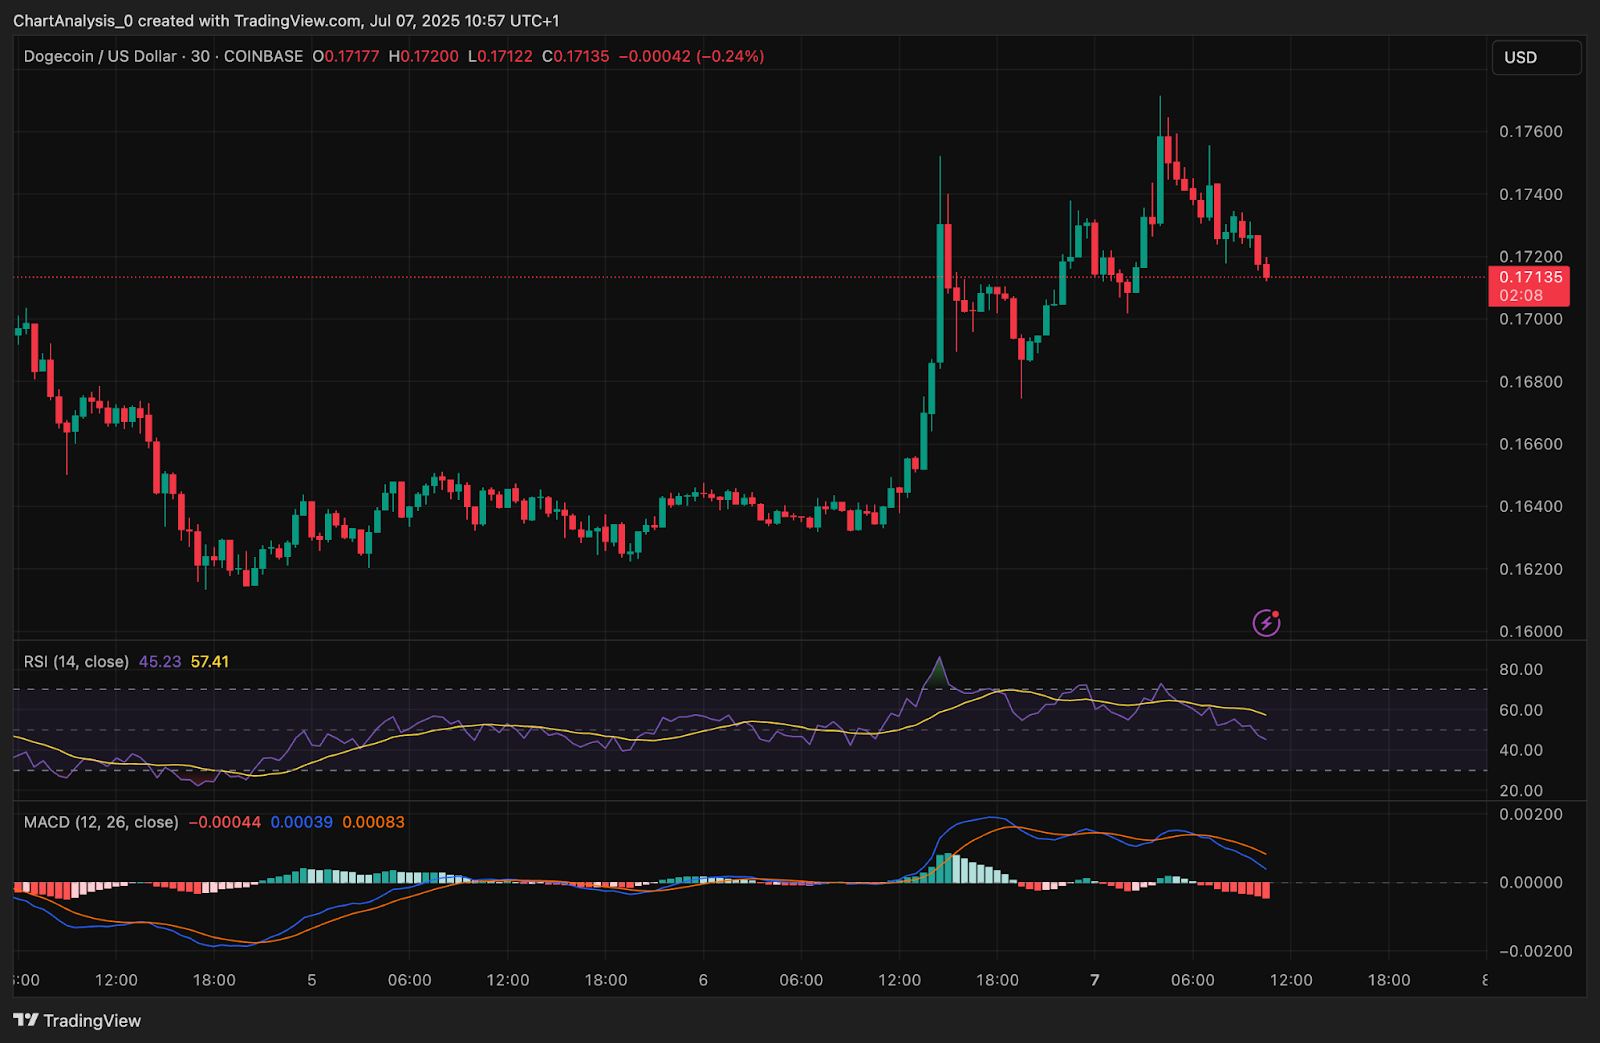
On the 30-minute chart, RSI is retreating from overbought territory and now sits around 45.2, signaling a cool-off but not a full reversal. MACD on the same timeframe is showing a weakening bullish crossover, with the histogram contracting — suggesting consolidation after the sharp push from sub-$0.165 levels.
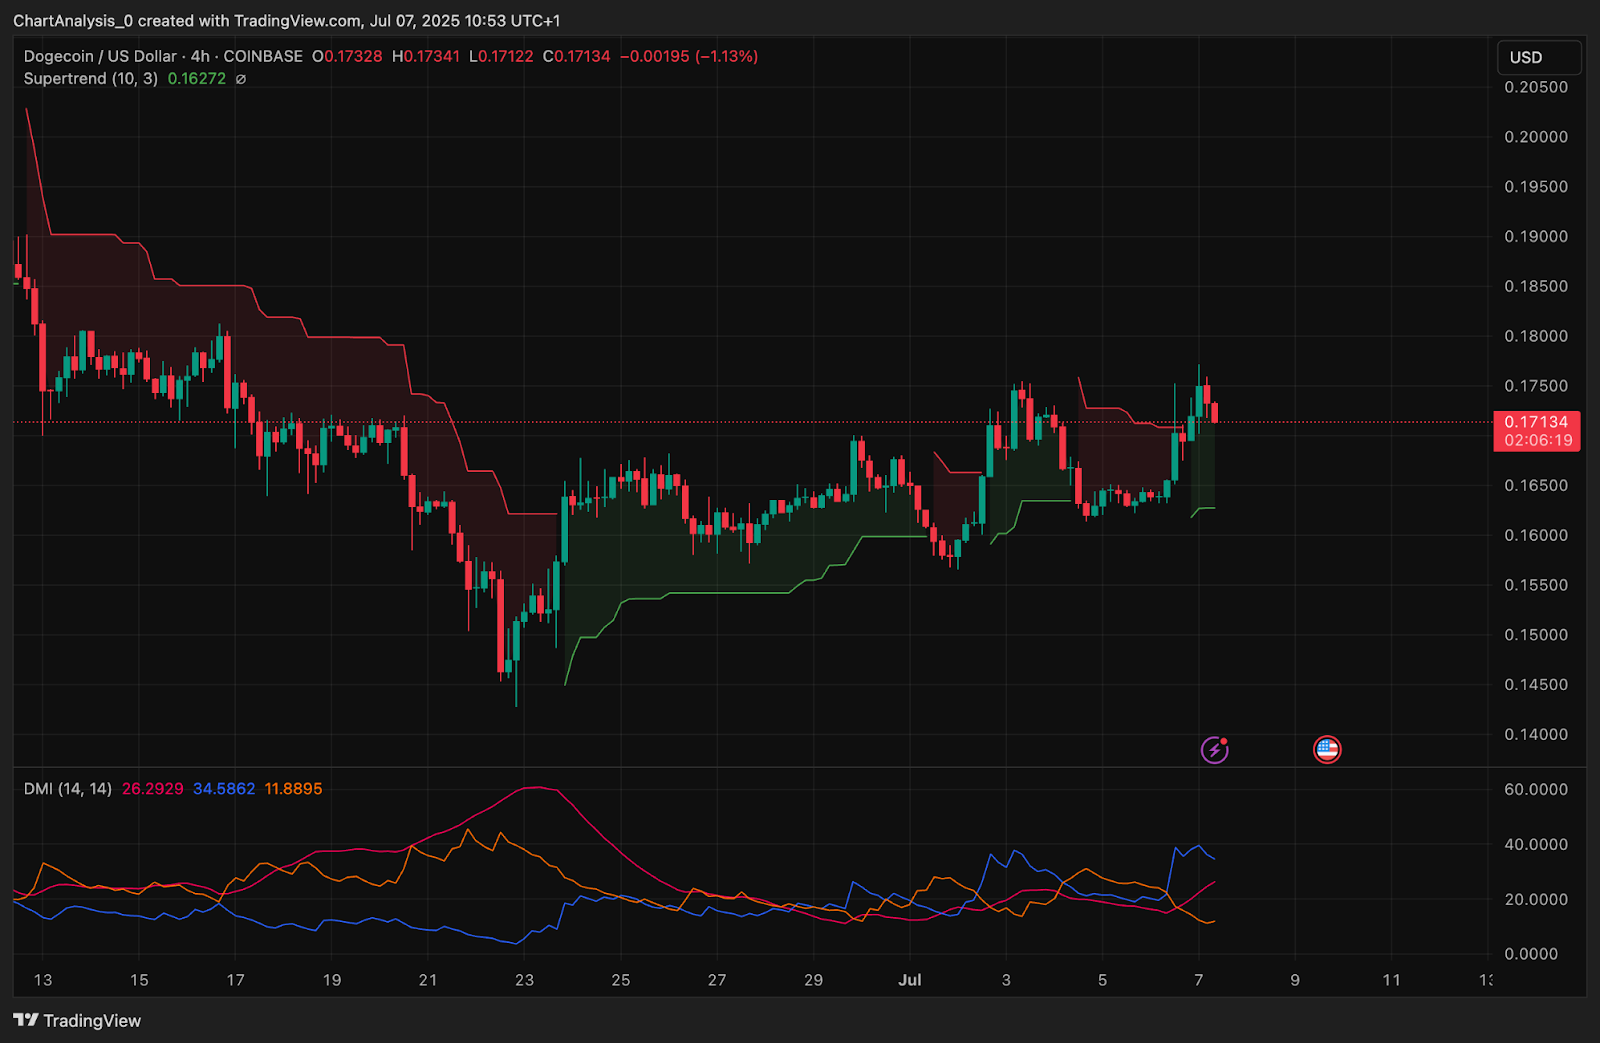
The DMI on the 4-hour chart shows a bullish ADX structure, with +DI leading and rising. Meanwhile, the Supertrend indicator has flipped bullish around $0.1627, with DOGE holding well above that level since the July 4 breakout.
DOGE Price: Bollinger Bands and VWAP Point to Short-Term Compression Break
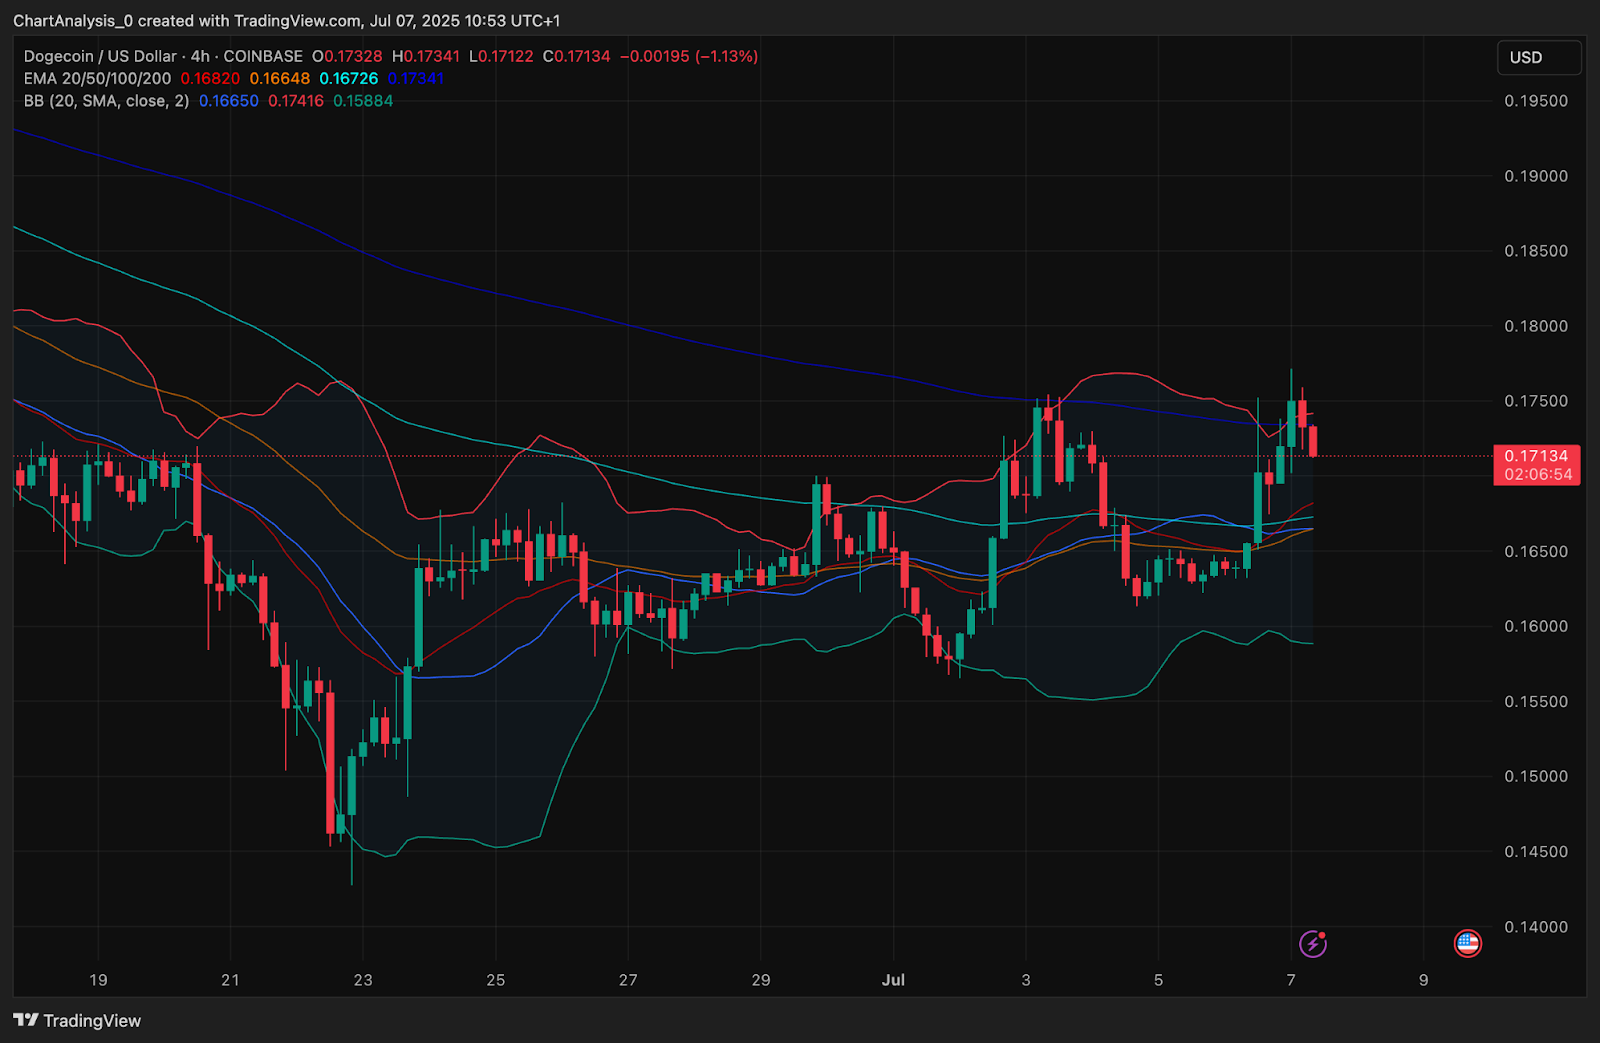
The Bollinger Bands on the 4-hour chart are expanding following a prior squeeze. DOGE briefly tagged the upper band near $0.176 before pulling back toward the mid-line. This classic volatility breakout setup implies that the next move could be significant if volume sustains. The 20/50/100/200 EMAs are now converging between $0.1668 and $0.1734. This EMA compression suggests a volatility breakout may be building.
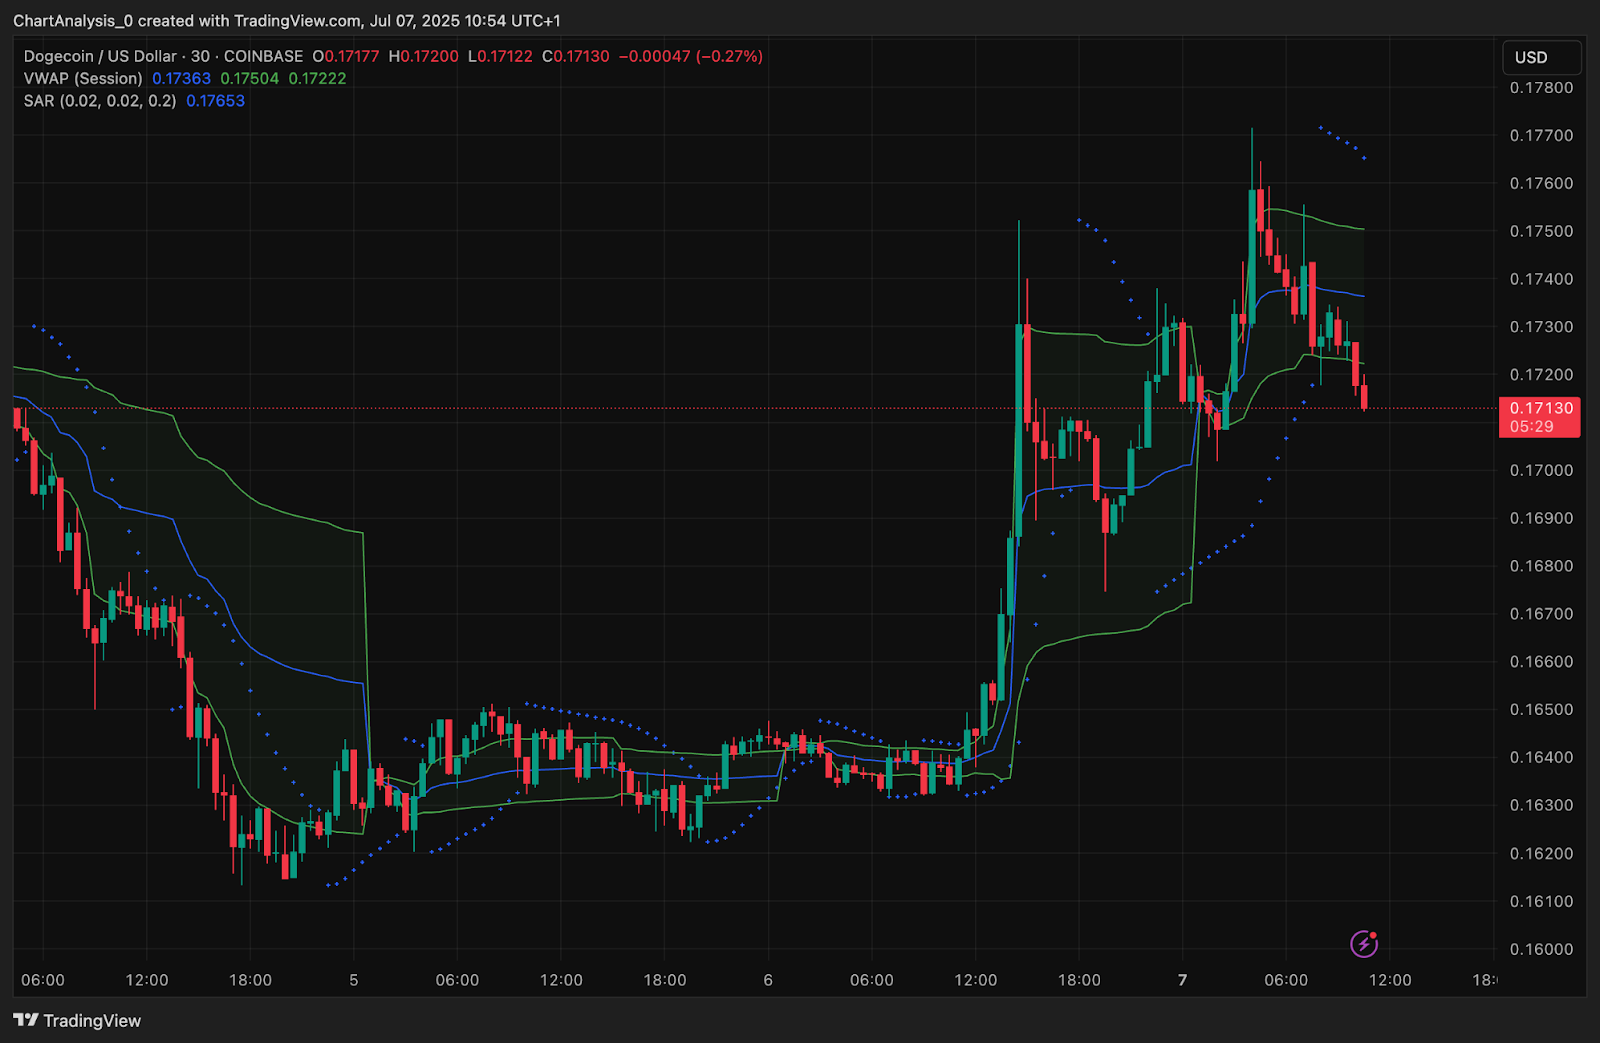
On the 30-minute chart, price is trading slightly below the VWAP ($0.175) and SAR dots are again appearing above price, signaling some intraday rejection. However, unless DOGE breaks below the $0.166–$0.168 zone, the structure remains favorable for buyers.
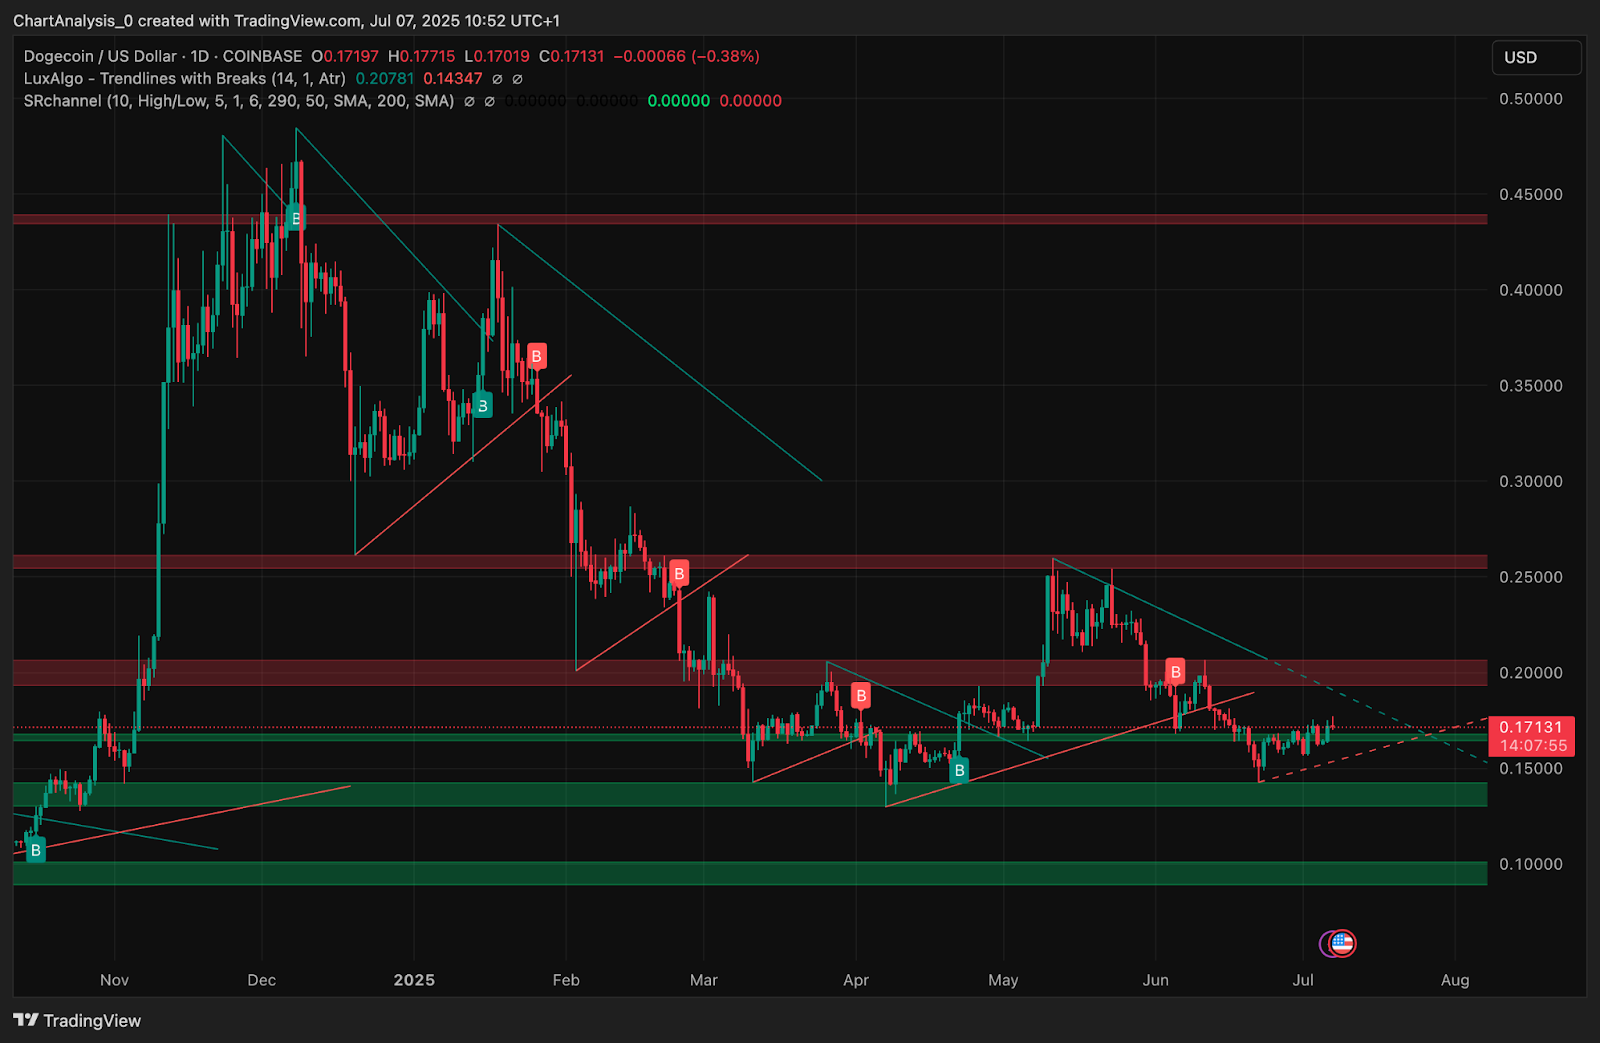
Longer-term trendlines from the daily chart also show DOGE testing a descending resistance line around $0.175 — a breakout from this zone could unlock upside momentum toward the $0.19–$0.20 levels, where prior liquidity resides.
Dogecoin Price Prediction: Short-Term Outlook (24H)
Dogecoin price remains compressed within a short-term ascending channel and is approaching a decision point around $0.175. If bulls can reclaim this zone with volume and close above it, the next target lies at $0.185 and then $0.198.
On the downside, if rejection continues, immediate support is seen at $0.166, with a deeper pullback opening the door to $0.158 — which served as the last BOS zone on the daily SMC structure.
With derivatives data showing a long-heavy skew, and the Supertrend and EMAs turning constructive, momentum appears cautiously in favor of bulls. However, DOGE must clear $0.175 decisively to confirm the breakout.
Dogecoin Price Forecast Table: July 8, 2025
| Indicator/Zone | Level / Signal |
| Dogecoin price today | $0.171 |
| Resistance 1 | $0.175 (descending trendline) |
| Resistance 2 | $0.185 / $0.198 (liquidity pocket) |
| Support 1 | $0.166 (VWAP / Bollinger mid-band) |
| Support 2 | $0.158 (prior BOS level) |
| RSI (30-min) | 45.2 (cooling but neutral) |
| MACD (30-min) | Weak bullish crossover fading |
| Bollinger Bands (4H) | Expanding, near upper band rejection |
| EMAs (20/50/100/200, 4H) | Compressed, bullish alignment |
| Supertrend (4H) | Bullish above $0.1627 |
| Derivatives Volume | +275%, with long-dominant bias |
| SMC Structure | Retesting CHoCH above BOS zone |
Disclaimer: The information presented in this article is for informational and educational purposes only. The article does not constitute financial advice or advice of any kind. Coin Edition is not responsible for any losses incurred as a result of the utilization of content, products, or services mentioned. Readers are advised to exercise caution before taking any action related to the company.

 Price Prediction: Can Bulls Sustain Above $2,100?")


