 Price Prediction For June 25")
The Dogecoin price today is trading near $0.1256, recovering from last week’s selloff that briefly pushed price below key support at $0.118. The rebound comes as DOGE reclaims its short-term trendline on the 4-hour chart, with bullish signals returning across multiple indicators.
However, with price now approaching a cluster of EMA and volatility-based resistances, the next move depends on whether bulls can clear $0.129–$0.130 decisively.
What’s Happening With Dogecoin’s Price?
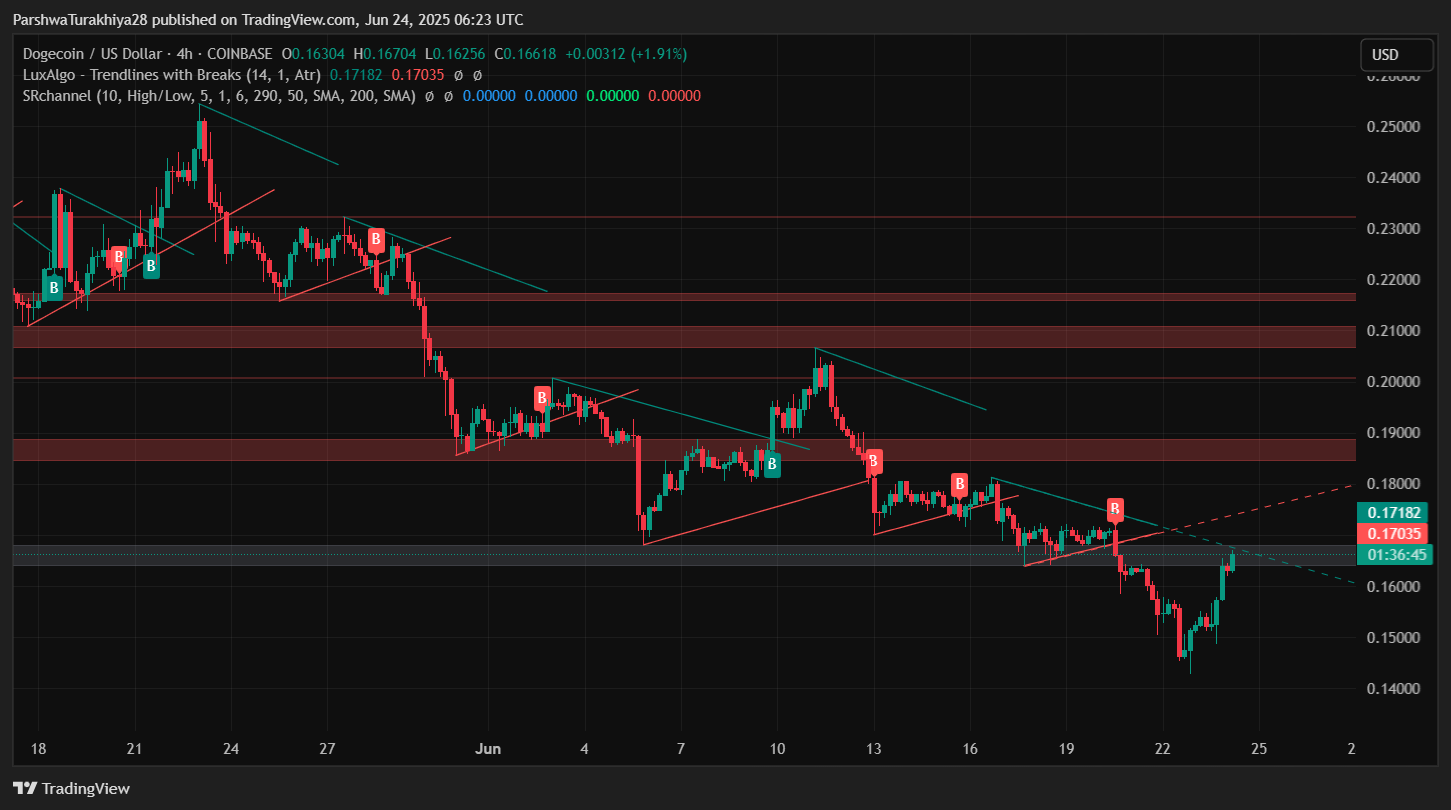
Following a week of downward pressure, Dogecoin price action has started to stabilize. The current bounce aligns with the retest of the 4-hour ascending trendline support near $0.1175, where a bullish engulfing candle marked a reversal. Since then, DOGE has pushed back above $0.123 and is now testing short-term resistance around $0.127.
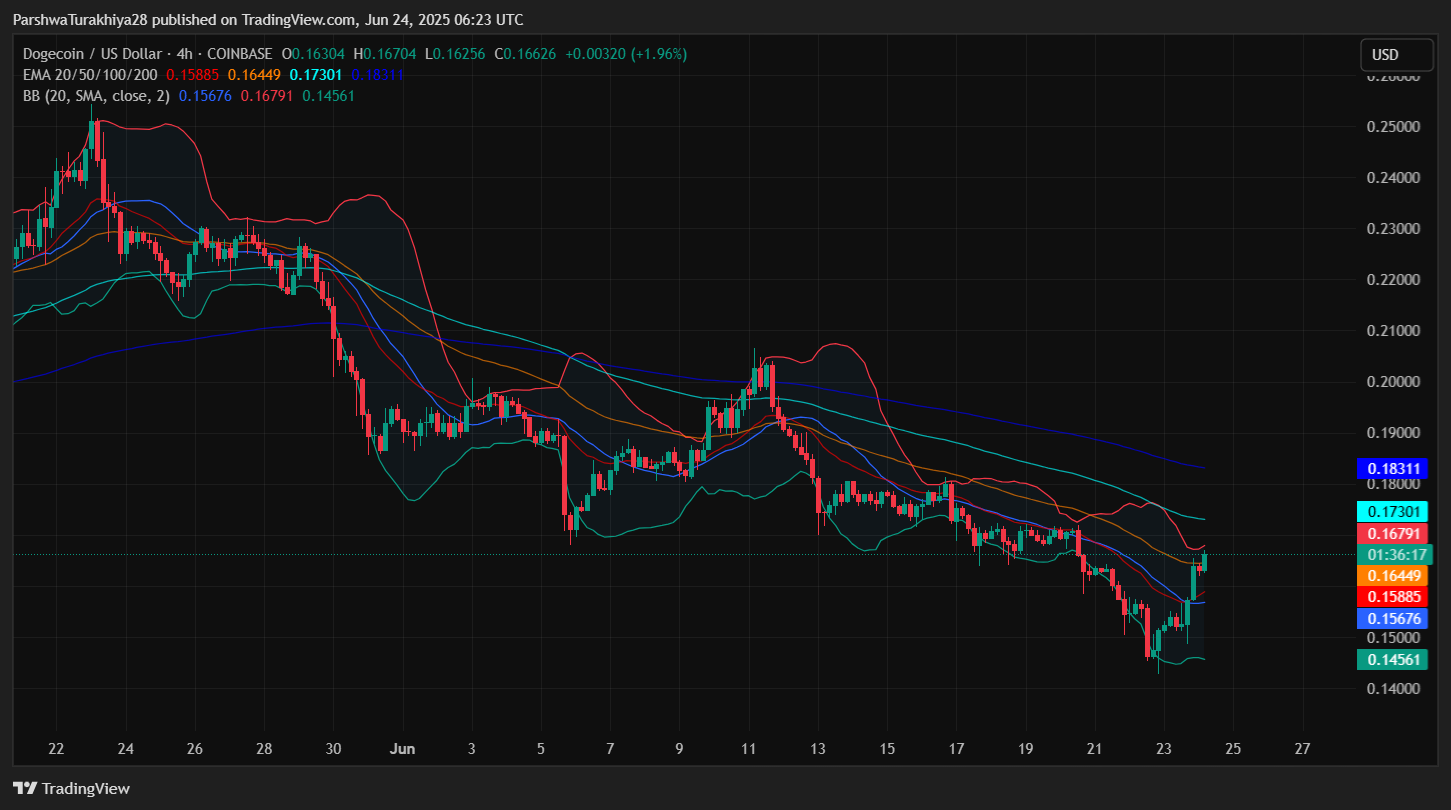
The 4-hour chart shows a developing bullish structure, supported by the recent flip in the Supertrend indicator to green. The trendline support now trails just below $0.1183. Meanwhile, the Bollinger Bands are beginning to widen again, hinting at a rise in Dogecoin price volatility. Overhead resistance from the 20/50 EMA cluster at $0.127–$0.129 is key in the short term.
Why Dogecoin Price Going Up Today?
The recent rebound in Dogecoin price is driven by a confluence of technical signals. On the 30-minute chart, RSI is climbing steadily, currently at 63.6, signaling growing bullish momentum though nearing the overbought region. MACD shows a bullish crossover remains intact, although the histogram is beginning to soften, suggesting that the initial thrust may be cooling.

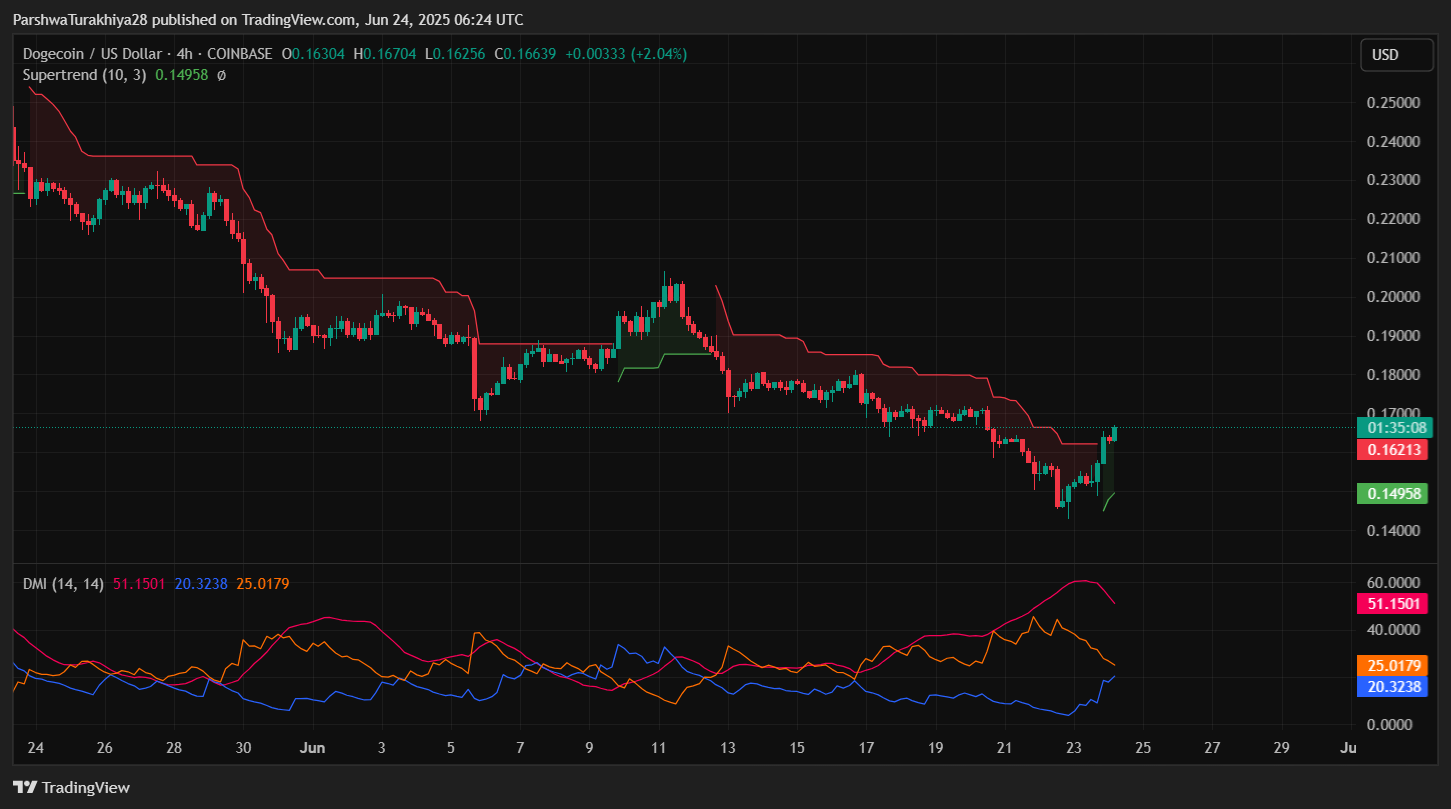
The Supertrend has turned bullish on the 4-hour chart, with trailing support near $0.1183. DMI readings remain mixed — +DI is climbing, but -DI is still elevated, which suggests buyers are attempting to take control but have not fully asserted dominance yet.
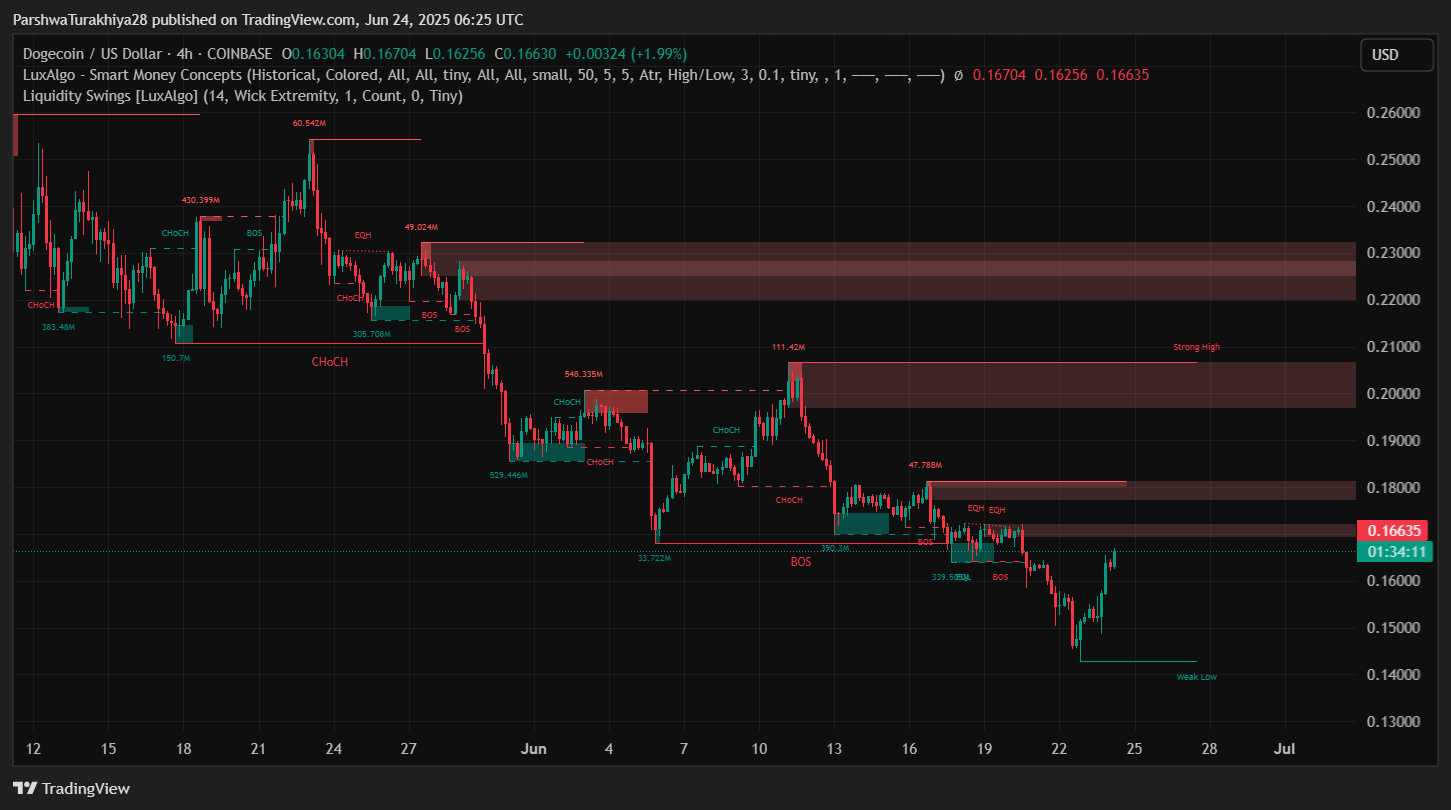
The Dogecoin price is showing renewed upward momentum after defending the $0.14 liquidity pocket, now climbing back above $0.166. This recovery aligns with a bullish CHoCH (Change of Character) on the 4-hour chart, confirmed just below the $0.15 mark. Price is currently testing a local supply block near $0.1665–$0.179, and a clean breakout above this region may flip short-term structure.
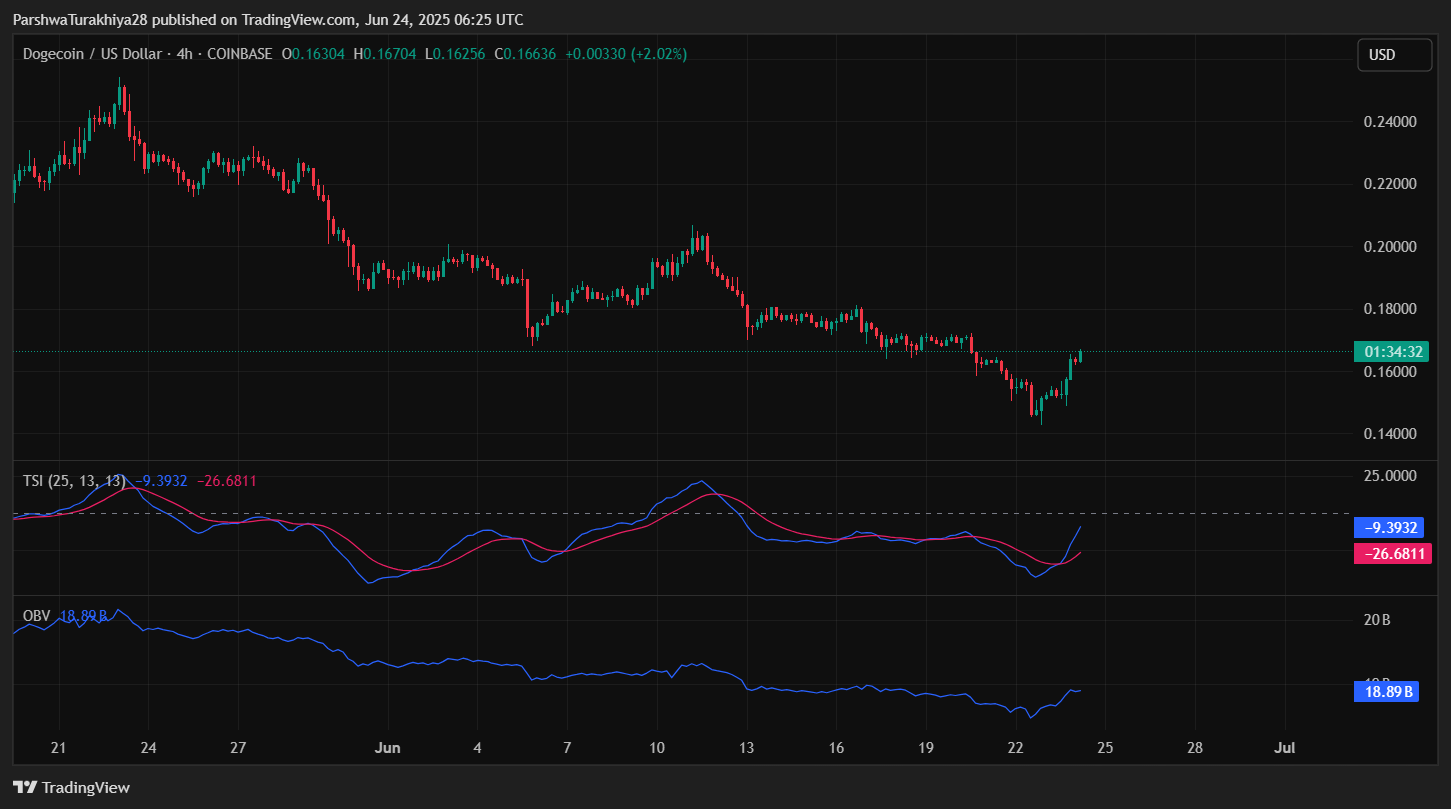
From a momentum perspective, the True Strength Index (TSI) has turned sharply higher, crossing above its signal line for the first time since early June. While the TSI reading is still negative at -9.39, the direction suggests improving internal strength. This is further supported by a small but notable uptick in On-Balance Volume (OBV), which has risen back to 18.89B, reflecting gradual accumulation.
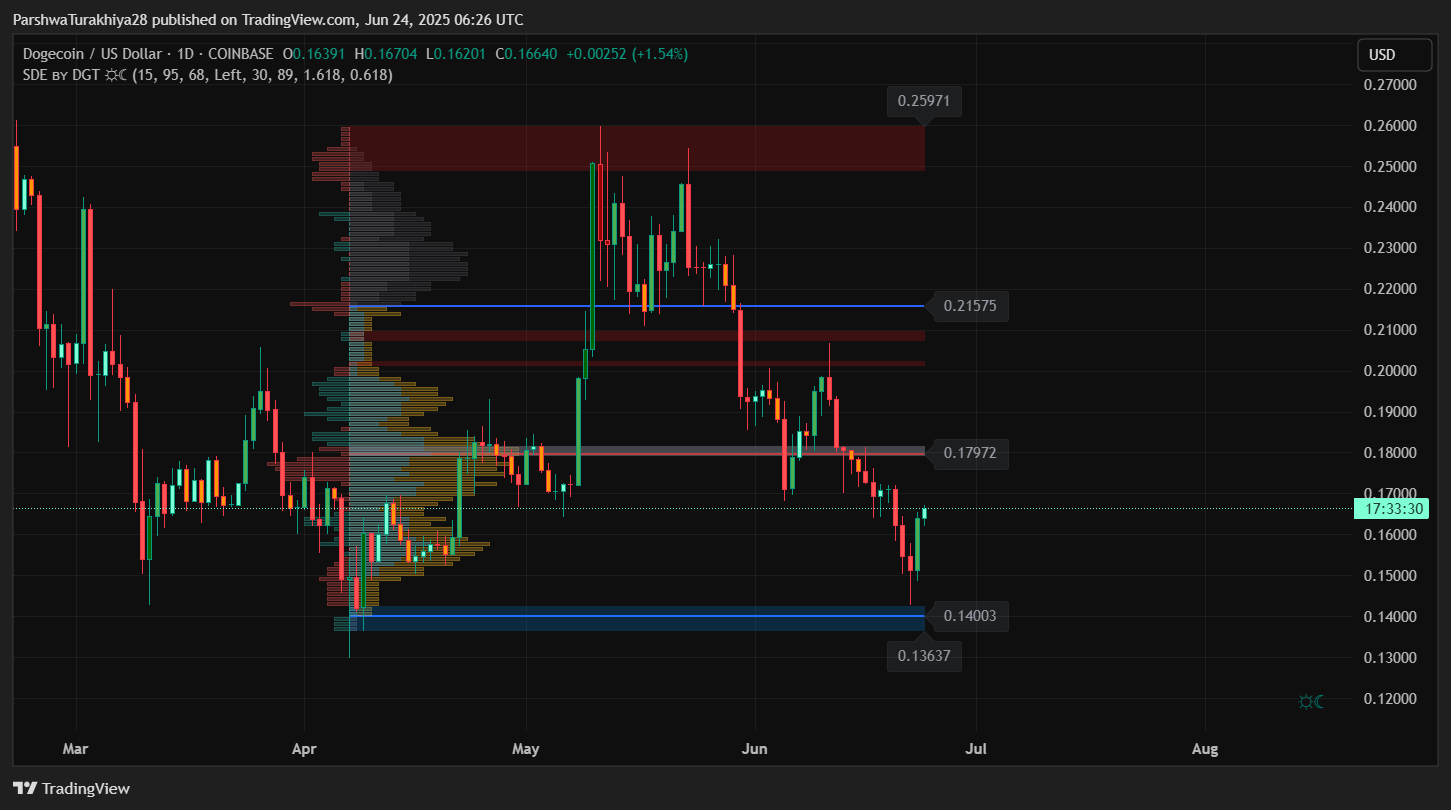
Volume profile analysis on the daily chart reveals a high-volume node near $0.140, which provided key demand support. Price is now pushing into lower resistance clusters just below $0.18. Should this be cleared, upside could extend toward the higher volume imbalance zone between $0.215 and $0.22.
Dogecoin Price Volatility Building Below $0.130

Above this, the daily resistance range between $0.1325 and $0.135 remains untested since mid-June and may serve as a strong supply zone if DOGE breaks higher. On the downside, the $0.123 zone remains initial support, with stronger defense near $0.118 — the base of the current rebound and Supertrend support.
The 4-hour structure shows DOGE forming a short-term higher low above $0.118, and as long as this level holds, the probability of testing $0.130 again remains valid.
Short-Term Outlook: Will DOGE Clear $0.130?
In the short term, Dogecoin is attempting to shift momentum back in favor of the bulls. If price closes above $0.129 with volume support, a retest of $0.1325 and possibly $0.135 could follow. However, without a confirmed breakout, there remains a risk of consolidation between $0.123 and $0.129 as momentum indicators show early signs of exhaustion.
If DOGE fails to maintain above $0.123, the recovery could unwind toward $0.118 and even test the $0.115 zone again.
Dogecoin Price Forecast Table
| Indicator/Zone | Level (USD) | Signal Description |
| Dogecoin price today | $0.1256 | Current spot level |
| Resistance 1 | $0.1290 | EMA + Bollinger upper band |
| Resistance 2 | $0.1325–0.135 | Higher resistance from June highs |
| Support 1 | $0.1230 | Minor horizontal support |
| Support 2 | $0.1183 | Supertrend and trendline base |
| RSI (30-min) | 63.6 | Rising, nearing overbought |
| MACD (30-min) | Bullish | Momentum softening slightly |
| Supertrend (4H) | Bullish | Support at $0.1183 |
| CMF (20) | 0.05 | Weak inflows |
| BBWP | Expanding | Volatility increasing |
| DMI (+DI/-DI) | 24.1 / 42.3 | Mixed, bulls attempting control |
Disclaimer: The information presented in this article is for informational and educational purposes only. The article does not constitute financial advice or advice of any kind. Coin Edition is not responsible for any losses incurred as a result of the utilization of content, products, or services mentioned. Readers are advised to exercise caution before taking any action related to the company.


