
After an early attempt to reclaim momentum above $0.17, the Dogecoin price today is hovering near $0.163. The move follows a steep rejection from the descending trendline and local resistance zone marked just below $0.168–$0.170. While price briefly rebounded after testing sub-$0.158 intraday lows on June 21, overhead resistance remains firm, and the short-term outlook continues to flash caution.
The recent consolidation beneath the breakdown zone is fueling questions about why Dogecoin price going down today, especially as multiple timeframes suggest trend exhaustion, increased volatility, and weak buyer follow-through.
What’s Happening With Dogecoin’s Price?
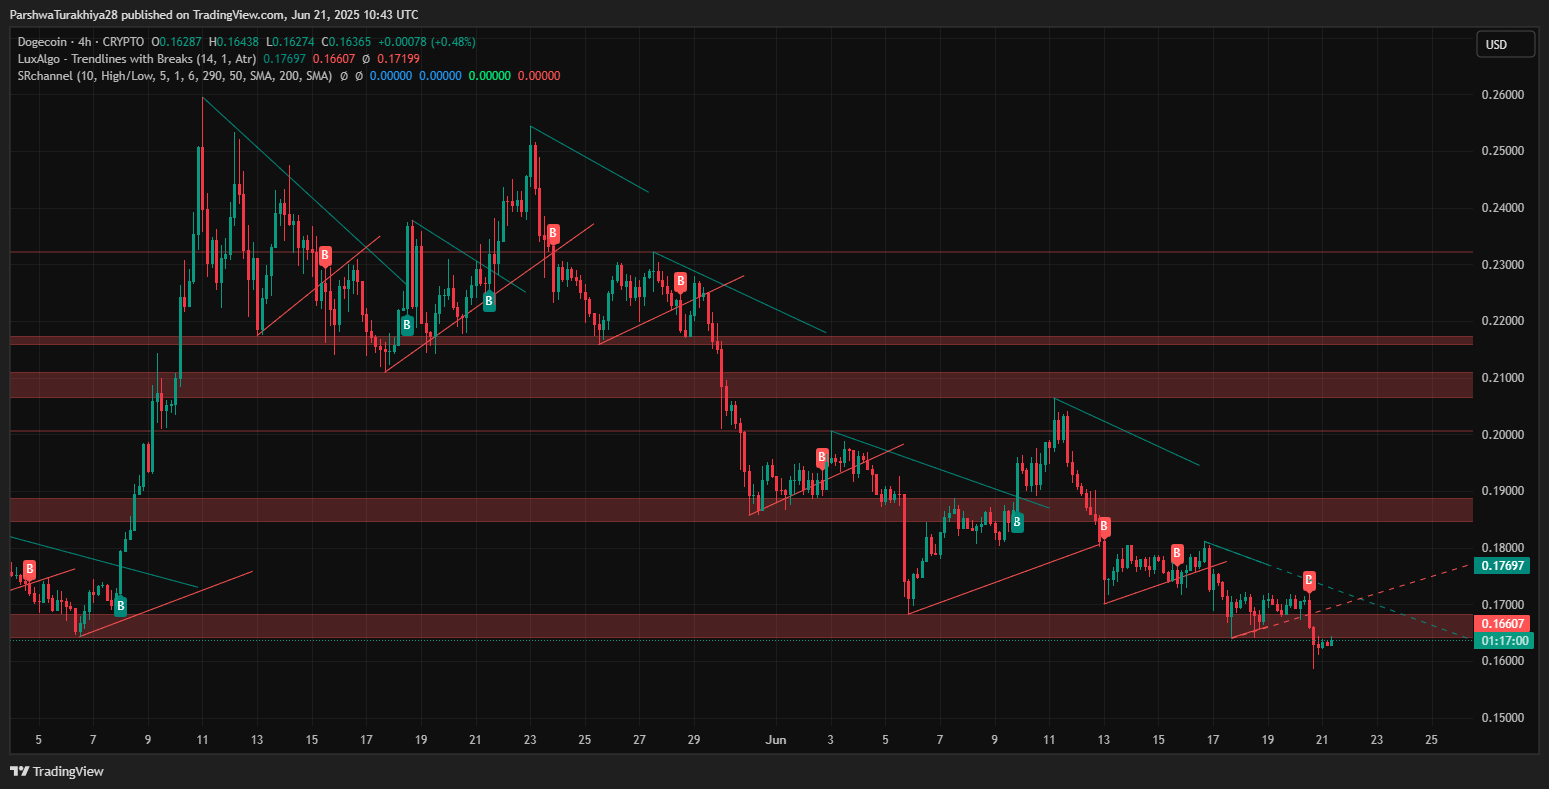
On the 4-hour chart, Dogecoin price remains trapped within a well-defined descending wedge pattern, with multiple failed attempts to breach the upper resistance. The most recent breakdown on June 20 pushed DOGE below the wedge and into a prior demand zone near $0.160–$0.163. Bulls managed to step in around $0.158, which now acts as the immediate floor, but a lack of volume on the bounce hints at limited conviction.
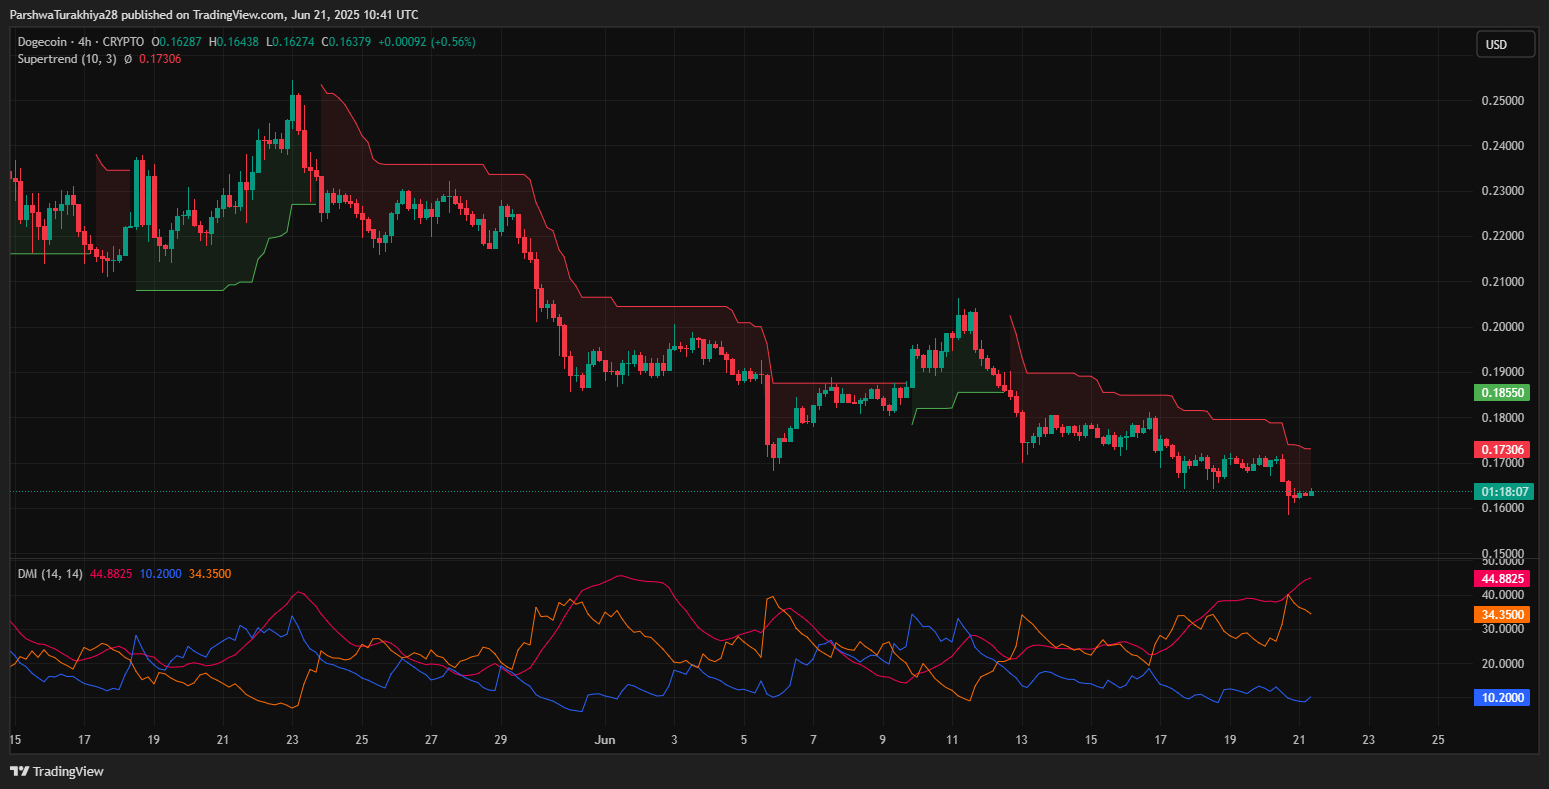
The Supertrend indicator remains bearish, currently showing resistance around $0.173. DMI readings continue to favor sellers, with the -DI line sitting elevated near 44.8 while +DI lags around 10.2. This imbalance highlights the dominant bearish trend, even as short-term relief rallies occur.
Dogecoin Price Action Shows Repeated Failures at Trendline Breakouts
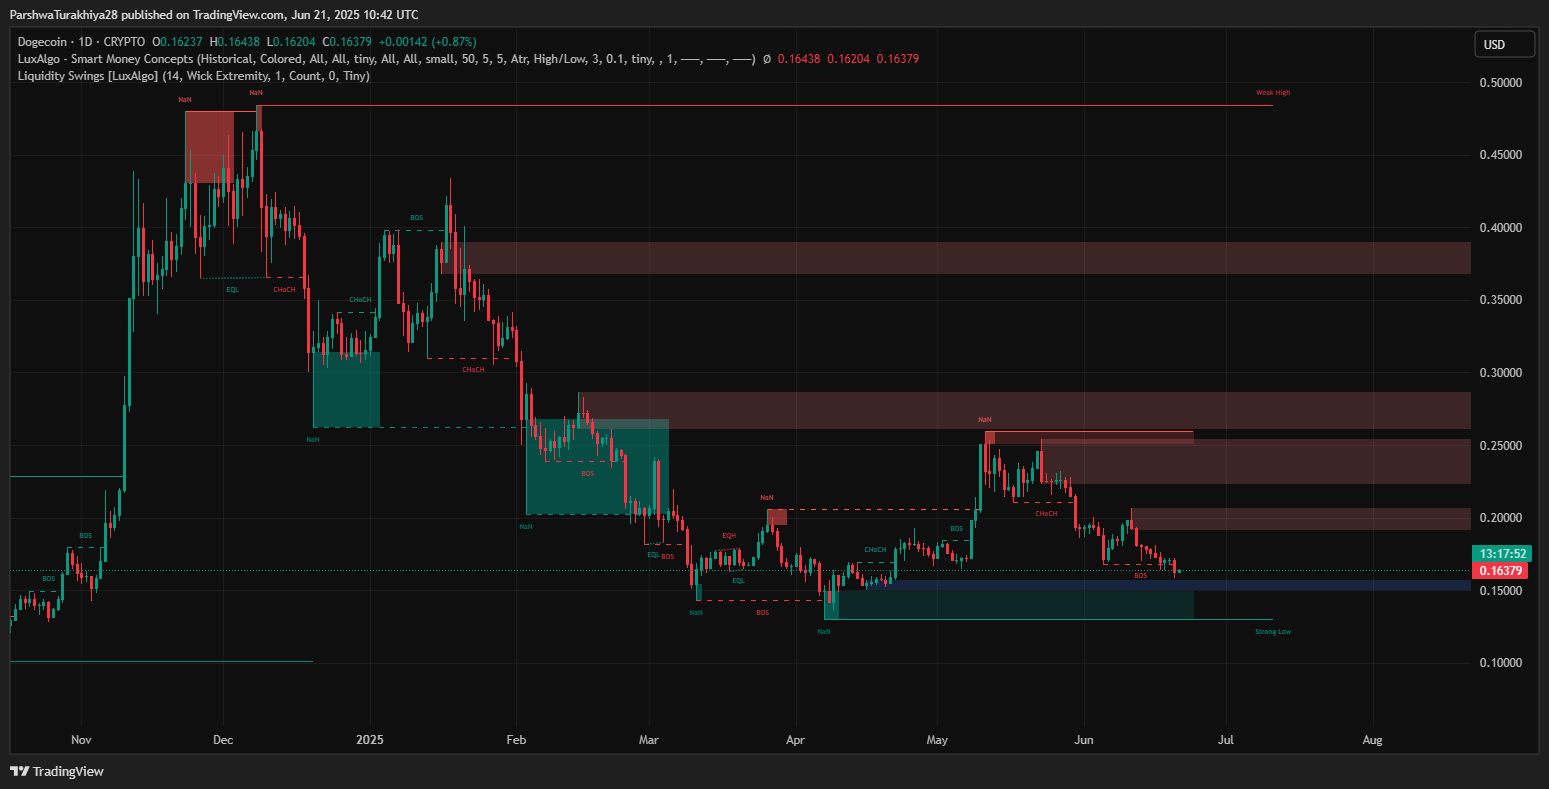
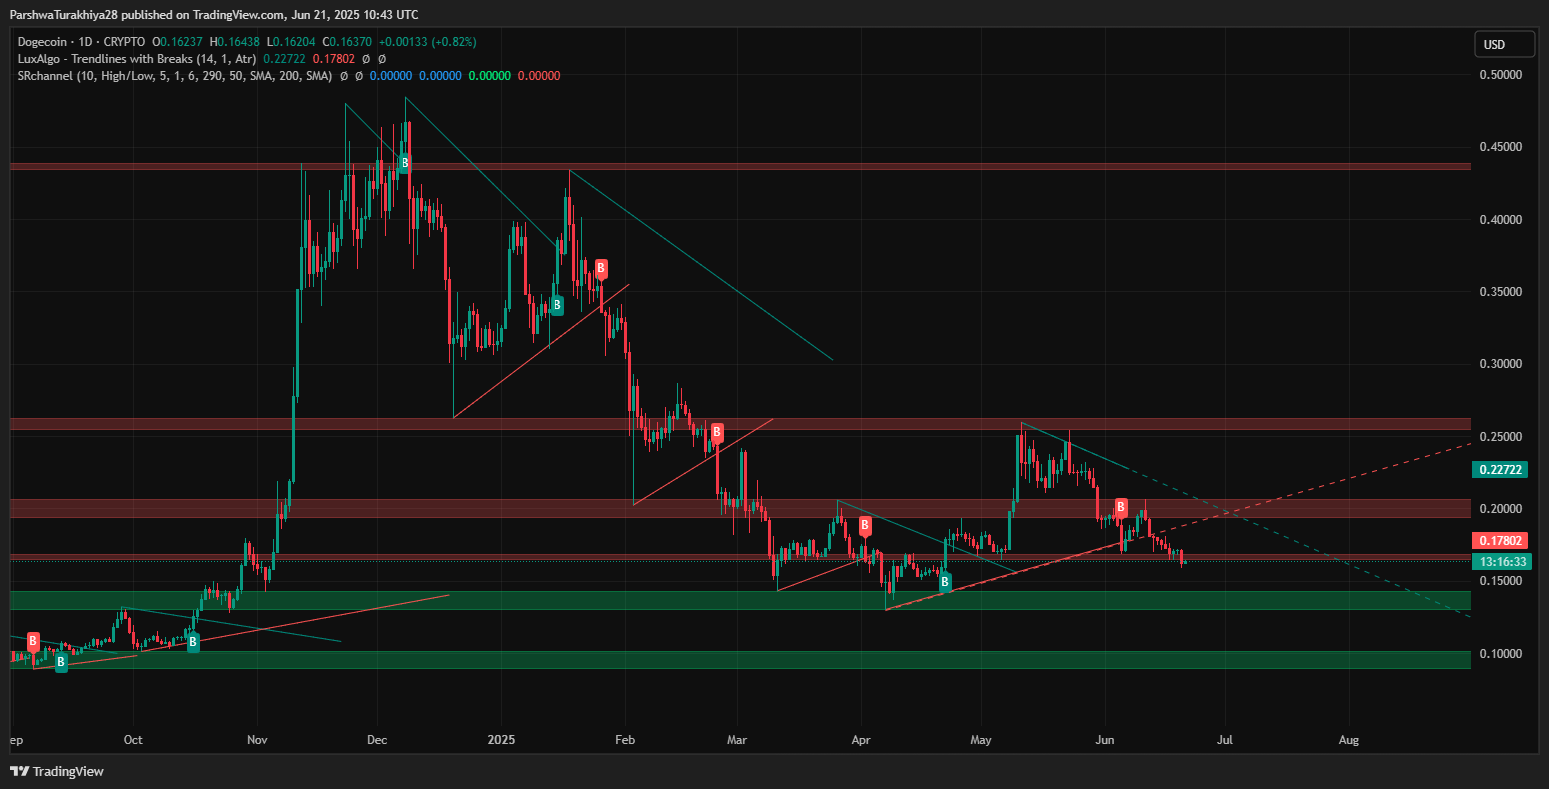
On the daily chart, Dogecoin price action shows a broader downtrend in motion following a series of lower highs and lower lows. The trendline system confirms multiple bearish structure breaks, especially after the key BOS (Break of Structure) near $0.179 and $0.164 levels.
More critically, DOGE is now testing a liquidity pocket near the $0.158–$0.163 region that overlaps with a previously established bullish BOS zone from May. If this zone gives way, it opens up downside potential toward the next untested support band around $0.145–$0.150.
This structure puts emphasis on short-term holding strength at $0.16. A breakdown would reinforce the bearish leg and nullify the possibility of a bullish recovery without a complete market rotation.
VWAP Rejection and SAR Flattening Hint at Tug-of-War
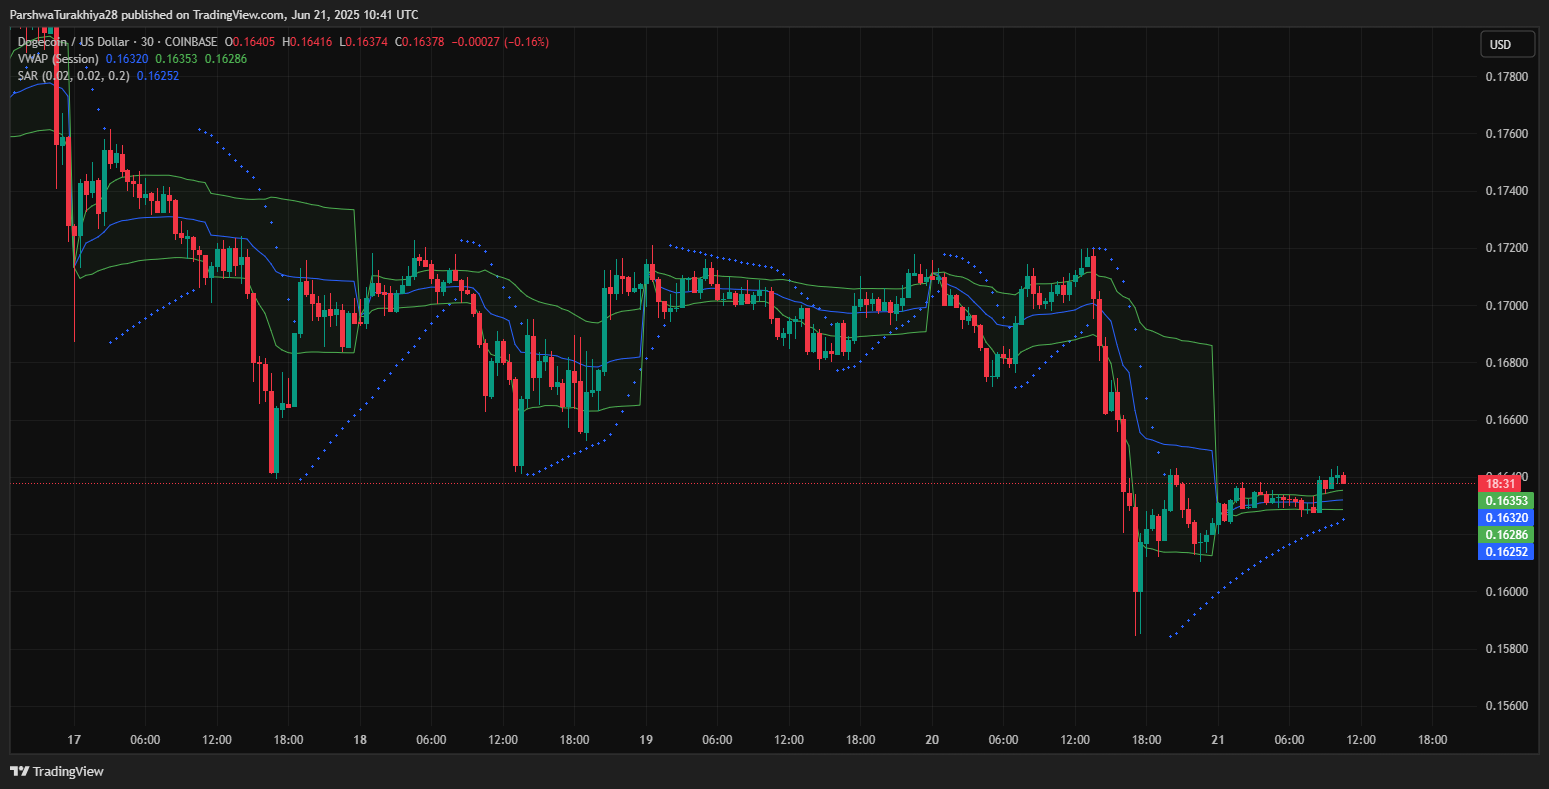
On the 30-minute structure, price action remains compressed between VWAP bands and the SAR reversal threshold. This confluence zone near $0.163–$0.164 is proving pivotal. Failing to break above VWAP has historically preceded sharp downside flushes, such as the one seen on June 20 when DOGE plunged below $0.158.
At present, price is hovering right under the VWAP mean while testing the upper deviation. This positioning often hints at a volatility event, especially if SAR levels begin to align above the price again — signaling renewed downside risk.
Technical Indicators Reflect Building Dogecoin Price Volatility
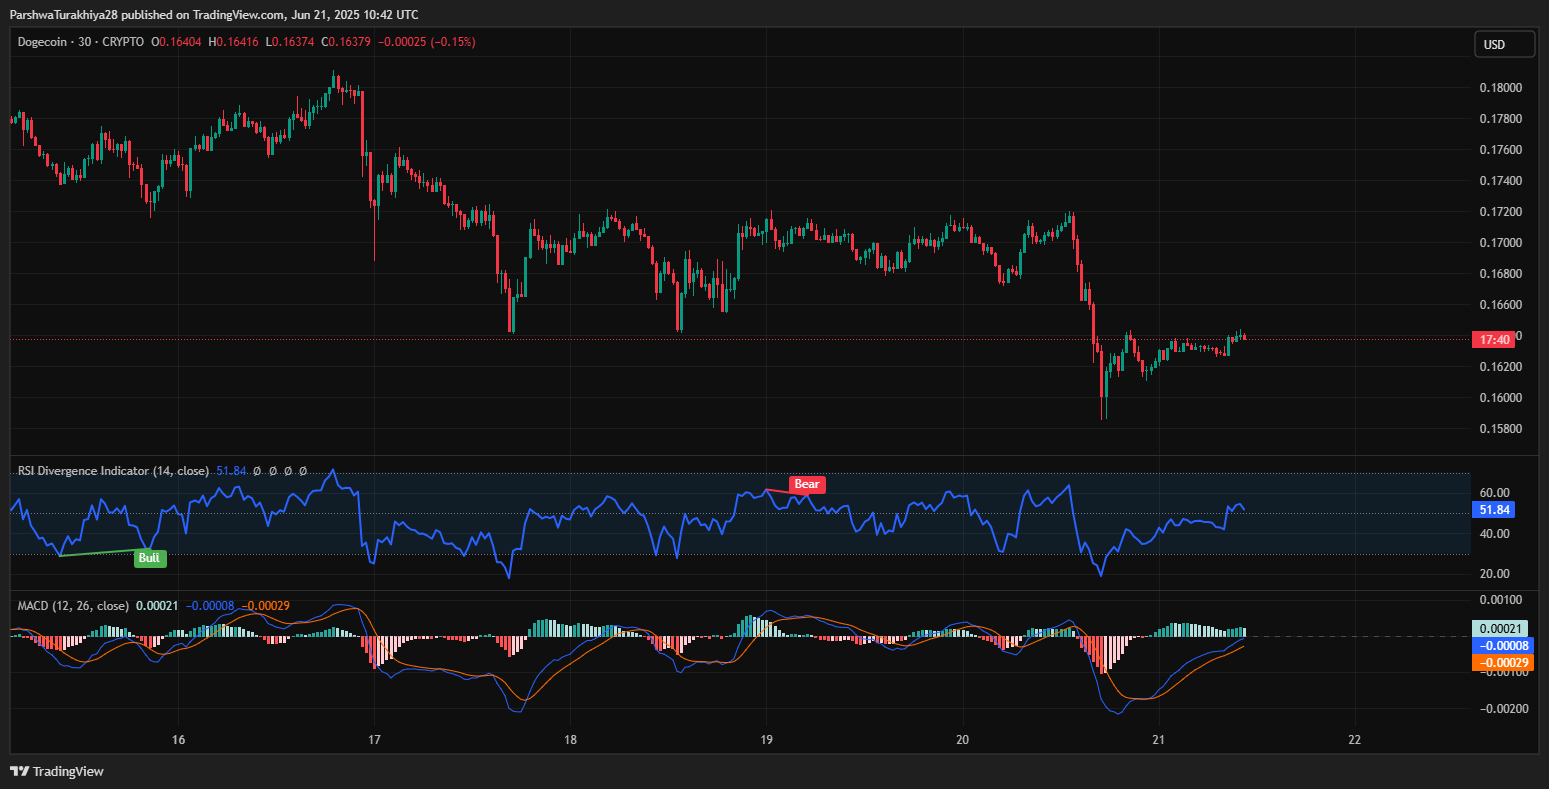
From a momentum perspective, indicators are mixed. On the 30-minute timeframe, the RSI has stabilized near 51.8 following a bullish divergence from the recent bottom. This recovery shows waning bearish momentum in the ultra-short term, but is not yet strong enough to suggest a reversal.
The MACD remains in negative territory but has started to flatten, with histogram bars shifting toward zero. This further supports the consolidation narrative and hints at a potential volatility expansion in either direction.

Meanwhile, Bollinger Bands on the 4-hour chart have tightened, suggesting imminent volatility. Price is currently stuck below the mid-band ($0.1678), with resistance layered above at $0.173 and $0.179 — both aligning with EMA20 and EMA50. For bulls to regain control, DOGE must decisively reclaim these zones with volume and close above $0.175.
Short-Term Outlook: Caution Prevails Below the $0.170 Barrier
Until DOGE clears the descending trendline and confirms a breakout above $0.170, the outlook remains neutral to bearish. The 4-hour EMAs (20/50/100/200) are all sloping downward, reflecting systematic selling. In particular, the EMA50 around $0.173 and EMA100 at $0.179 form a critical resistance cluster that capped price several times this week.
From a structure perspective, the daily chart shows the Dogecoin price has failed to maintain above its key BOS from earlier in May. If bulls fail to hold the $0.160 zone over the weekend, the next support sits near $0.152 followed by $0.145 — levels that coincide with historical buying interest.
On the flip side, if bulls manage to reclaim the $0.170–$0.173 resistance and break above $0.179, it would signal a potential invalidation of the bearish pattern and possibly spark a retest of $0.19–$0.21.
DOGE Price Forecast Table for June 22
| Indicator/Zone | Level (USD) | Signal |
| Resistance 1 | 0.170 | Trendline + recent rejection zone |
| Resistance 2 | 0.179 | EMA100 + BOS retest |
| Support 1 | 0.160 | Key short-term demand zone |
| Support 2 | 0.152 | Next major support |
| RSI (30-min) | 51.84 | Neutral with mild bullish bias |
| MACD (30-min) | Flat | Weakening bearish momentum |
| Bollinger Band Width (4H) | Tightening | Volatility expansion likely |
| Supertrend (4H) | Bearish @ 0.173 | Caution under trend resistance |
| DMI (-DI vs +DI) | 44.8 vs 10.2 | Strong selling pressure |
Disclaimer: The information presented in this article is for informational and educational purposes only. The article does not constitute financial advice or advice of any kind. Coin Edition is not responsible for any losses incurred as a result of the utilization of content, products, or services mentioned. Readers are advised to exercise caution before taking any action related to the company.


