
- Dogecoin falls below multi-week triangle support while the 20/50/100/200-day EMAs flip into overhead resistance.
- Exchange outflows exceed $46M, signaling distribution as liquidity moves back onto exchanges.
- Breakdown targets $0.15, with deeper downside toward $0.13 if the $0.150 demand zone fails.
Dogecoin price today trades near $0.165 as sellers force a decisive breakdown from a multi-week triangle pattern. The move places short-term pressure on buyers as spot outflows accelerate and the EMA cluster flips into a ceiling.
Spot Outflows Rise As Buyers Step Back
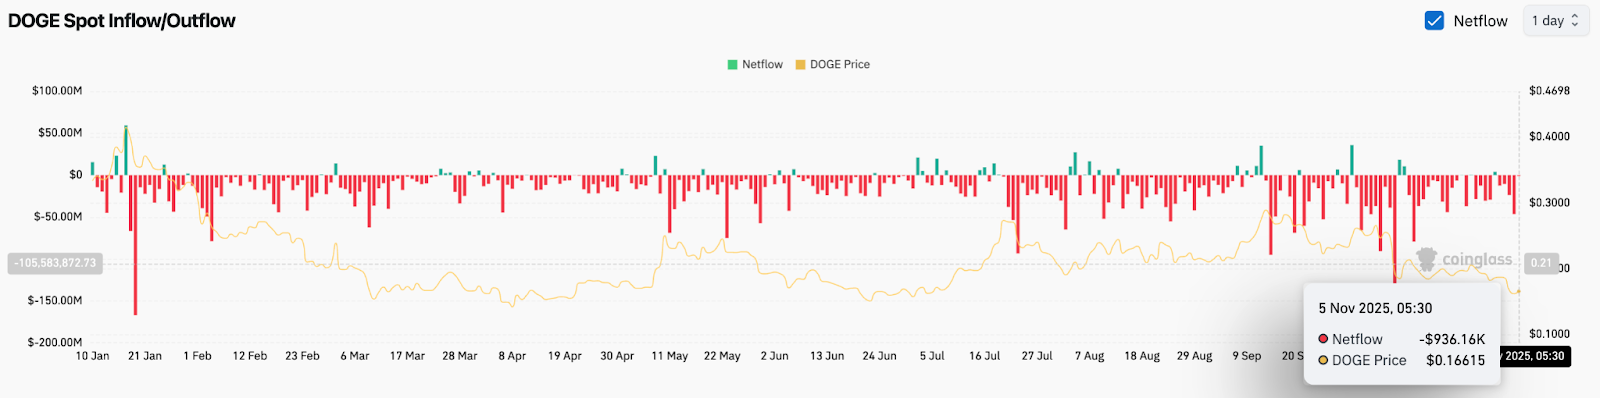
According to Coinglass, Dogecoin recorded nearly $46 million in outflows yesterday, one of the largest single-session distributions in weeks. Today continues the same trend. As of early Wednesday, spot flows show another $936,000 in net outflows, signaling that sellers are still sending DOGE to exchanges instead of holding.
When spot outflows dominate for multiple sessions, it typically reflects distribution rather than accumulation. Market participants are not positioning for upside, and liquidity leaves the ecosystem instead of entering it.
Trendline Break Signals Short Term Weakness
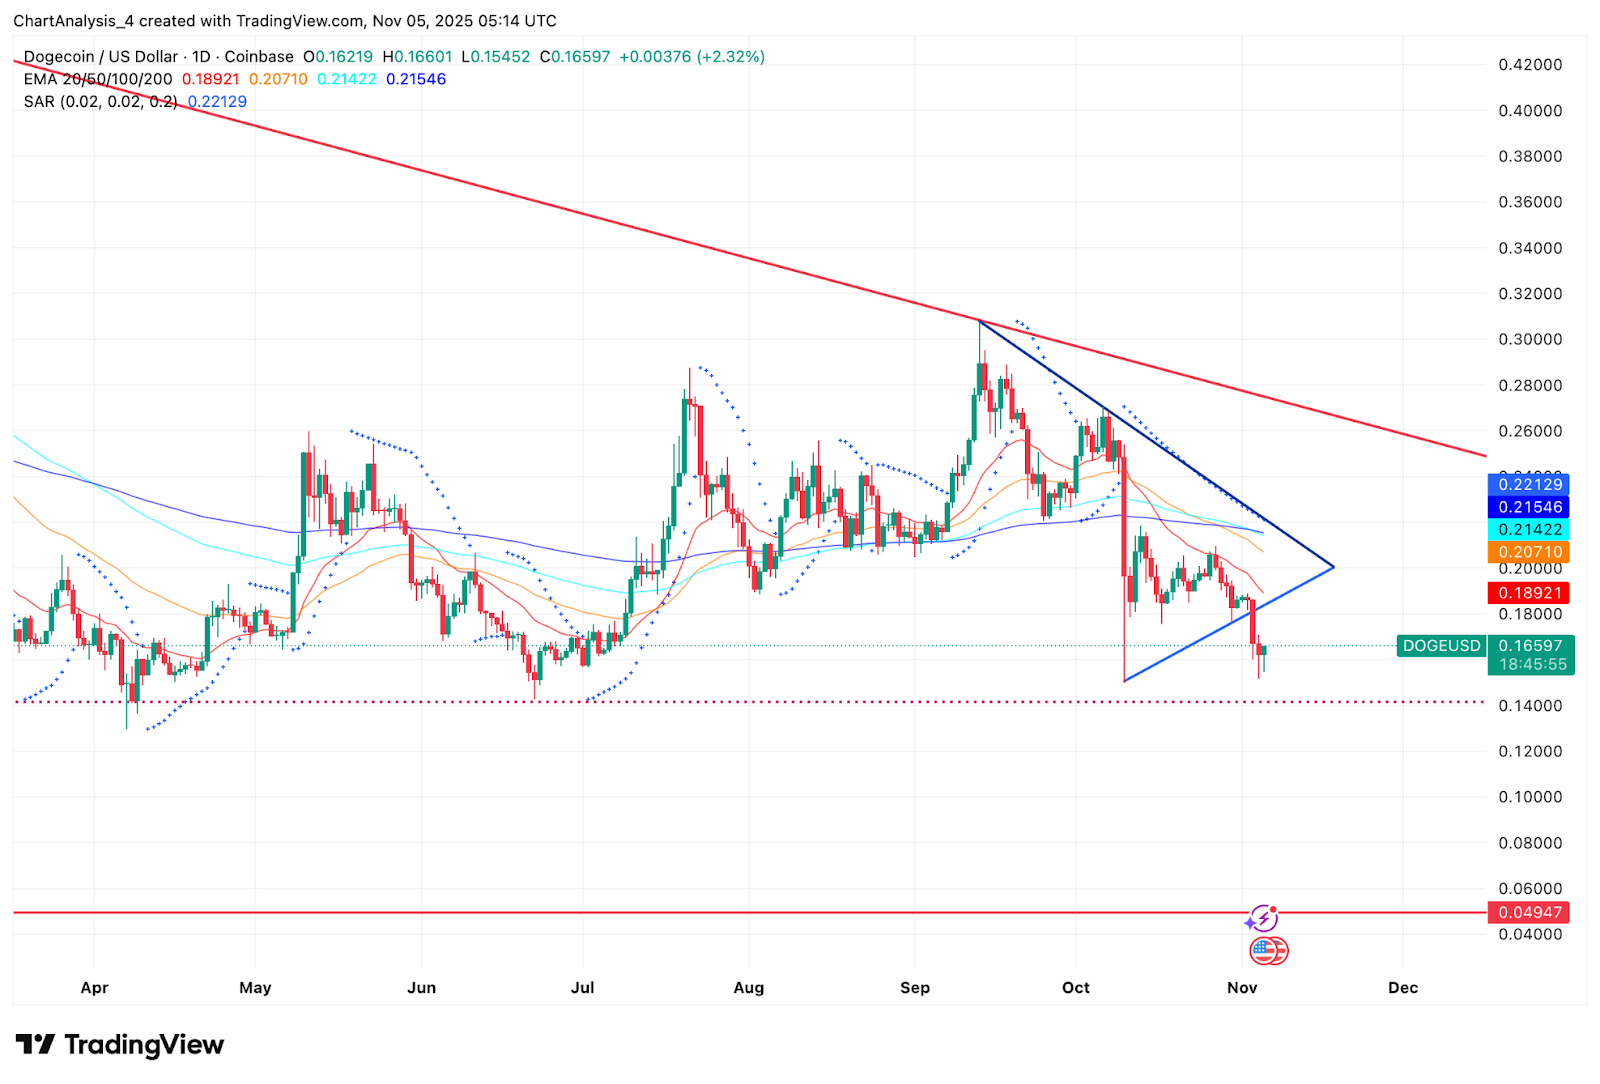
DOGE failed to crack the descending trendline that has capped rallies since September. The rejection pushed the token below the symmetrical triangle support, a level that previously held for nearly three weeks.
With that floor gone, the chart now shows:
- DOGE trading below the 20, 50, 100, and 200-day EMAs
- EMAs stacked downward, forming a resistance ceiling
- Parabolic SAR dots flipping above price, confirming a bearish trend
The 20-day EMA near $0.189 has become the first major resistance. Above it, the 50-day EMA at $0.207 and the 200-day EMA at $0.221 represent the larger reversal barrier.
Buyers must reclaim this EMA cluster to flip momentum back to neutral. Until such a move happens, every bounce remains a relief bounce inside a bearish structure.
Intraday Momentum Shows Attempts To Stabilize
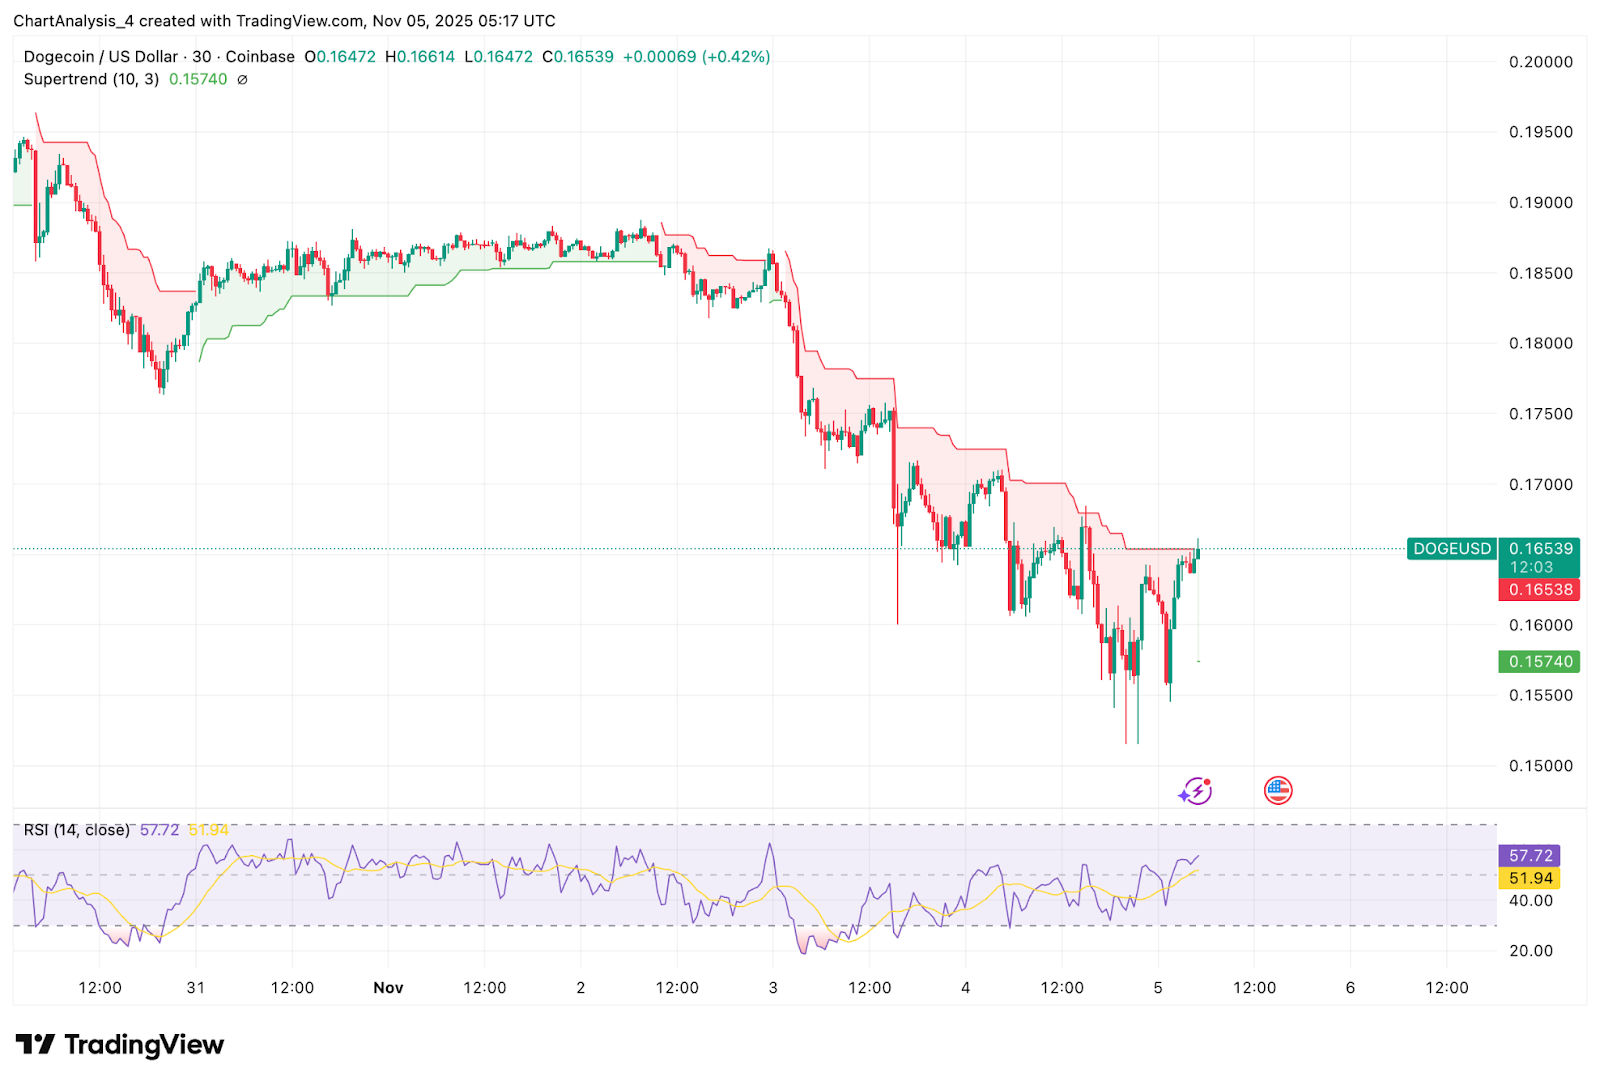
Shorter timeframes show DOGE attempting to defend the $0.160-$0.157 zone.
On the 30-minute chart:
- Supertrend remains red, signaling downside pressure
- RSI has recovered above 50, showing stabilization after oversold conditions
- Price is testing the underside of the Supertrend band
Intraday traders are trying to force a minor recovery, but until DOGE closes above $0.171, the rebound lacks confirmation. That level marks the Supertrend flip zone. A rejection here could trigger another leg down toward $0.150.
The playbook for bulls is simple. A strong close above $0.189 would show that buyers can retake control and invalidate the breakdown. A breakout above $0.207 opens the door to $0.240 and eventually a trend reversal toward the upper trendline near $0.260. Anything below $0.189 keeps the structure bearish.
Outlook. Will Dogecoin Go Up?
The next move depends on how DOGE reacts at $0.157-$0.150, a demand shelf that has historically acted as a springboard.
- Bullish case: DOGE rebounds from $0.157 and closes above $0.189 with rising volume. That flips the Supertrend and signals the first sign of a trend reversal.
- Bearish case: A daily close below $0.150 would confirm a clean breakdown and expose the next liquidity zone near $0.140.
If price reclaims $0.189 and breaks through the EMA cluster, momentum shifts. Losing $0.150 turns the move into a full correction toward $0.130-$0.110.
Disclaimer: The information presented in this article is for informational and educational purposes only. The article does not constitute financial advice or advice of any kind. Coin Edition is not responsible for any losses incurred as a result of the utilization of content, products, or services mentioned. Readers are advised to exercise caution before taking any action related to the company.


 Price Prediction: Canton Eyes Key Break After Market Activity Spike")

