 Nears Breakout: Bulls Eye $3 Resistance")
- Dogwifhat (WIF) nears breakout, recovering 78% after hitting $1 low in August 2024.
- WIF forms a symmetrical triangle, signaling a potential bullish breakout above resistance.
- WIF’s 50-day moving average trends bullish, while 200-day MA poses resistance ahead.
Dogwifhat (WIF) is nearing a critical breakout point as it bounces back from a long downtrend. Using both technical indicators and market analysis, we can see signs of a potential upward price movement.
As of this writing, WIF is priced at $1.88. Over the last 24 hours, it has gained 10.59% and has a total market capitalization of $1.87 billion. Plus, the 24-hour trading volume also jumped by 33.74% to $409.5 million.
The WIF price dropped to a significant low of $1 on August 5, after a period of decline. But then, it recovered, pushing the price up by 78%. Over the past 50 days, WIF has formed a symmetrical triangle pattern, moving sideways and consolidating after testing key support levels.
It is now testing a major descending resistance level, which hints at a possible breakout. Technical analysis suggests that a break above this resistance could mean a shift into a new bullish phase for the cryptocurrency.
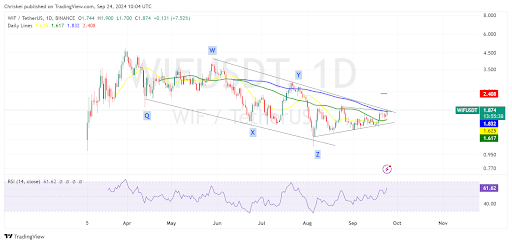
On the daily time frame, WIF has tested the bulls and seems ready to head up. The moving average indicator is rising, with the 50 Day Moving Average line sitting below the current price, which may act as support.
Read also: Promising Altcoins to Watch: WIF, ORDI, SUI, AAVE, and UNI
Meanwhile, the 200-day moving average is above the price, and this could be resistance. The Relative Strength Index levels have hovered around 61, which means that WIF is neither oversold nor overbought.
Past Performance and Potential Breakout
Earlier this year, WIF had a dramatic price surge, rising from $0.20 in February to $4.88 by late March, a nearly 4,000% increase. After peaking, the cryptocurrency’s price fell sharply, forming a descending pattern. By June 24, WIF reached a low of $1.50, finishing an 85-day corrective phase. It later rebounded to almost $3 before another corrective decline. A new low of $1 was reached on August 5, after which the price started recovering.
Read also: Meme Coins Outpace Bitcoin in 2024, Binance Listings Fuel Growth
The recent 50-day consolidation period and symmetrical triangle formation have brought the WIF price to a crucial point. Market experts say that a breakout above its descending resistance line would be a strong sign of a potential bullish phase. If the price stays above its August 5 low, WIF could see more gains. However, if it cannot hold this support, it could drop towards the $0.80 range.
WIF is still trading just below its long-term resistance line, with market analysts closely watching upcoming price action. Any confirmed breakout above this level could reignite interest and drive further upward movement.
Disclaimer: The information presented in this article is for informational and educational purposes only. The article does not constitute financial advice or advice of any kind. Coin Edition is not responsible for any losses incurred as a result of the utilization of content, products, or services mentioned. Readers are advised to exercise caution before taking any action related to the company.

 Price Prediction: Can Bulls Reclaim the 0.236 Level?")

 Price Prediction: Can Bulls Break the $329 Barrier?")
