 DYDX Price Prediction 2024-2030: Will DYDX Continue Its Bullish Momentum?")
dYdX (Native) DYDX has garnered significant attention in the crypto market, sparking discussions among investors and analysts alike. With its ongoing developments and strategic advancements, dYdX is positioning itself as a strong contender within the decentralized finance (DeFi) sector, despite facing a highly competitive landscape.
These developments have led to notable fluctuations in its price, with both bulls and bears watching closely. Despite the challenges, dYdX has maintained its position among the top cryptocurrencies, currently ranked #80 on CoinMarketCap, highlighting its resilience and potential.
As the DeFi space evolves and new integrations occur, the future of dYdX remains a topic of great interest. Will it solidify its position as a leader in decentralized trading or face volatility in the coming years? Read on for our dYdX price prediction to explore the potential paths this token might follow.
Table of contents
- dYdX (Native) DYDX Real-Time Market Status
- What is dYdX (DYDX)?
- dYdX (Native) DYDX Current Market Status
- dYdX (Native) DYDX Price Prediction 2024-2030 Overview
- dYdX (Native) DYDX Price Prediction/Analysis
- dYdX (Native) Price Prediction 2024
- dYdX (Native) Price Prediction 2025
- dYdX (Native) Price Prediction 2026
- dYdX (Native) Price Prediction 2027
- dYdX (Native) Price Prediction 2028
- dYdX (Native) Price Prediction 2029
- dYdX (Native) Price Prediction 2030
- FAQs
dYdX (Native) DYDX Real-Time Market Status
| 🪙 Name | dYdX |
| 💱 Symbol | DYDX |
| 🏅 Rank | #200 |
| 💲 Price | $0.1011431898201 |
| 📊 Price Change (1h) | -1.18 % |
| 📊 Price Change (24h) | 7.5 % |
| 📊 Price Change (7d) | -0.68 % |
| 💵 Market Cap | $84469286.793267 |
| 💸 Circulating Supply | 835145568.80703 DYDX |
| 💰 Total Supply | 958342962.31793 DYDX |
dYdX (DYDX) is currently trading at $0.1011431898201 and sits at number #200 on CoinMarketCap in terms of market capitalization. There are 835145568.80703 DYDX coins currently in circulation, bringing the total market cap to $84469286.793267.
Over the past 24 hours, dYdX has increased by 7.5%. Looking at the last week, the coin is down by 0.68%.
What is dYdX (DYDX)?
dYdX is the native token of the dYdX Chain, a decentralized trading platform that offers various financial instruments including perpetual contracts, margin trading, and spot trading. The platform is fully decentralized and governed by the community, with DYDX serving as the governance token. It can be staked to secure the network, with 100% of protocol fees distributed to stakers. dYdX has also been undergoing a migration process to the dYdX Chain, further enhancing its ecosystem.
dYdX (Native) DYDX Current Market Status
In recent weeks, dYdX has shown a steady upward trend, with its price moving from a low of $1.07 to its current price of $1.13. The token has seen a positive change of 4.69% in the last 24 hours, reflecting growing investor confidence.
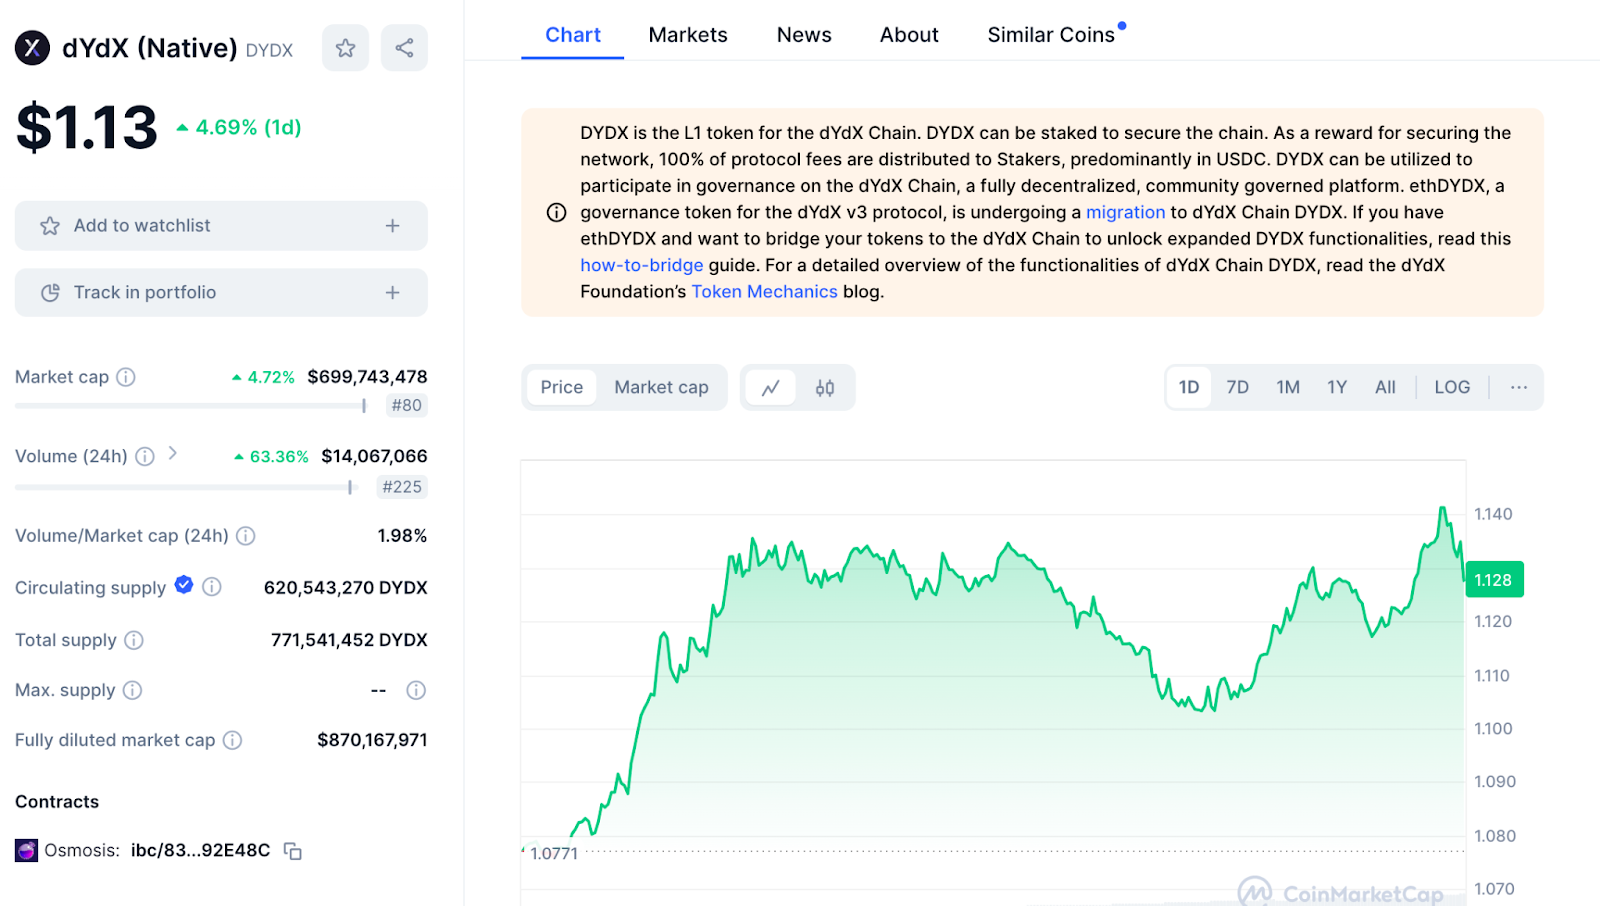
Snap | Source: CoinMarketCap
The market cap for dYdX now stands at $699,743,478, with a total supply of 771,541,452 DYDX. The trading volume has seen a significant increase, with a 63.36% rise in the last 24 hours alone. This surge indicates heightened activity and interest in dYdX as it continues to expand its decentralized trading platform.
dYdX (Native) DYDX Price Prediction 2024-2030 Overview
| Year | Potential Low ($) | Potential High ($) |
| 2024 | $1.50 | $2.20 |
| 2025 | $1.80 | $2.50 |
| 2026 | $2.20 | $3.00 |
| 2027 | $2.50 | $3.50 |
| 2028 | $3.00 | $4.00 |
| 2029 | $3.50 | $4.50 |
| 2030 | $4.00 | $5.00 |
dYdX (Native) DYDX Price Prediction/Analysis
dYdX’s recent price movements have captured the attention of traders and analysts, stirring curiosity about its future trajectory. Our analysis delves into the potential paths DYDX might take as it navigates through the volatile crypto market.
dYdX (Native) Price Prediction: Will DYDX Fall Again?
Looking at an in-depth analysis, we see that the trading pair on a 4-hour timeframe, displaying a Rising Wedge pattern. Here is the technical analysis. This indicates that the upward momentum is weakening as the price compresses into a tighter range. The recent price action shows a series of higher highs and higher lows, typical of this pattern, but the narrowing range suggests weakening bullish momentum.
Looking at other indicators, we see that the Money Flow Index (MFI) is at 65.96, indicating that the market is neither overbought nor oversold, though it is closer to the overbought region. This could suggest a potential reversal if the price fails to break above the wedge’s upper boundary. If the price breaks below the lower trendline of the wedge, it would confirm the bearish signal. The target price in such a scenario is marked around the 0.850 USDT level, which aligns with the measured move projection based on the height of the wedge at the beginning of the pattern.
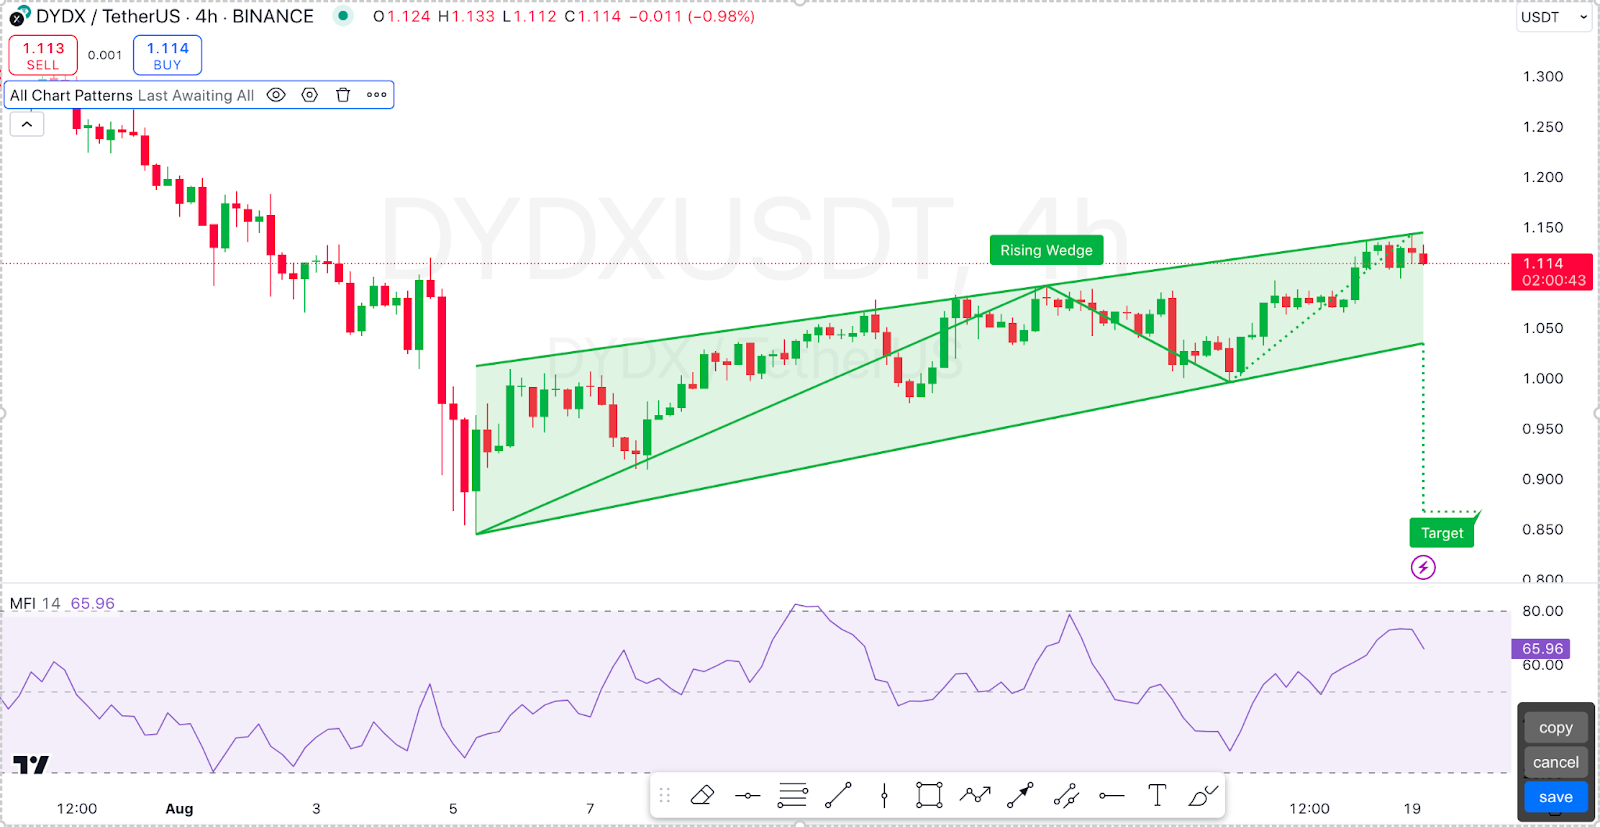
Should the price break above the upper trendline of the wedge, this would invalidate the bearish pattern and could lead to a continuation of the upward trend, although this scenario is less likely based on the pattern’s characteristics. The rising wedge pattern, coupled with the MFI nearing overbought levels, suggests that a breakdown is more probable. Traders should watch for a confirmation of this pattern with a break below the lower trendline, which would trigger the target around 0.850 USDT. However, if the price manages to break above the wedge, it could signal further upside potential, though with a lower probability.
dYdX (Native) Price Prediction: Moving Averages
Looking at other indicators, we see that the Alligator indicator consists of three smoothed moving averages: the Jaw (blue), the Teeth (red), and the Lips (green). It is used to identify trends and potential reversals. The three lines are diverging, with the Jaw (blue) at the bottom, Teeth (red) in the middle, and Lips (green) at the top. This suggests that the Alligator is “eating,” indicating a bullish trend.The Lips (green) and Teeth (red) are sli ghtly converging, which could be a signal that the trend is weakening and might be approaching a rest or reversal phase. This often happens when the lines start to cross each other, signaling that the Alligator is “sleeping” and the trend may be reversing or pausing.
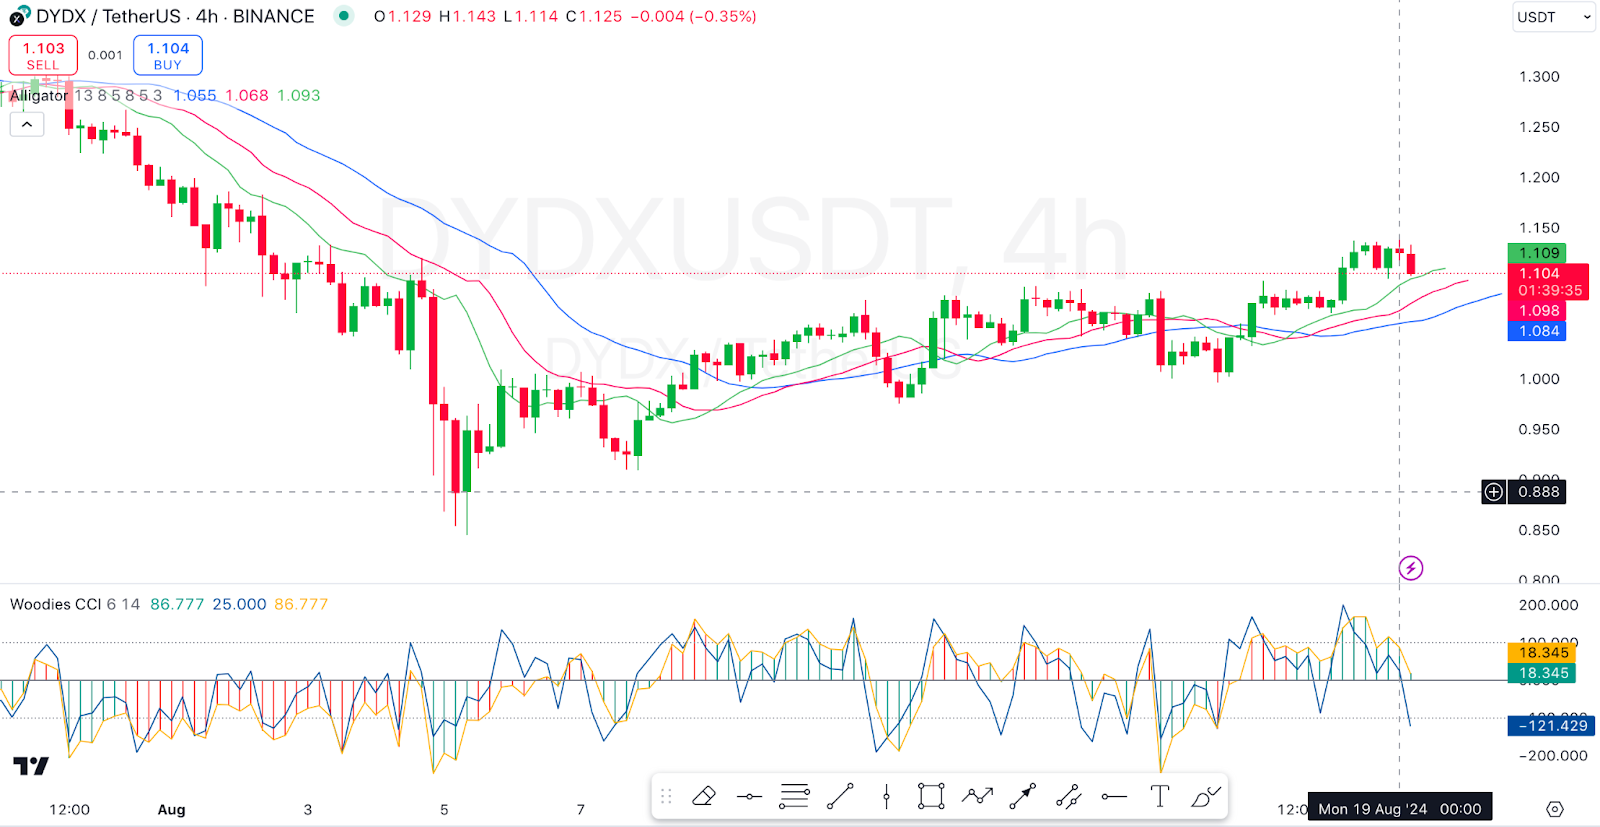
On the other hand, we see that the Woodies Commodity Channel Index (CCI) is a momentum-based indicator that helps identify trend changes. A CCI value above 100 is typically considered bullish, while below -100 is bearish. The CCI is currently around 86.777, close to the 100 level but not crossing it. This suggests that bullish momentum is present but is not strong enough to push into a definitive overbought zone. There are some fluctuations indicating short-term volatility, but the general trend direction seems uncertain, with the CCI not providing a strong overbought or oversold signal.
dYdX (Native) Price Prediction: Bollinger Bands
On the other hand, we see that the Bollinger Bands consist of a middle band (usually a 20-period simple moving average) and two outer bands that are typically set two standard deviations away from the middle band. The bands expand and contract based on market volatility. The price is currently touching the upper Bollinger Band, which suggests that DYDX/USDT is in an overbought condition.
This often precedes a pullback or correction, especially if the price struggles to break above this upper band. The bands have widened recently, indicating increased volatility. This often signals that the market may experience a continuation in the current trend, but since the price is at the upper band, there might be a consolidation or pullback before any further upward movement.
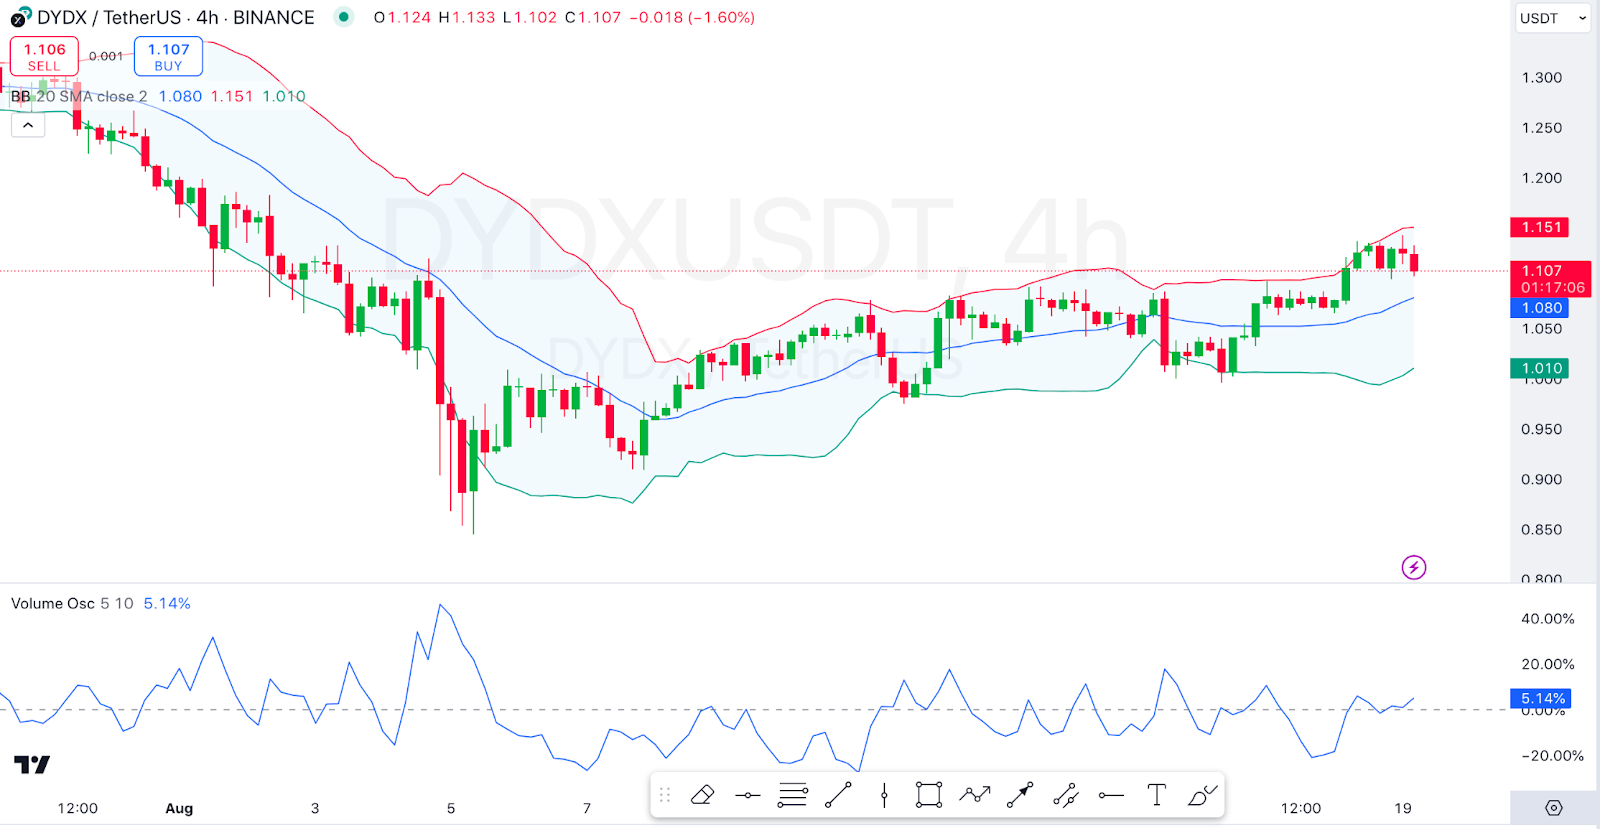
On the other hand, we see that the Volume Oscillator measures the difference between two moving averages of volume, often used to identify the strength of a price movement based on trading volume. The Volume Oscillator is at 5.14%, which indicates that the volume is relatively stable but not excessively high. This suggests that the recent price movements may not be strongly supported by significant changes in volume. The lack of strong volume may indicate that the current trend, whether up or down, might not have substantial momentum behind it, potentially leading to a consolidation period or a weak continuation of the trend.
dYdX (Native) Price Prediction 2024
In 2024, DYDX is expected to continue its bullish trajectory, driven by growing adoption and enhancements to the dYdX platform. The token could potentially reach the $2.20 mark, representing a significant increase from its current levels. This growth will likely be supported by increasing interest in decentralized finance (DeFi) and the expansion of dYdX’s user base. Key support at $1.50 will be crucial in maintaining this upward momentum, with resistance around $2.50 as a potential barrier to further gains.
dYdX (Native) Price Prediction 2025
By 2025, DYDX may experience consolidation as the market evaluates the token’s progress and the broader DeFi landscape. While growth could slow compared to 2024, the token might still push toward the $3.00 resistance level, especially if dYdX continues to innovate and capture a larger share of the DeFi market. Support around $2.00 will be essential in preventing a more significant pullback, with the $2.50 level acting as an important area of resistance.
dYdX (Native) Price Prediction 2026
In 2026, assuming the DeFi market continues to expand and dYdX remains at the forefront of decentralized trading, DYDX could break through the $3.00 resistance level. The token might see increased volatility as it navigates between $2.50 support and the next major resistance at $3.50. If market conditions remain favorable, DYDX could establish a new trading range between $3.00 and $4.00.
dYdX (Native) Price Prediction 2027
By 2027, DYDX could benefit from broader crypto market growth and a more mature DeFi ecosystem. The token might target the $4.00 mark, with the potential to reach as high as $4.50 if positive market sentiment persists. The $3.50 level could become a new area of support, with $4.50 acting as the next significant resistance. However, any market downturns could see the price retreat to the $3.00-$3.50 range.
dYdX (Native) Price Prediction 2028
In 2028, DYDX may experience steady gains as it builds on the momentum from previous years. The token could approach the $4.50-$5.00 range, with support likely firming up around $4.00. If dYdX continues to innovate and maintain its competitive edge in the DeFi space, it might see less resistance to reaching the $5.00 target. However, macroeconomic factors and market sentiment will still play a critical role in its trajectory.
dYdX (Native) Price Prediction 2029
As 2029 approaches, DYDX could solidify its position as a leading token in the DeFi space. The $5.00 resistance level might be tested, with the potential for DYDX to trade above this level if the platform achieves significant milestones. Support at $4.50 will be critical to sustaining any gains above $5.00. Market conditions and technological advancements within dYdX will likely dictate whether the token can maintain or exceed this level.
dYdX (Native) Price Prediction 2030
By 2030, DYDX could see substantial growth, potentially surpassing the $5.00 mark and targeting higher levels depending on the overall crypto market environment and continued success in the DeFi sector. With $5.00 as a key psychological barrier, breaking through could open the door to new highs, possibly in the $5.50-$6.00 range. However, as the token reaches these levels, it might face increased resistance, and the $5.00 level would become a critical support in maintaining long-term gains.
FAQs
dYdX is the native token of the dYdX Chain, a decentralized trading platform offering various financial instruments such as perpetual contracts, margin trading, and spot trading.
As of the latest update, DYDX is trading at $1.13 and holds the #80 spot on CoinMarketCap with a market capitalization of $699,743,478.
2024: $1.50 – $2.20
2025: $1.80 – $2.50
2026: $2.20 – $3.00
2027: $2.50 – $3.50
2028: $3.00 – $4.00
2029: $3.50 – $4.50
2030: $4.00 – $5.00
The outlook for DYDX suggests continued bullish momentum, driven by ongoing developments, growing adoption of the dYdX platform, and the expansion of the DeFi sector.
Several technical indicators, including the Rising Wedge pattern, Money Flow Index (MFI), Alligator Indicator, Woodies Commodity Channel Index (CCI), and Bollinger Bands, are influencing DYDX’s price.
Key support levels to watch are $1.50, $2.00, $2.50, $3.00, $3.50, and $4.00, depending on the year. Resistance levels include $2.50, $3.00, $3.50, $4.50, and $5.00.
The future of the DeFi space plays a significant role in DYDX’s price prediction.
Disclaimer: The information presented in this article is for informational and educational purposes only. The article does not constitute financial advice or advice of any kind. Coin Edition is not responsible for any losses incurred as a result of the utilization of content, products, or services mentioned. Readers are advised to exercise caution before taking any action related to the company.
 Price Prediction: Can Bulls Break the $329 Barrier?")


 Price Prediction: Can Bulls Sustain Above $2,100?")