
- Ethereum’s falling wedge pattern suggests a bullish breakout if resistance breaks.
- ETH’s RSI nears oversold levels, but bearish MACD signals continued weakness.
- Liquidation spikes above $330M highlight the risks of leveraged ETH trading.
Ethereum (ETH) is giving investors a serious case of whiplash. After a 13.40% drop in the past week, and with the trading volume in the last 24 hours standing at $17.64 billion, the market is clearly on edge.
Analysts are watching price patterns, technical indicators, and liquidation trends to figure out Ethereum’s next potential move. By the way, ETH trades at $1,893.17 as of press time.
Mixed Signals: Falling Wedge vs. Bearish Outlook
According to Daan Crypto Trades, Ethereum has been consolidating following a substantial market downturn. He points to a falling wedge pattern as a possible sign of a trend reversal.
This technical structure is typically considered bullish, suggesting that if ETH can break above the resistance zone, a price recovery could be imminent. For this to happen, ETH must break and hold above a key resistance zone before even thinking about a move towards the $2,000+ region.
The ETH/BTC ratio remains near multi-year lows, despite showing slight resilience. This bounce alone isn’t strong enough to confirm a trend reversal. Sustained strength and a break of key resistance levels are necessary for a significant shift in momentum.
Related: Ethereum Retraces to $1612.81 Support After Short-Lived Spike
Conflicting Views: $800 on the Table?
Adding to the uncertainty, Ali Martinez offers a bearish perspective, highlighting that Ethereum is breaking out, but if momentum falters, ETH could see a move down toward $800.
Leverage and Liquidations: A Recipe for Volatility
The Ethereum Total Liquidations Chart highlights the impact of leverage trading on price movements. Significant liquidation spikes occur around crucial price zones between $2,000 and $3,000. When ETH prices surge, long liquidations increase, whereas price declines trigger short liquidations.
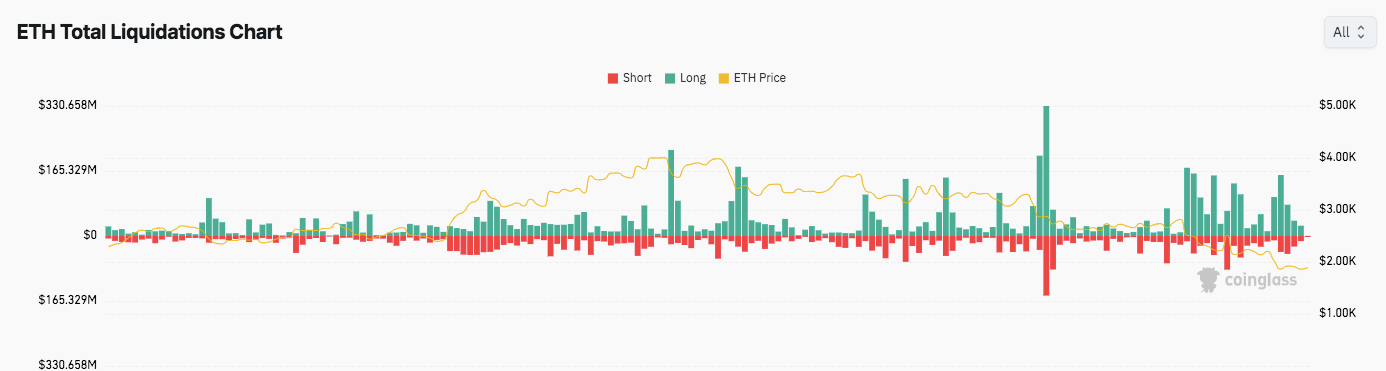
The highest liquidation levels surpass $330 million, revealing aggressive leveraged positions getting wiped out. A large long liquidation spike coincided with a sharp price drop, reinforcing the high-risk nature of leveraged trading. In other words, high leverage can lead to massive losses – fast.
Technical Indicators: RSI and MACD Analysis
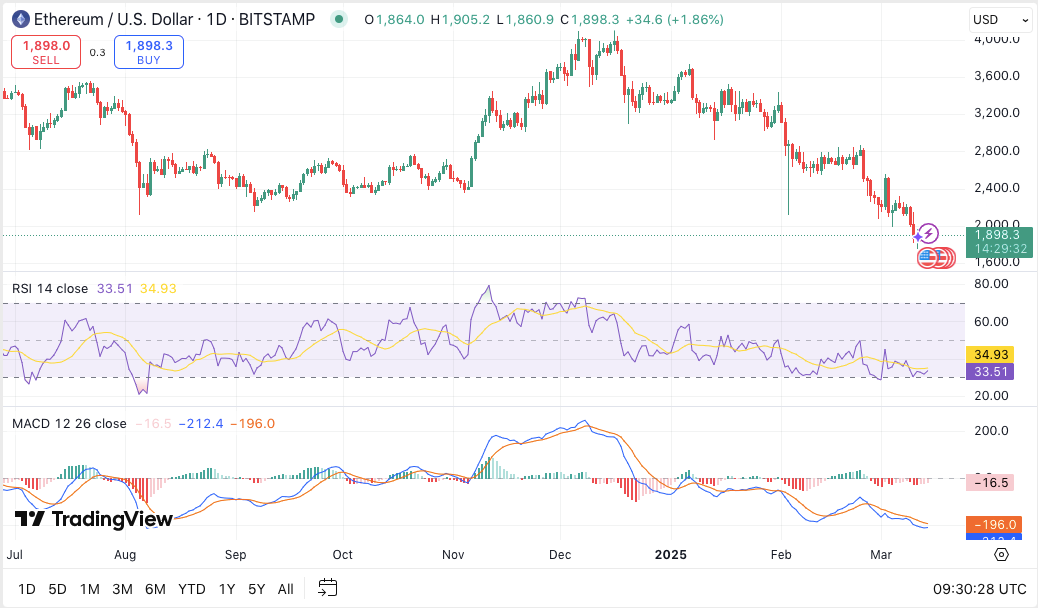
From a technical standpoint, ETH’s Relative Strength Index (RSI) is around 33.29, nearing oversold territory. An RSI below 30 typically signals that an asset is undervalued, potentially setting the stage for a price rebound.
Related: Ethereum Mining Alternative Ravencoin Surges Almost 70% In 1 Week
However, the MACD remains negative, with both the MACD line and signal line below zero. This confirms bearish momentum, but a crossover could indicate a trend reversal. So, the RSI hints at a possible bounce, but the MACD is still flashing warning signs.
Disclaimer: The information presented in this article is for informational and educational purposes only. The article does not constitute financial advice or advice of any kind. Coin Edition is not responsible for any losses incurred as a result of the utilization of content, products, or services mentioned. Readers are advised to exercise caution before taking any action related to the company.


