
- ETH has outperformed BTC, gaining 7.12% while BTC gained 1.83%, driven by strong on-chain metrics.
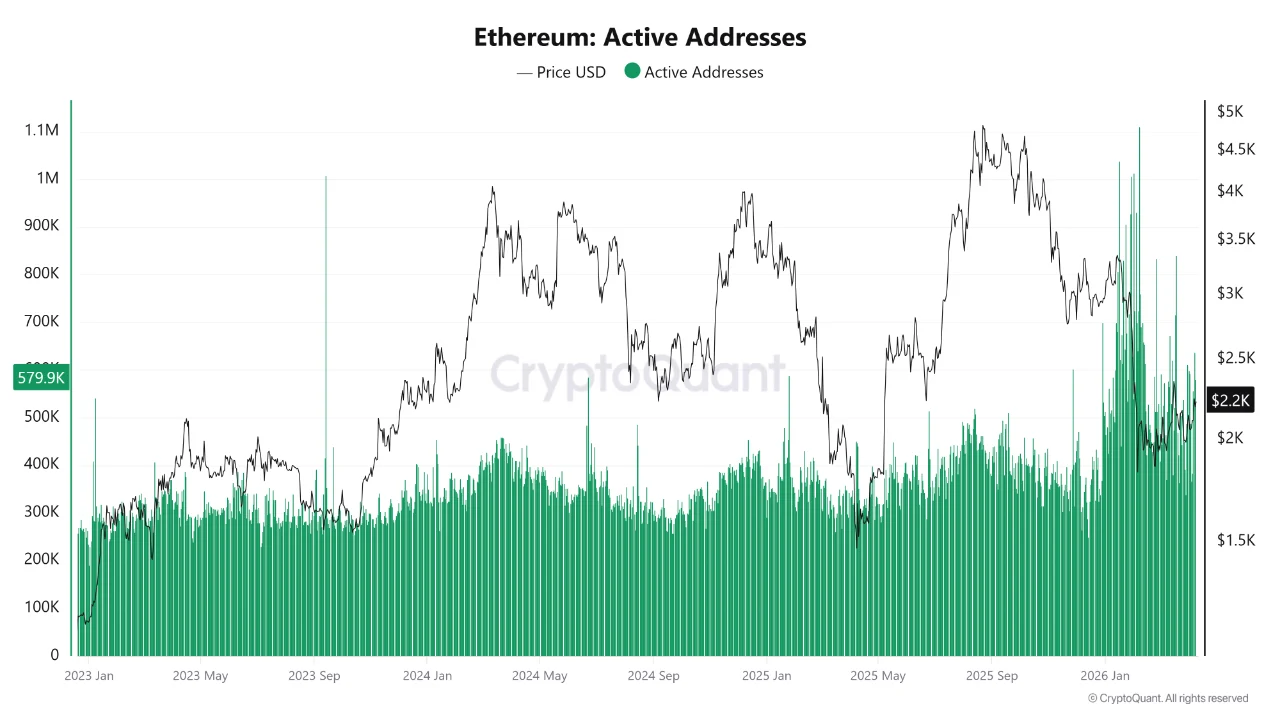
- Ethereum’s 7-day SMA transfers hit a new ATH above 1.3M, driven by increased DeFi and Layer 2 adoption.
- This sustained Ethereum network utility suggests the ETH price could soon catch up to its strong fundamentals.
On April 10, 2026, CryptoQuant published two QuickTakes showing that Ethereum (ETH) outperformed Bitcoin (BTC) in March, with ETH surging by 7.12% while BTC gained only 1.83%. Ethereum’s network activity also hit a new all-time high above 1.3 million transfers. This surge is driven by DeFi expansion and Layer 2 scaling, which has fueled record on-chain utility for ETH.
ETH Outperforms BTC to Reach New ATH
ETH outperformed BTC in March 2026, gaining 7.12% while BTC gained 1.83%. ETH market capitalization increased by 2.97%, while BTC market capitalization declined by 0.43%. This decisive capital rotation has positioned ETH as the leading major asset and set the stage for further upside.
Source: CryptoQuant
ETH’s outperformance reflects its higher beta profile. Realized volatility for ETH reached 62.8%, compared to BTC’s 49.8%, with a 0.94 correlation, allowing ETH to capture risk-on flows more efficiently. On-chain signals supporting the move included continued exchange outflows that tightened supply and rising active addresses, indicating real user growth.
ETH’s 7-day SMA Total Transfers Drive the Surge
Ethereum’s 7-day SMA of total transfer count surged past 1.3M in early April 2026, reclaiming its all-time high first set in mid-February. This marks the highest level of on-chain activity in ETH’s history. While the total transfer count hit a new ATH, ETH’s price is consolidating around $2,100, remaining below its historical highs.
Furthermore, DeFi protocols, Layer 2 scaling solutions, and smart contract executions fueled the increase as more users actively interacted with the ETH blockchain rather than simply holding ETH. Therefore, higher transfer volumes have directly boosted gas consumption, accelerated ETH burning under the EIP-1559 fee mechanism, and created deflationary pressure on supply.
What’s Next for ETH Price and Market Positioning?
Ethereum now sits at a classic inflection point where price lags fundamentals. According to CoinCodex, ETH is forecast to reach $2,614.81 in one month, $4,093.80 in three months, and $ 2,706.87 by the end of 2026, representing a 20.80% gain from current levels. CryptoOnchain states that, “If this strong utility trend persists, the probability of the price eventually catching up with these robust on-chain fundamentals in the mid-term remains highly favorable.”
Meanwhile, as of April 11, 2026, ETH trades at $2,239.37 with a Market cap of $270.2B, while BTC trades at $72,624.24 with a market cap of $1.45T, according to CoinMarketCap data. ETH is poised for a clear price catch-up phase as its record on-chain momentum resolves the current bullish divergence. This divergence could accelerate capital rotation away from BTC toward ETH’s expanding ecosystem.
Continued capital rotation could widen ETH’s performance gap relative to BTC, enabling ETH to deliver outsized returns while BTC remains tied to its store-of-value role. Institutional inflows are likely to accelerate, further strengthening Ethereum’s market dominance.
Related: Harvard Trims Its Bitcoin Position to Buy Ethereum: Here is Why
Disclaimer: The information presented in this article is for informational and educational purposes only. The article does not constitute financial advice or advice of any kind. Coin Edition is not responsible for any losses incurred as a result of the utilization of content, products, or services mentioned. Readers are advised to exercise caution before taking any action related to the company.


