 Price Prediction for July 20, 2025: ETC Breaks Out Toward $25 After Bullish Cup and Handle")
Ethereum Classic price today surged to $24.34, posting its strongest daily gain since late 2023 and breaking out of a multi-month cup and handle formation. With a sharp 32% weekly rally, ETC has flipped multiple resistance levels into support and is now challenging the key $24.50–$25.00 area. The breakout has caught market attention, pushing ETC into fresh territory after months of consolidation below $20.
What’s Happening With Ethereum Classic’s Price?
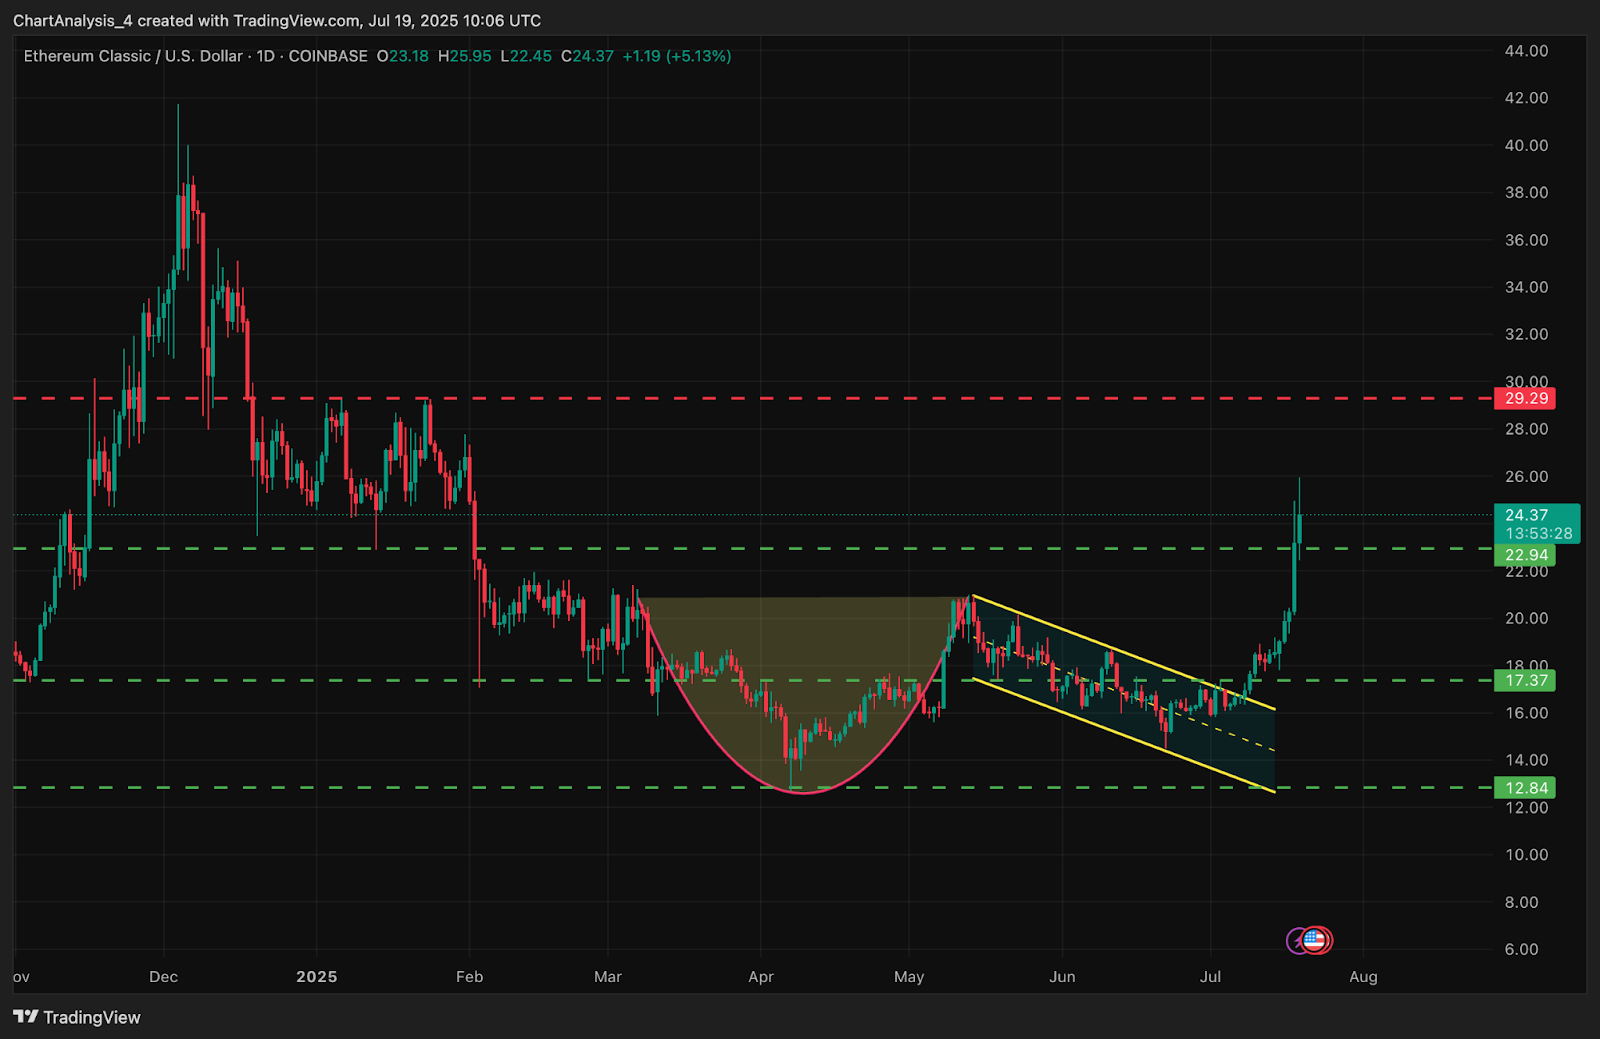
ETC broke out from a descending handle structure that had capped price action throughout June. This breakout confirms a textbook bullish cup and handle formation, with the neckline around $18. The move sent ETC from $16 to $25 in less than five sessions, supported by strong bullish candles and expanding volume.
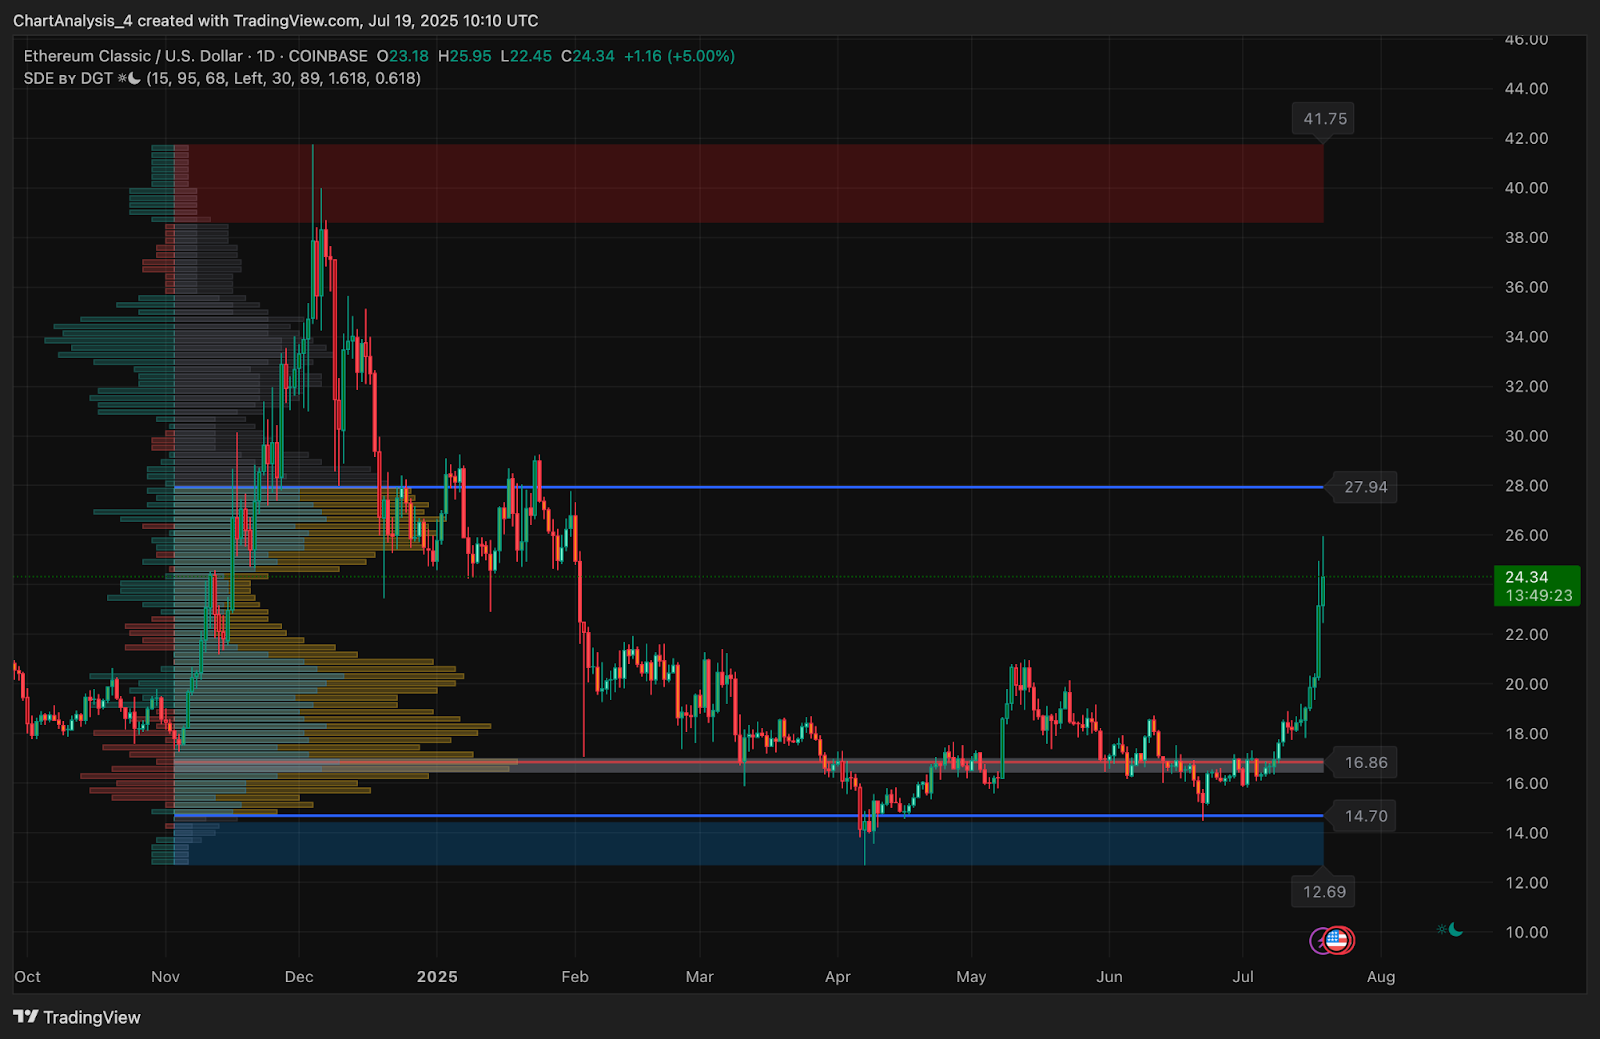
The breakout also came after price reclaimed the $17.37 structure and cleared horizontal resistance at $22.94. Volume Profile analysis shows ETC moving past the high-volume node near $16.86 with little resistance above until $27.94, a prior supply area.
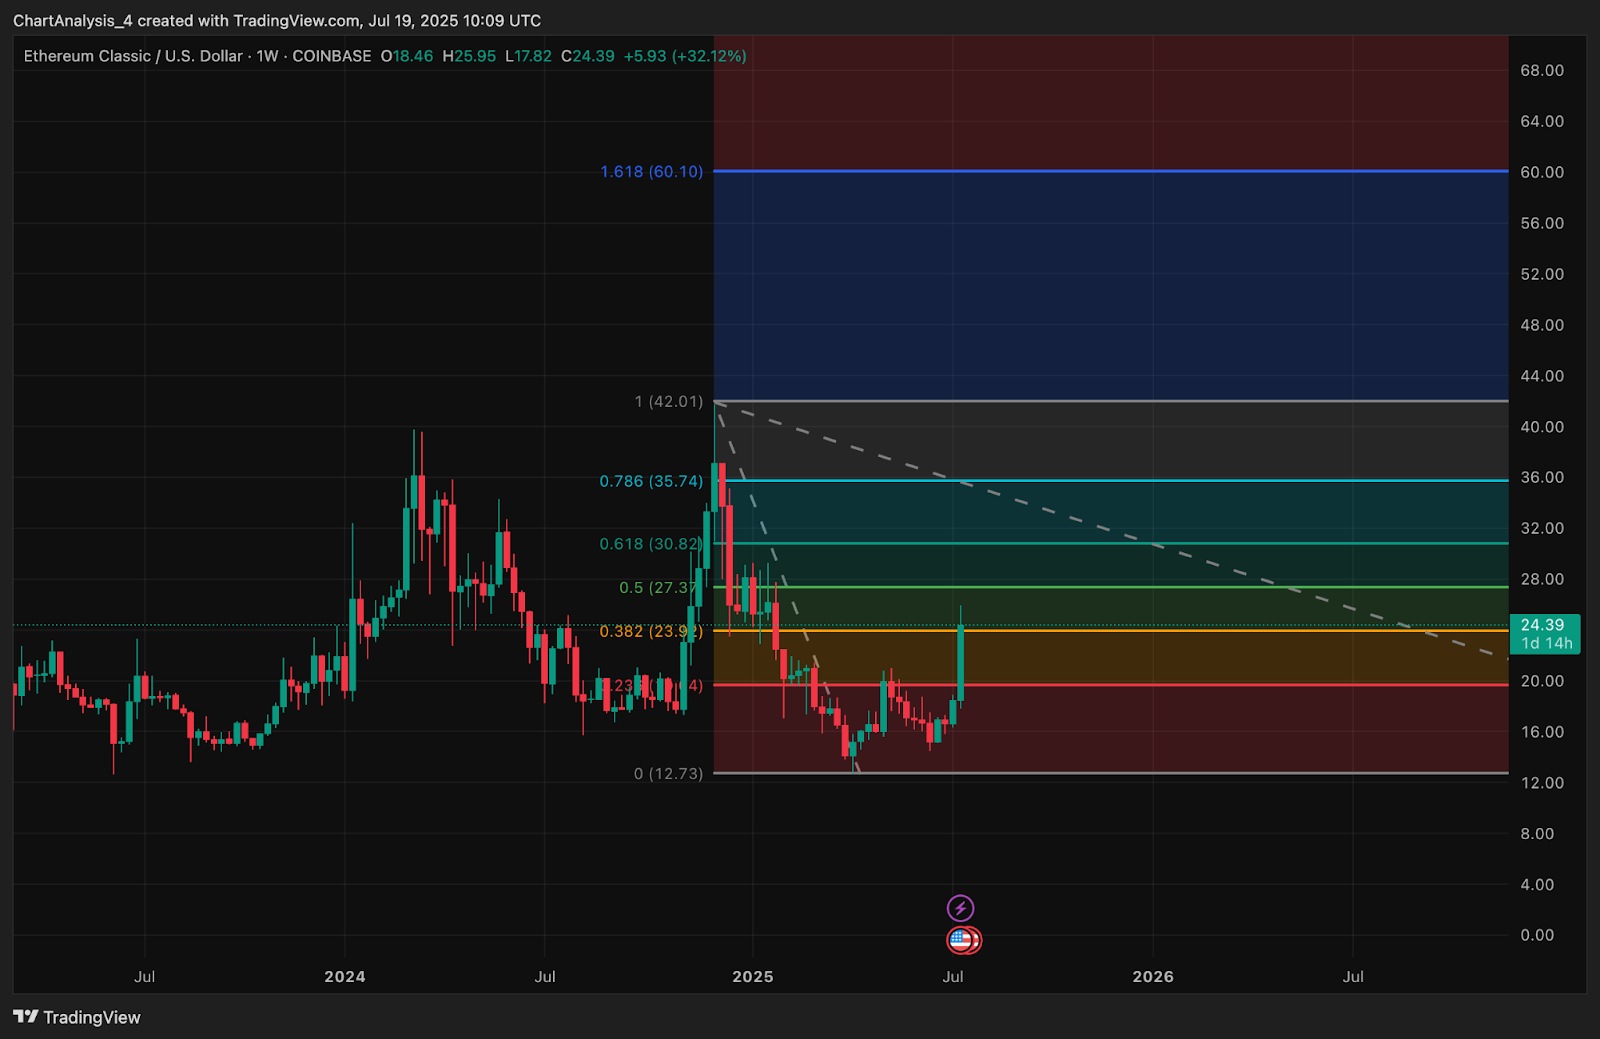
ETC also broke through the 0.382 Fibonacci level on the weekly chart, with the next Fib target at $27.31 and the 0.618 retracement near $30.82. Momentum is now building on both the daily and weekly timeframes.
Why Is The Ethereum Classic Price Going Up Today?
Why Ethereum Classic price going up today is closely tied to a confluence of technical, liquidity, and capital flow factors. The confirmed breakout from the cup and handle pattern sparked aggressive buying pressure. This pattern had been forming since March, with accumulation seen near the $13–$15 region.
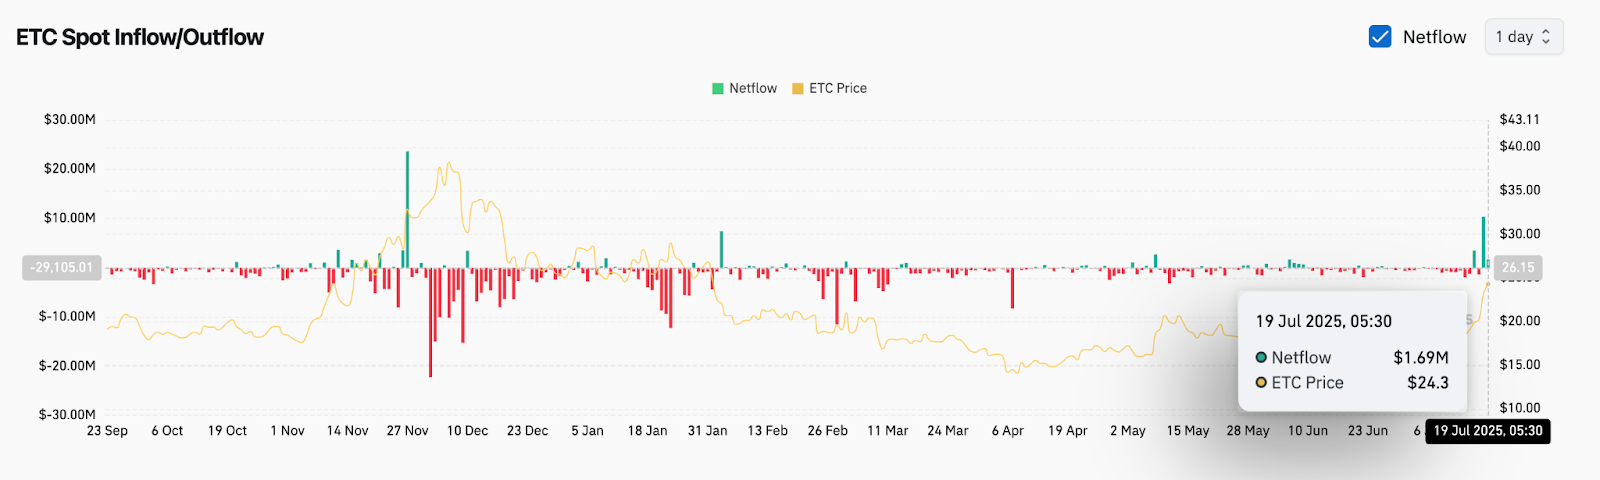
Spot capital flows further confirm buyer dominance. According to on-chain data, ETC saw a $1.69 million net inflow on July 19 — the highest daily positive flow in over four months. The net inflow spike reflects renewed investor appetite, especially after months of outflows and flat activity.
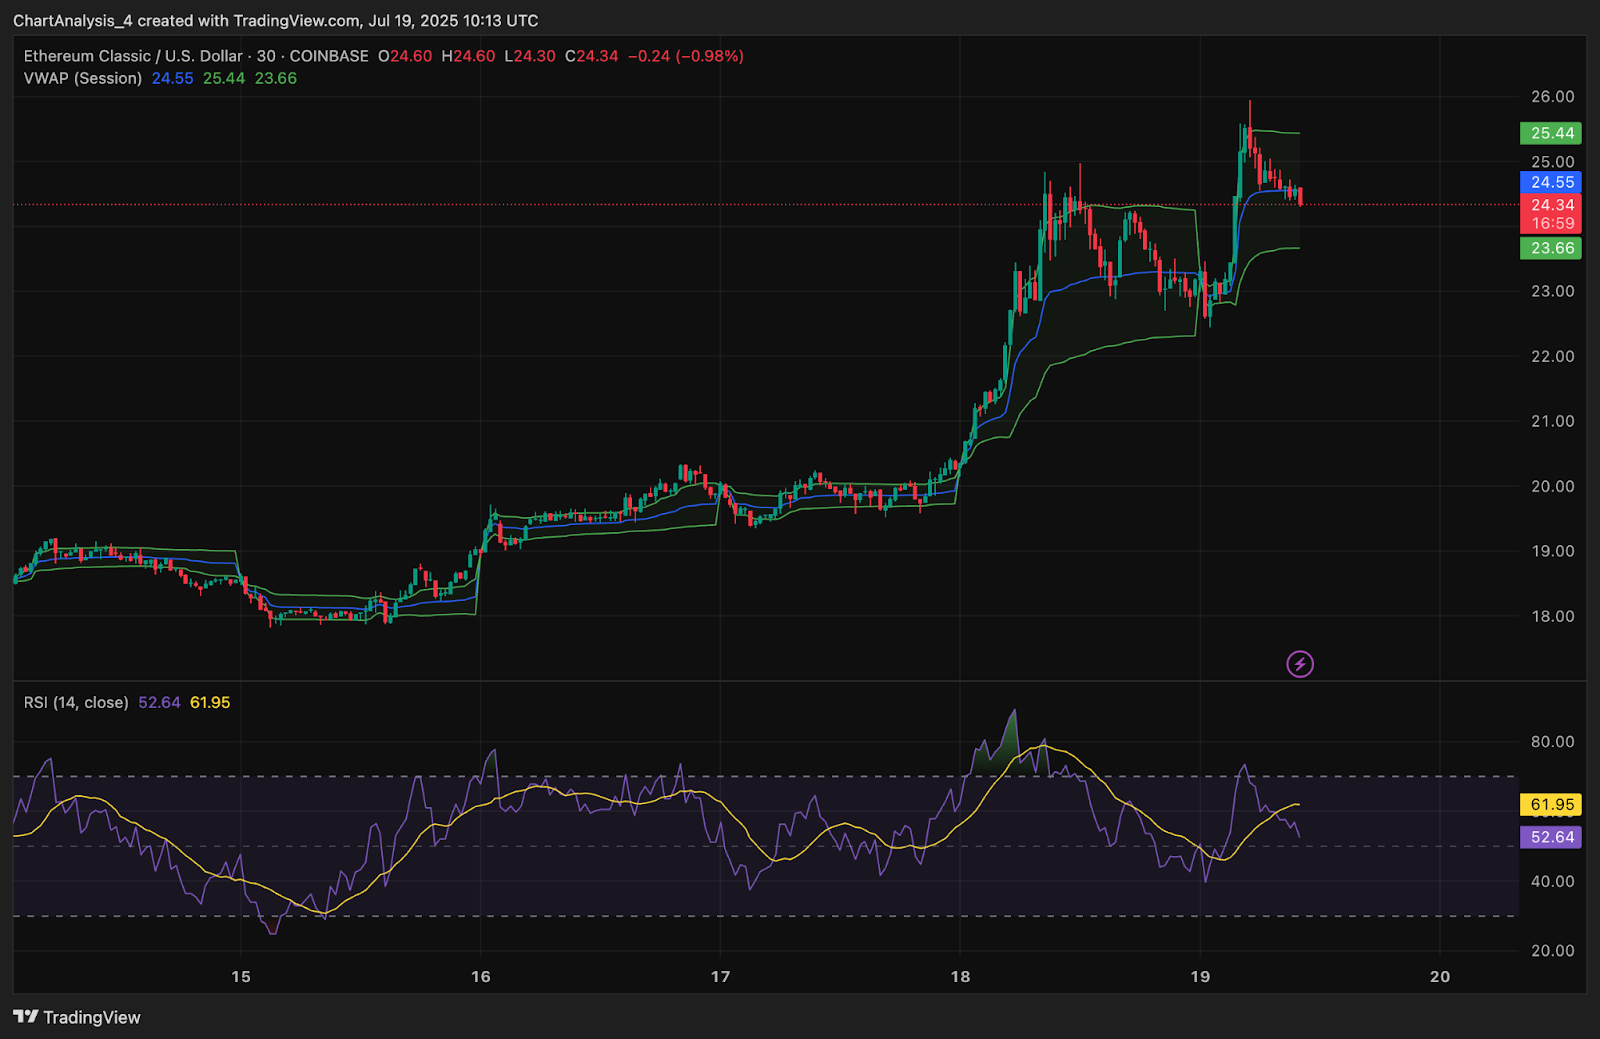
On the 30-minute chart, ETC price action surged above session VWAP and held gains, with RSI peaking above 70 before settling near 61.95. While short-term consolidation is possible, intraday structure remains bullish.
Bollinger Bands, EMAs, and Weekly Fibonacci Show Room To Expand
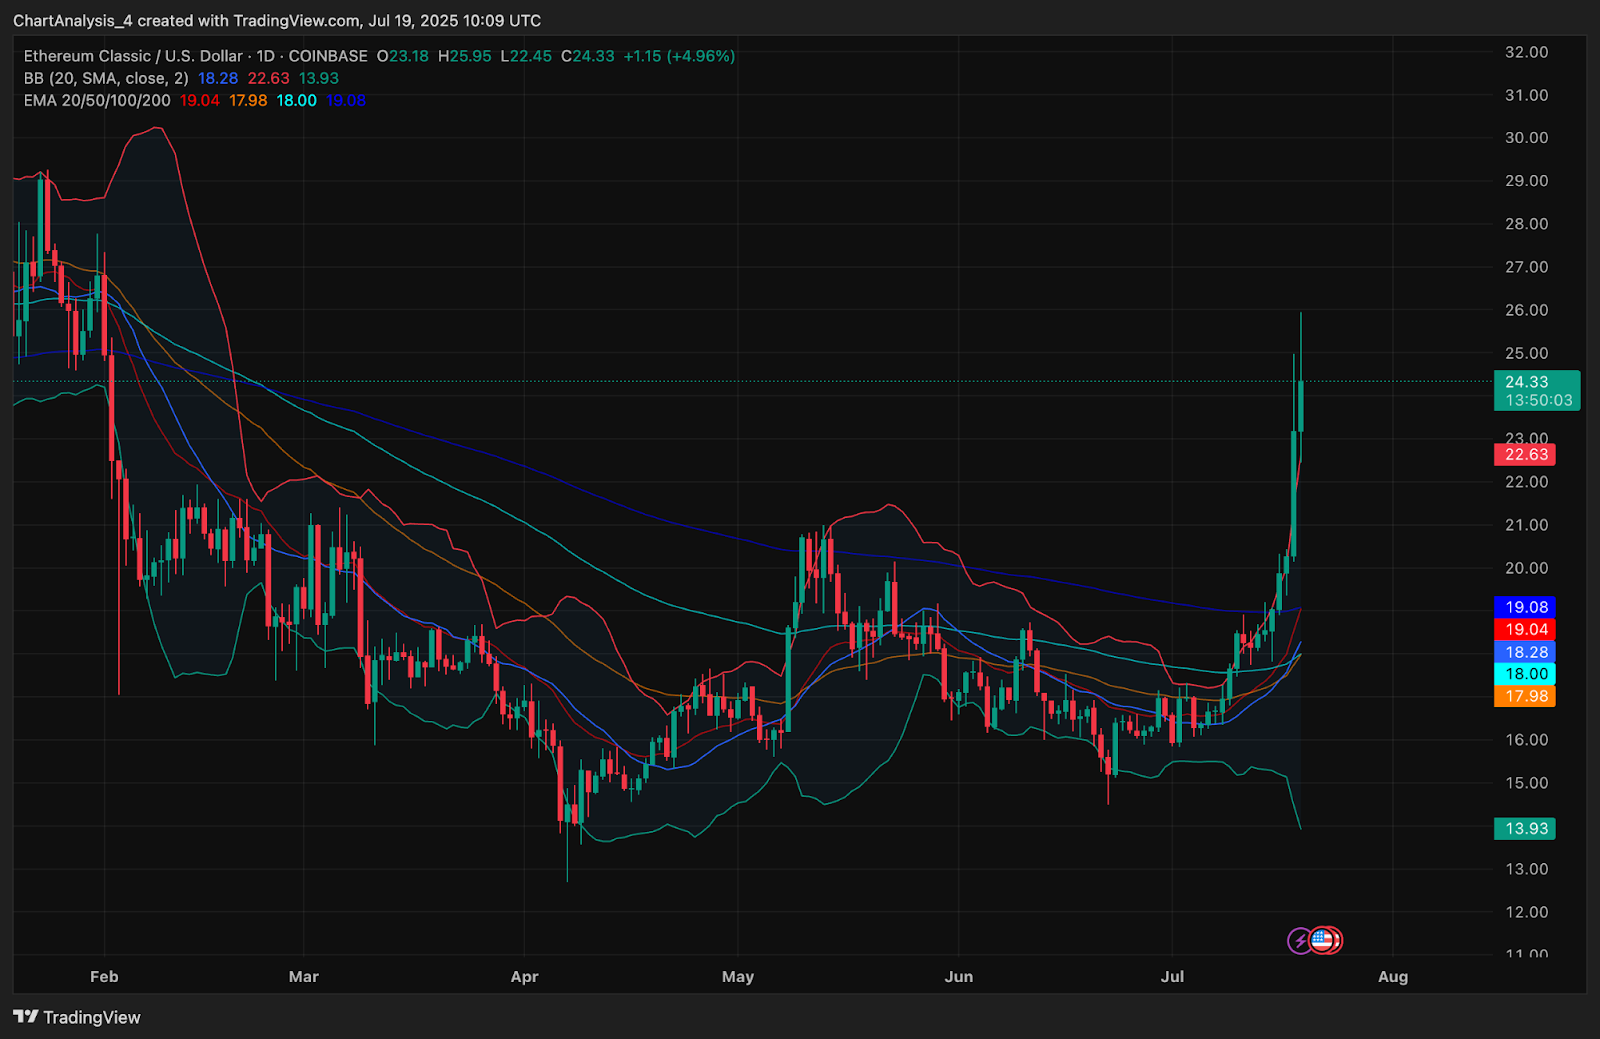
Bollinger Bands on the daily chart are in strong expansion mode, with price riding the upper band well above the 20 SMA at $18.28. This setup typically suggests a fresh volatility phase has begun. Price is now significantly extended from the 20/50/100/200 EMA cluster, all of which have aligned bullishly below $20.
The EMA20 ($19.04) and EMA50 ($17.98) are rising sharply and should act as dynamic support if price retests. On the weekly chart, the move past the 0.382 Fib level ($23.97) opens a path toward the 0.5 level ($27.31), followed by $30.82.
The volume profile and visible range gap between $25 and $28 supports the view that ETC may have further room to rally before meeting heavy resistance.
ETC Price Prediction: Short-Term Outlook (24h)
Ethereum Classic price is expected to consolidate between $23.60 and $25.50 in the next 24 hours, with volatility likely to remain elevated. If bulls reclaim $25.50, the next target lies at $27.90, a level that coincides with the Fibonacci 0.5 zone and visible supply resistance.
Failure to hold $23.00 could invite a deeper pullback toward $21.80 and potentially $20.50, where support aligns with the upper boundary of the previous handle breakout.
Momentum indicators such as RSI are cooling from overbought conditions, and VWAP-based zones between $23.60 and $24.50 should act as near-term pivots. Traders should monitor how ETC reacts around these key levels to gauge whether momentum continues or pauses.
Ethereum Classic Price Forecast Table: July 20, 2025
| Indicator/Zone | Level / Signal |
| Ethereum Classic price today | $24.34 |
| Resistance 1 | $25.50 |
| Resistance 2 | $27.94 |
| Support 1 | $23.00 |
| Support 2 | $21.80 |
| Weekly Fibonacci (0.5) | $27.31 |
| Bollinger Band Bias | Expanded (Volatility Rising) |
| EMA Cluster (20/50/100/200) | All Bullishly Aligned Below $20 |
| VWAP (30-min) | $24.55 (price below at close) |
| RSI (30-min) | 61.95 (cooling from overbought) |
| Spot Netflow (July 19) | +$1.69M (bullish capital inflow) |
| Volume Profile Resistance | $27.90 |
Disclaimer: The information presented in this article is for informational and educational purposes only. The article does not constitute financial advice or advice of any kind. Coin Edition is not responsible for any losses incurred as a result of the utilization of content, products, or services mentioned. Readers are advised to exercise caution before taking any action related to the company.


