
- Ethereum’s price is pulling back from its $4,040 high, with on-chain data suggesting a local top may be in
- A record $1.9B in ETH is queued to exit staking, but experts say this is a sign of maturity, not panic
- The technical picture is mixed, with an overbought RSI but continued underlying accumulation and ETF demand
Ethereum (ETH) is caught between the latest in ETH validator queues, market-wide sentiment shifts, and a technical setup that may soon evolve into a new trend. As of July 24, ETH is trading around $3,545, having pulled back from a recent high near $4,040.
Santiment Signals a Local Top
According to Santiment, Ethereum’s price ratio versus Bitcoin has dropped by 5.8% over the past 60 hours. This underperformance comes from a spike in FOMO-driven trading volume, similar to what we saw in early May, which historically marked a local top.
Santiment adds that if both trading and social volume were to cool down for the rest of the week, it could set the stage for a second bullish wave, driven by impatience from retail investors’ profit-taking psyche.
Is a $1.9 billion staking exit a bearish signal for ETH?
At the protocol level, over 520,000 ETH (more than $1.9 billion) is queued to exit the Ethereum staking system, marking the highest exit volume in over a year. However, this isn’t a panic-induced exodus.
Everstake emphasizes that this is more of a structural shift than a red flag; validators are likely optimizing operations, rotating staking strategies, or simply locking in profits.
This is also happening alongside record demand for spot ETH ETFs, with 3.57 billion as inflow just in July from institutions like BlackRock and Fidelity.
Rather than being a bearish indicator, Everstake argues this high exit queue reflects the maturity of Ethereum’s staking ecosystem.
Related: Arthur Hayes Bets on ‘Internet Status’ Over Tech in the Punks vs. ETH Trade This Cycle
ETH Price Analysis: Bullish momentum cools
ETH is clearly overbought, as the RSI is above the 70 level. Historically, this signals a potential cooldown. The MACD line is still above the signal line, with histogram bars showing weakening bullish momentum.
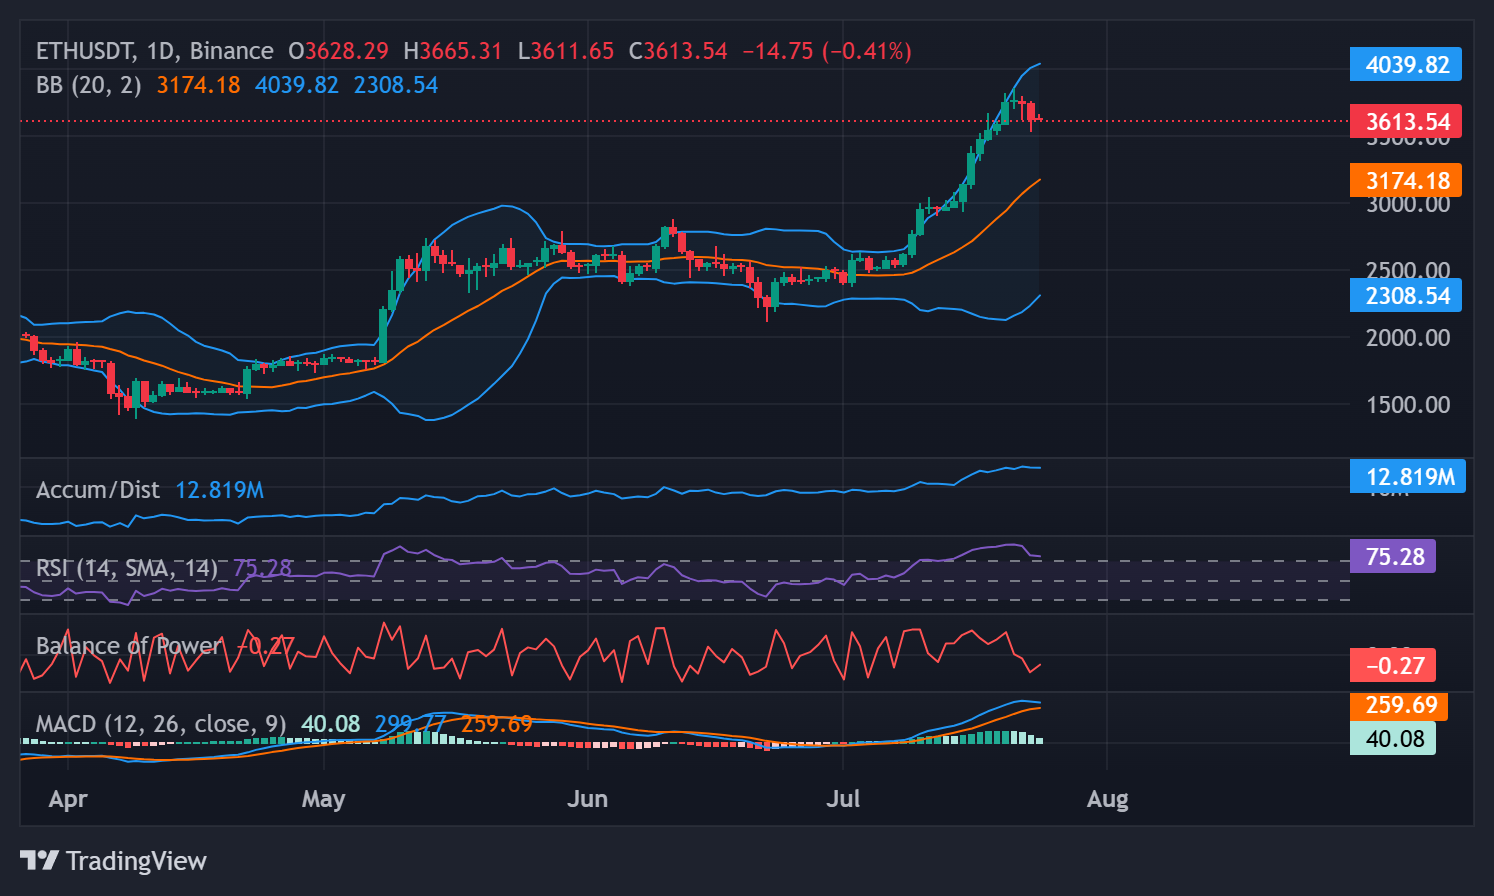
Also, price recently tagged the upper Bollinger Band near $4,039 and has since pulled back to the mid-$3,600s. This is a classic mean reversion signal. Support likely sits around the mid-band near $3,174, and if that fails, the lower band near $2,308 becomes the next target.
Related: For the First Time in Two Years, More Money Is Trading Ethereum Than Bitcoin
On the other hand, a negative BoP during an uptrend reinforces the probability of further cooling while the A/D line shows strong accumulation.
Disclaimer: The information presented in this article is for informational and educational purposes only. The article does not constitute financial advice or advice of any kind. Coin Edition is not responsible for any losses incurred as a result of the utilization of content, products, or services mentioned. Readers are advised to exercise caution before taking any action related to the company.


 Price Prediction: Canton Eyes Key Break After Market Activity Spike")

