 Price Prediction and Analysis for September 2")
Ethereum price today is trading near $4,400 after bouncing between $4,360 and $4,490 in recent sessions. The token has been consolidating within an ascending channel that has defined its uptrend since July, yet recent volatility shows momentum is beginning to fade.
The broader market remains cautious after Ethereum failed to hold firmly above the $4,600–$4,700 zone. A retracement to channel support is testing the conviction of buyers, with institutional flows and whale positioning now critical in deciding whether ETH can sustain its bullish bias into September.
Ethereum Price Holds Inside Channel but Faces Resistance
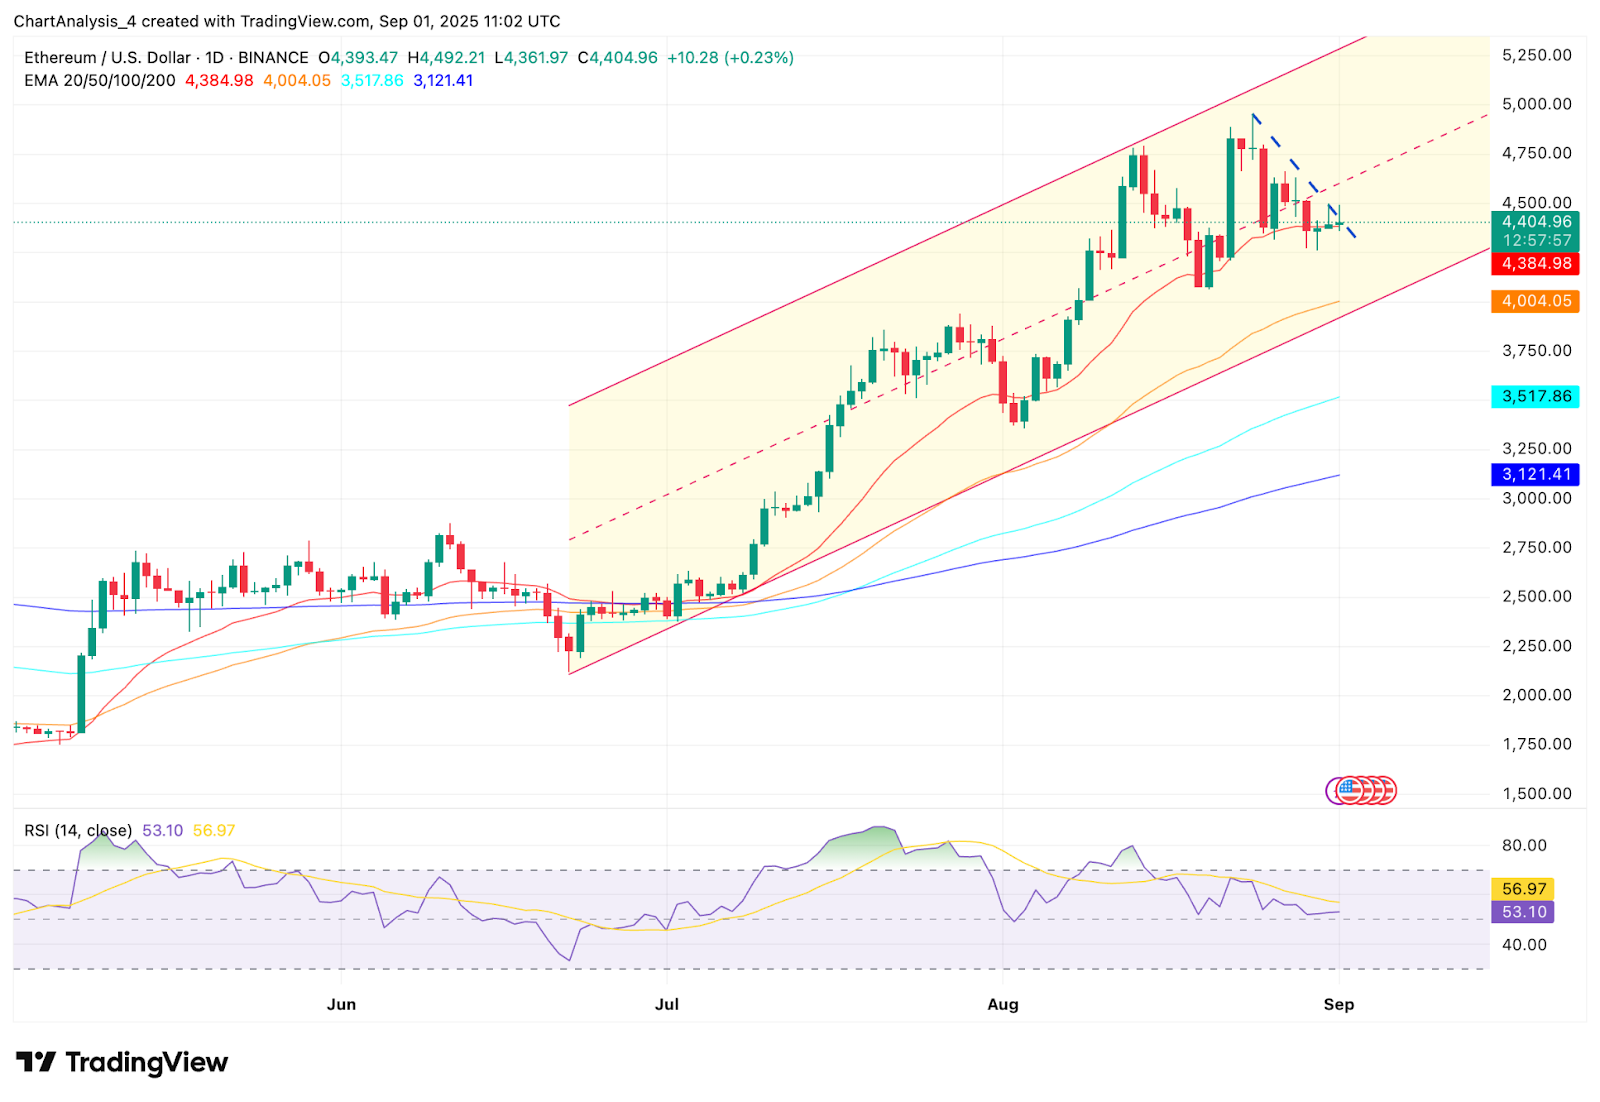
On the daily chart, Ethereum price action continues to track an ascending channel stretching from July’s $3,200 breakout. The structure remains constructive, with immediate support at the channel midline near $4,380 and deeper demand near the 50-day EMA at $4,004. Overhead resistance is defined at $4,700, where multiple attempts at breakout have failed.
Momentum indicators highlight indecision. RSI sits around 53, reflecting a neutral stance without clear overbought or oversold conditions. This balance suggests Ethereum is consolidating before its next directional push. As long as ETH holds above $4,380, the channel structure points to resilience.
Analyst Crypto Rover noted on X that Ethereum’s monthly candle has retraced just below the 2021 cycle high, emphasizing that this pullback mirrors historical behavior during previous rallies. He argued that “ATHs are being set, and this pullback is completely normal, just like in 2021,” warning traders not to exit prematurely.
Spot Outflows and Supertrend Resistance Weigh on Momentum
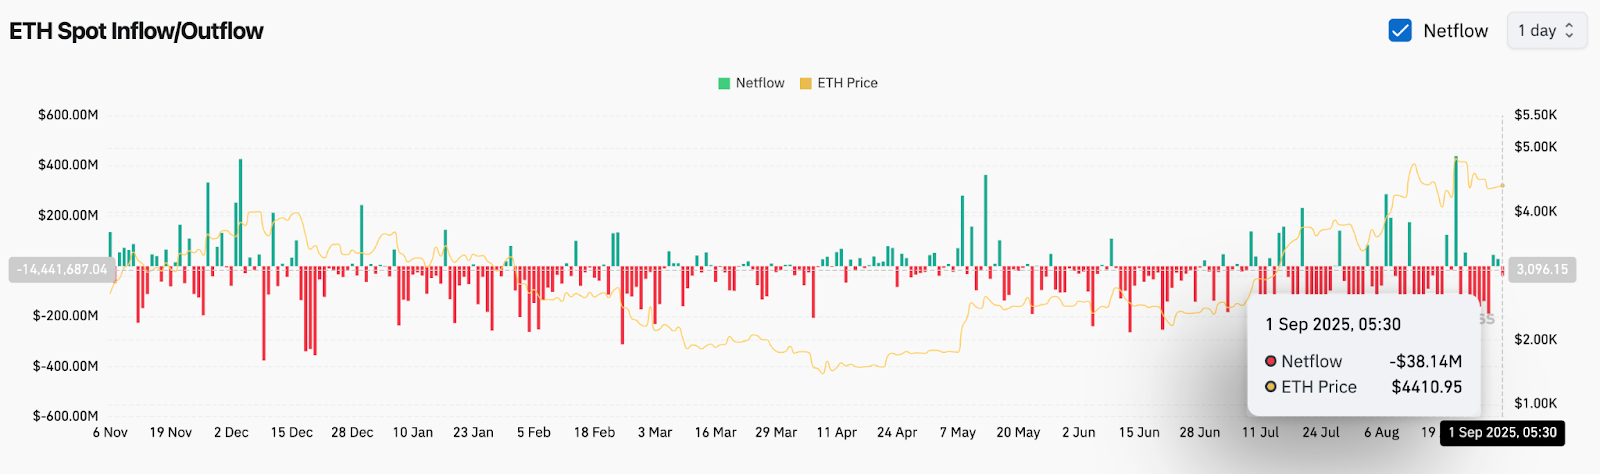
Flows data shows that Ethereum continues to face selling pressure. On September 1, spot netflows recorded $38.1 million in outflows, reflecting reduced confidence among larger holders. While such outflows are not unusual during consolidation phases, persistent selling weakens the case for a clean breakout in the near term.
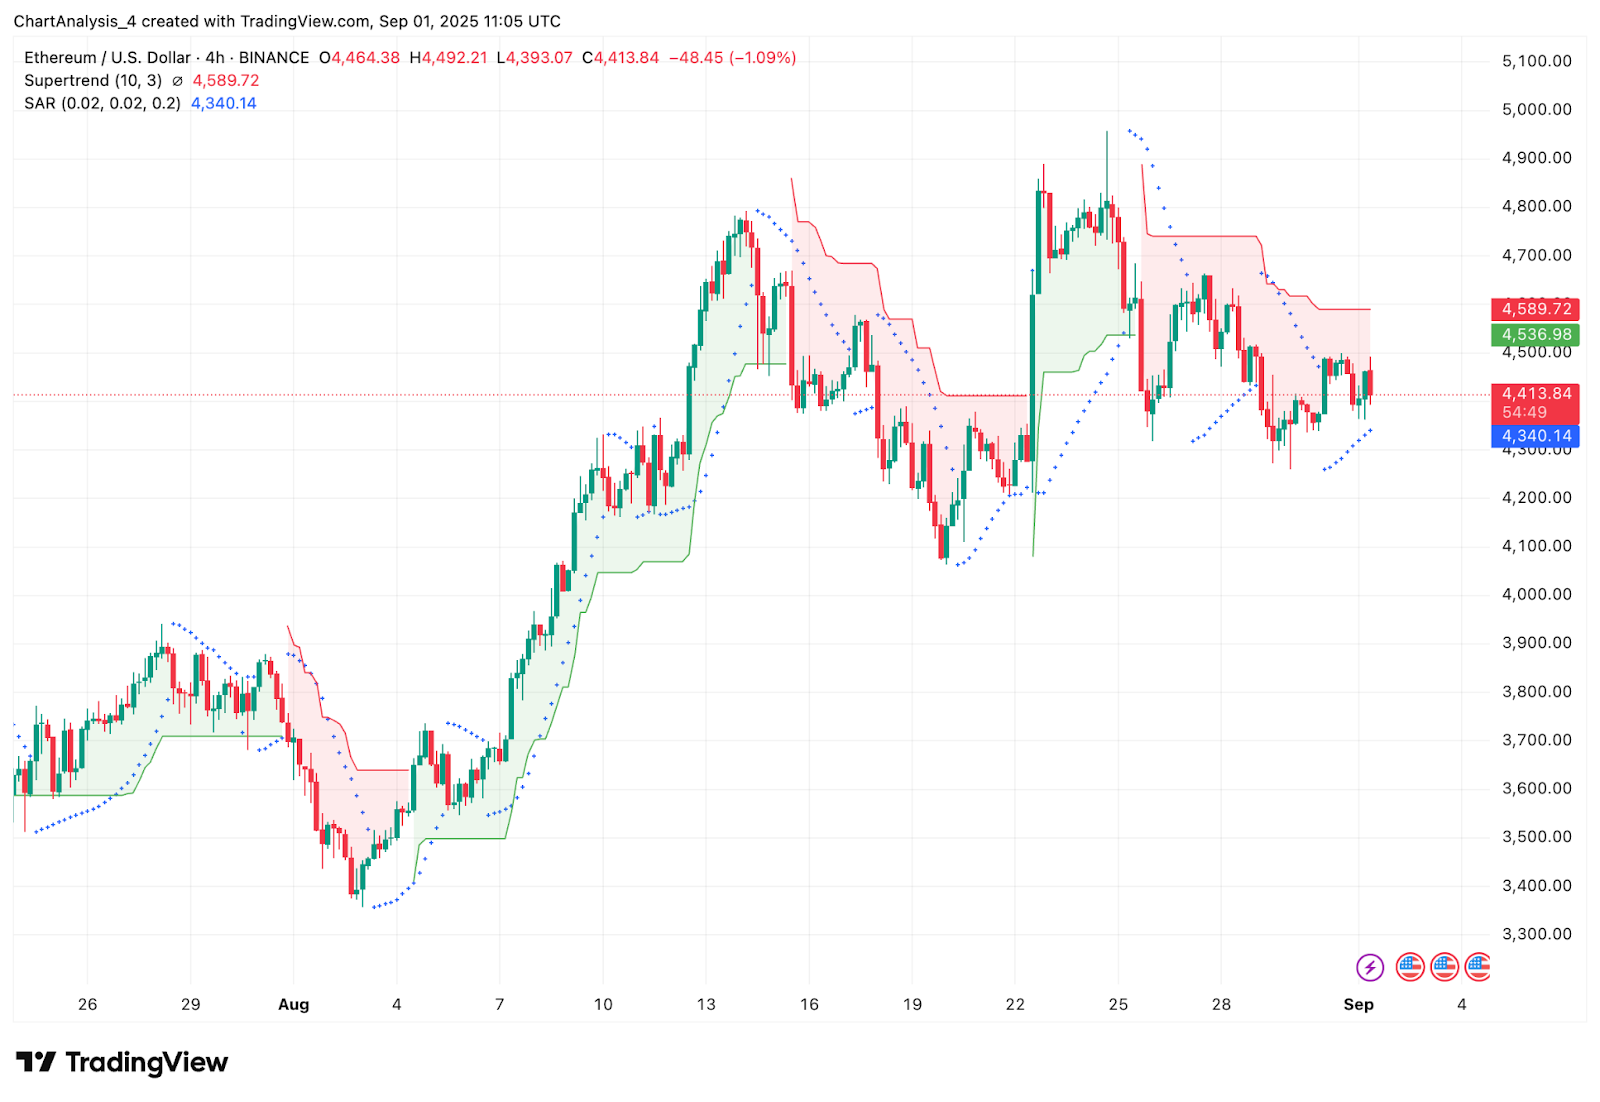
Shorter timeframe charts reinforce this caution. On the 4-hour view, Ethereum is trading below the supertrend resistance near $4,590, with the indicator flashing bearish bias after repeated failures to close above this level. The Parabolic SAR aligns near $4,340 as immediate support, suggesting any dip through this threshold could trigger further downside toward the $4,200–$4,000 zone.
This combination of outflows and technical resistance highlights why Ethereum price volatility has increased, keeping traders on edge despite the broader bullish structure.
Contrasting Views: Bulls Eye Breakout, Bears Point to Outflows
Bulls argue that Ethereum’s channel structure and higher-lows pattern remain intact, making $4,380 a critical pivot. If this floor holds, ETH could retest the $4,600–$4,700 region quickly. A decisive breakout above $4,700 would re-establish bullish control, opening the path toward $5,000 and potentially $5,200.
Bears counter that repeated failures at $4,700 combined with negative spot flows reveal underlying weakness. They warn that if ETH loses $4,380 support, momentum could flip bearish, exposing $4,000 and the 100-day EMA at $3,517 as deeper downside targets. The monthly chart comparison with 2021 also suggests that strong pullbacks are part of cycle behavior before sustained rallies.
Ethereum Short-Term Outlook: Breakout or Breakdown Ahead?
Heading into September 2, Ethereum’s short-term outlook is finely balanced. A strong close above $4,500 would improve sentiment and set the stage for another breakout attempt toward $4,700 and $5,000. Failure to hold above $4,380, however, risks accelerating losses into the $4,000–$4,100 region where major moving averages cluster.
The Ethereum price prediction for the next 24–48 hours leans neutral, with spot outflows tempering bullish conviction. Traders are watching the $4,380–$4,700 range closely as the decisive zone for ETH’s next trend.
Ethereum Price Forecast Table
| Indicator | Signal | Levels/Notes |
| Price Today | $4,400 | Consolidating within ascending channel |
| Support | $4,380 / $4,000 | Channel midline and 50-day EMA |
| Resistance | $4,700 / $5,000 | Overhead breakout zones |
| RSI | 53 | Neutral momentum |
| MACD | Flat bias | No strong shift |
| Pattern | Ascending channel | Uptrend intact unless $4,380 breaks |
| Flows | –$38.1M outflow | Spot selling pressure |
| Supertrend | Bearish below $4,590 | Resistance capping upside |
Disclaimer: The information presented in this article is for informational and educational purposes only. The article does not constitute financial advice or advice of any kind. Coin Edition is not responsible for any losses incurred as a result of the utilization of content, products, or services mentioned. Readers are advised to exercise caution before taking any action related to the company.


