 Price Prediction: Can Bulls Sustain Above $2,100?")
- Ethereum holds crucial support at $1,744, guiding short-term recovery efforts.
- Resistance near $2,159 and Fibonacci zones define potential upside barriers.
- Rising futures and institutional ETH demand signal cautious yet growing market interest.
Ethereum continues to trade within a broad recovery phase after a steep decline from above $3,400. The asset recently found strong footing near $1,744, which now serves as a critical structural base.
Since that point, ETH has moved in a tight range while showing mild upward pressure. However, the broader trend still lacks strong conviction. Price remains below key longer-term moving averages, which signals that full bullish control has not yet returned.
Key Levels Shape the Current Market Structure
Support and resistance zones continue to guide short-term price behavior. The $1,744 level stands as the most important support. A break below this zone could reopen downside momentum and weaken the recovery structure.
Additionally, the $2,000 psychological level offers a secondary support area. Buyers often defend round numbers, which adds to its importance. The 20 EMA near $2,085 also acts as dynamic support during short pullbacks.
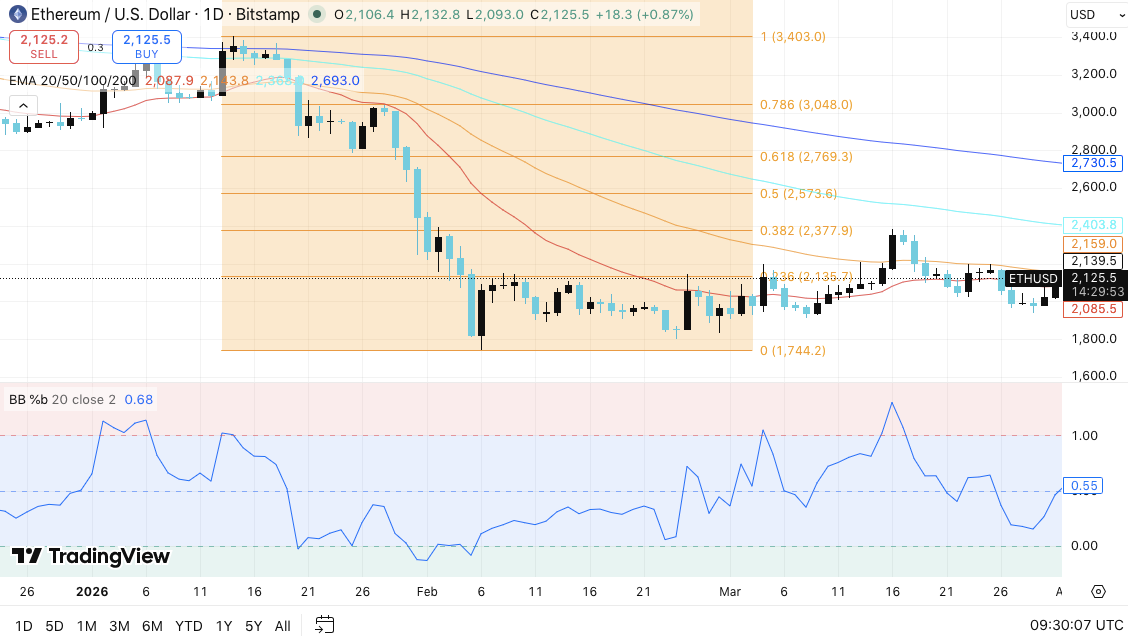
On the upside, resistance builds near $2,159. Price has struggled to break above this level multiple times. Beyond that, the $2,377 and $2,573 Fibonacci levels mark stronger barriers. These zones often act as turning points in retracement trends.
Related: Chainlink Price Prediction: Will LINK Break $10 or Fall to $7?
Furthermore, the $2,769 region aligns with the 0.618 Fibonacci level. A move above this area would signal a stronger trend shift. Longer-term EMAs at $2,400 and $2,730 also add resistance pressure.
Market Signals Show Mixed Momentum
Indicators point to a market in transition rather than a clear trend. The 20 EMA has alternated between support and resistance, which confirms consolidation. Meanwhile, the 50 EMA sits close to price and reflects short-term indecision.
However, the 100 and 200 EMAs remain well above current price. Hence, the long-term structure still leans bearish. This creates a setup where Ethereum builds strength within a larger corrective phase.
The Bollinger %b indicator also reflects balanced momentum. A reading near 0.6 suggests neither overbought nor oversold conditions. Consequently, the market may continue to consolidate before a stronger move develops.
On-Chain and Institutional Activity Add Context
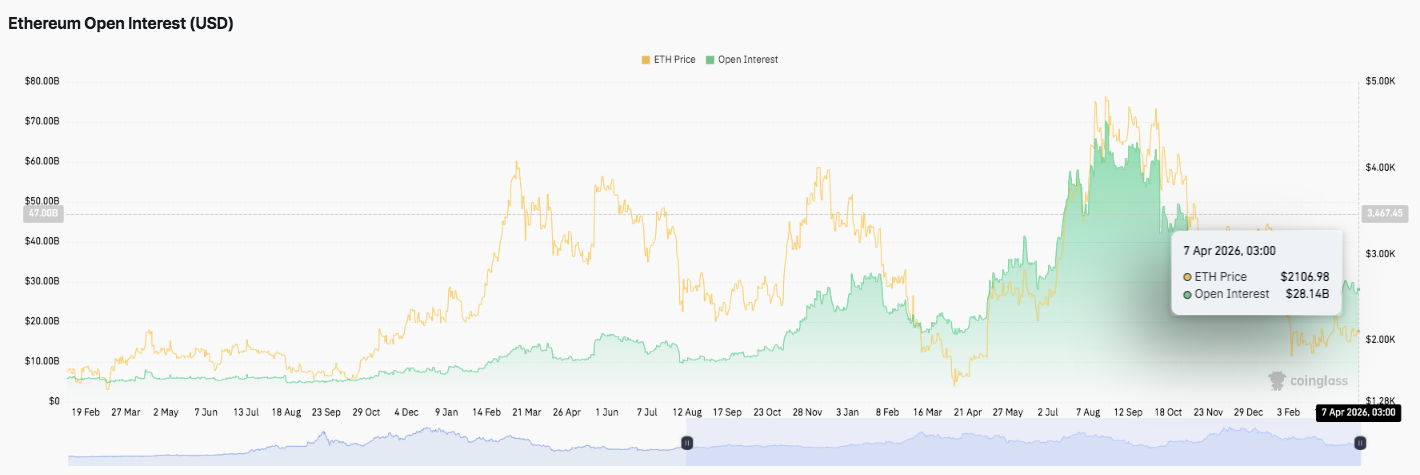
Open interest data shows rising participation in Ethereum markets. Futures engagement reached about $28.14 billion, indicating growing trader activity. This rise aligns with price fluctuations and increased volatility.
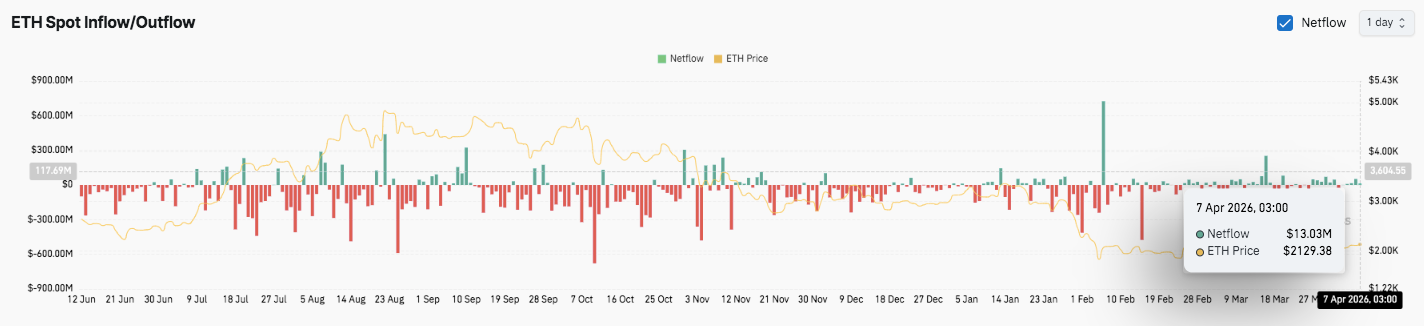
Additionally, spot flow data shows mixed but slightly positive net inflows. Recent figures around $13 million highlight ongoing interest from buyers. However, sharp inflow and outflow spikes suggest uncertainty among market participants.
Related: RedStone Price Prediction: RED Jumps 118% as Bulls Target $0.276
Institutional involvement also strengthens Ethereum’s narrative. BitMine has accumulated over $10 billion in ETH holdings, which signals strong long-term conviction. Moreover, the firm’s upcoming NYSE uplisting highlights growing confidence in Ethereum’s role within corporate portfolios.
Technical Outlook for Ethereum (ETH) Price
Key levels remain well-defined as Ethereum trades near a critical decision zone.
Upward levels: $2,159, $2,377, and $2,573 act as immediate resistance hurdles. A breakout above this cluster could extend gains toward $2,769 and $3,048.
Downward levels: $2,085 forms short-term support, followed by $2,000 as a psychological floor. A deeper breakdown exposes $1,744, which represents the major structural low.
Resistance ceiling: The 100-day and 200-day EMAs, located above current price, remain key barriers for medium-term bullish momentum. Ethereum must reclaim these levels to confirm a trend reversal.
The technical structure shows ETH consolidating after a prior downtrend. Price action now forms a tightening range between support and resistance. Hence, this compression often precedes a volatility expansion in either direction.
Will Ethereum Go Up?
Ethereum’s near-term direction depends on whether buyers defend the $2,085–$2,000 support zone. Holding this area gives bulls a foundation to challenge the $2,159 resistance level. Additionally, sustained strength above this level could trigger a move toward higher Fibonacci zones.
Moreover, stronger inflows and rising open interest suggest growing market participation. Consequently, momentum could build if buyers maintain control and push above $2,377. This would open the path toward $2,573 and beyond.
Related: Solana Price Prediction: Can SOL Hold Steady After Circle Pours $3.25B Into The Network?
However, failure to hold $2,000 would weaken the structure. In that case, Ethereum could revisit $1,744 and potentially extend lower. Therefore, sellers would regain control if price breaks below key supports with volume.
Disclaimer: The information presented in this article is for informational and educational purposes only. The article does not constitute financial advice or advice of any kind. Coin Edition is not responsible for any losses incurred as a result of the utilization of content, products, or services mentioned. Readers are advised to exercise caution before taking any action related to the company.


