 Price Prediction for July 11")
After a period of steady accumulation, Ethereum price today has broken above a multi-month symmetrical triangle near $2,780 and is now trading near $2,808. The breakout follows strong volume support and a clean bullish structure on both the daily and 4-hour timeframes.
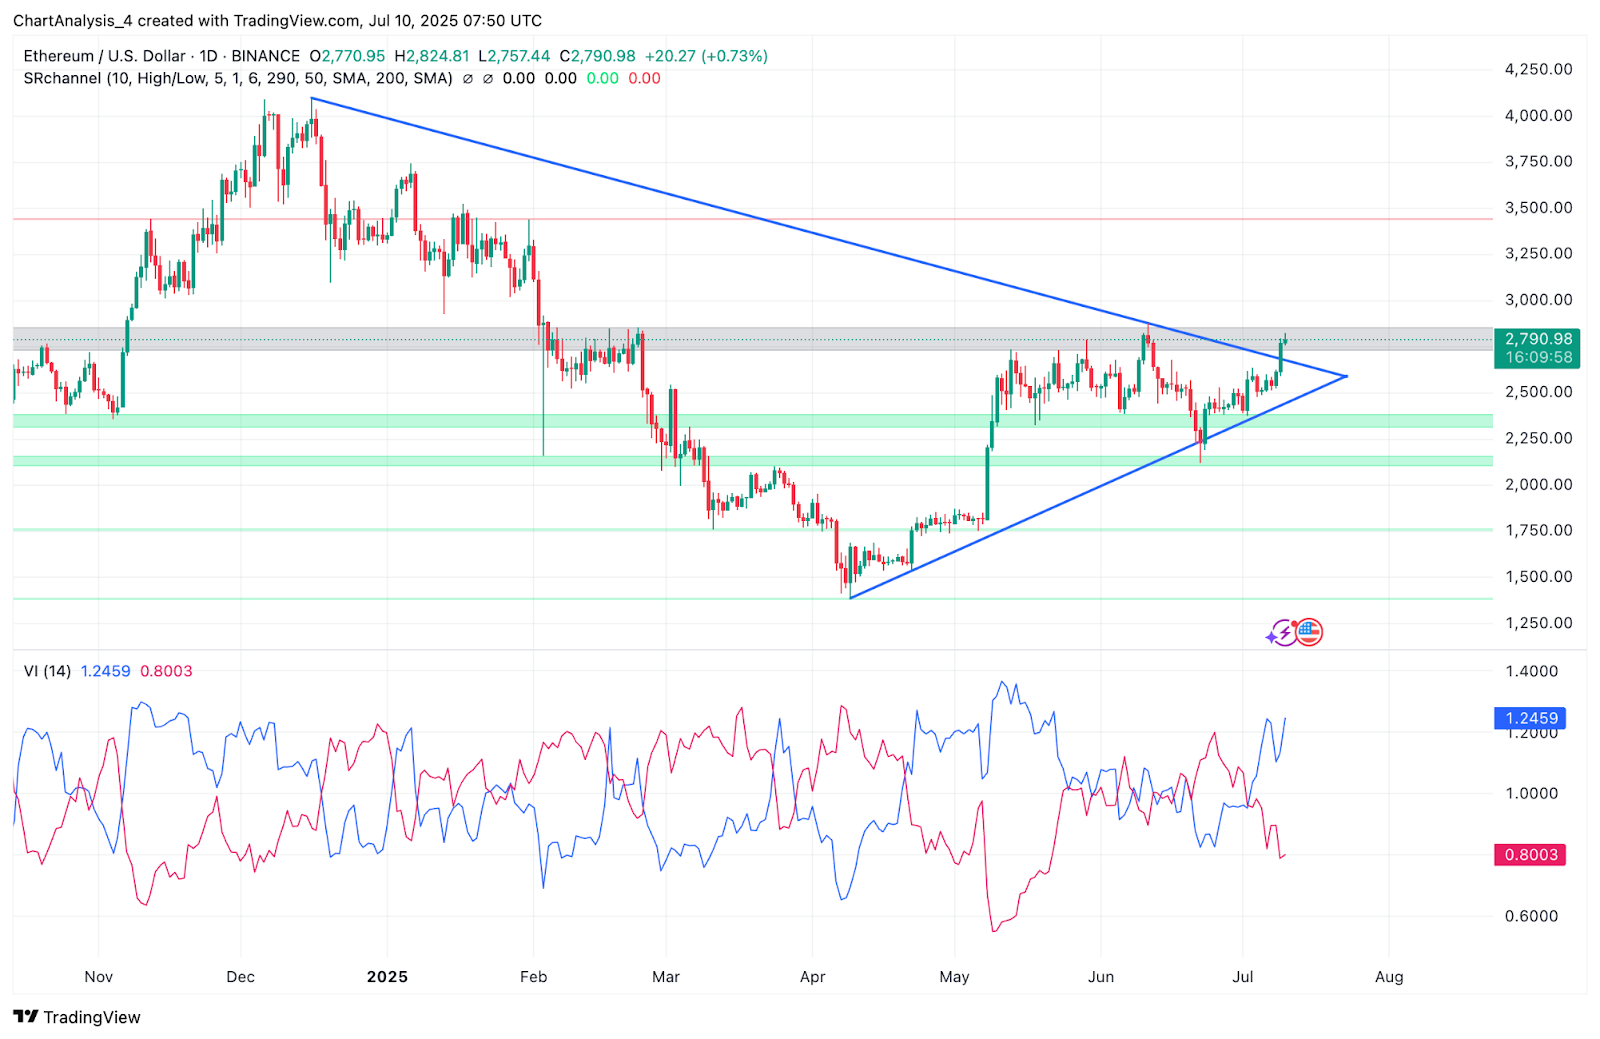
With indicators signaling a fresh momentum wave, ETH appears primed for further upside if $2,800 is flipped into support. Moreover, the Vortex Indicator (VI) on the daily chart shows the blue trend line (VI+) surging to 1.24 while the red line (VI−) fades, indicating bullish trend expansion.
What’s Happening With Ethereum’s Price?
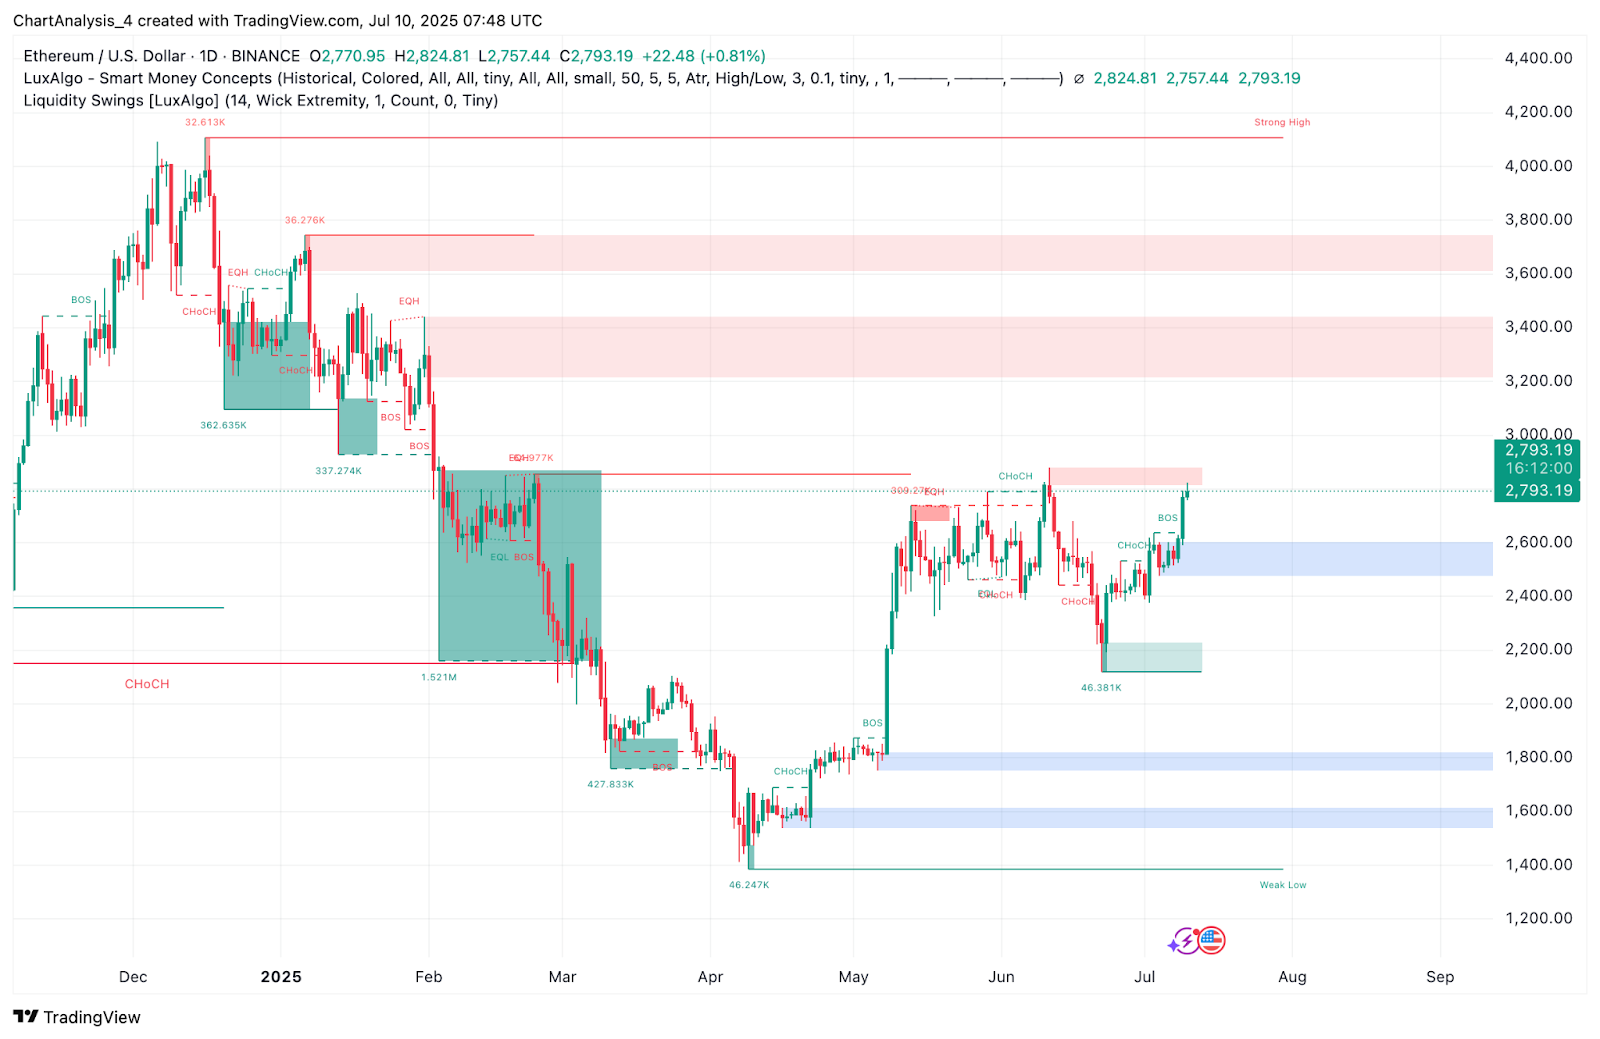
Ethereum price action shows a breakout above a long-term symmetrical triangle that began forming in Q1 2025. On the daily chart, ETH decisively pierced the triangle apex around $2,770 and reclaimed structural resistance at $2,790, backed by a bullish BOS (Break of Structure) confirmation on Smart Money Concepts. This marks Ethereum’s first higher-high breakout since early March.
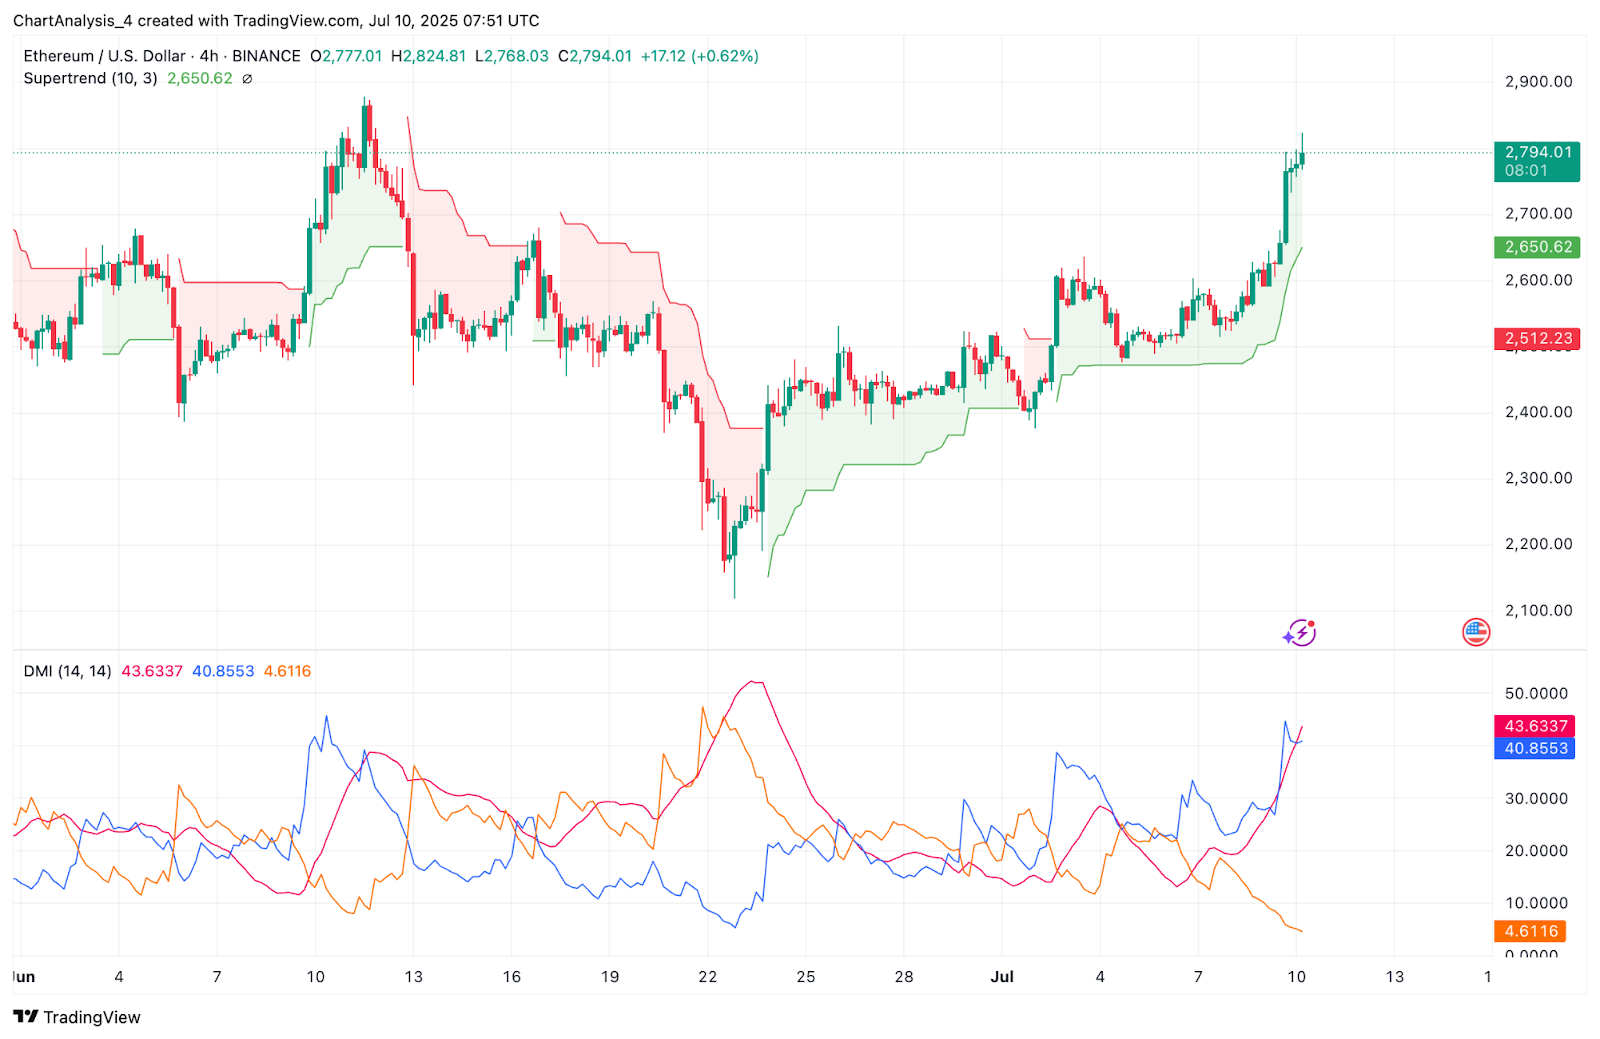
Supporting this move, the 4-hour Supertrend has flipped green above $2,650, while all four EMAs (20/50/100/200) are stacked below price.
ETH is currently trading above the Bollinger upper band ($2,789) and the EMA200 ($2,508), confirming bullish trend strength. The daily volume imbalance created near $2,960 now becomes the next magnet for price, with minimal resistance until that level.
Why Is The Ethereum Price Going Up Today?
The answer to why Ethereum price going up today lies in a combination of bullish technical breakout and aggressive derivatives positioning.
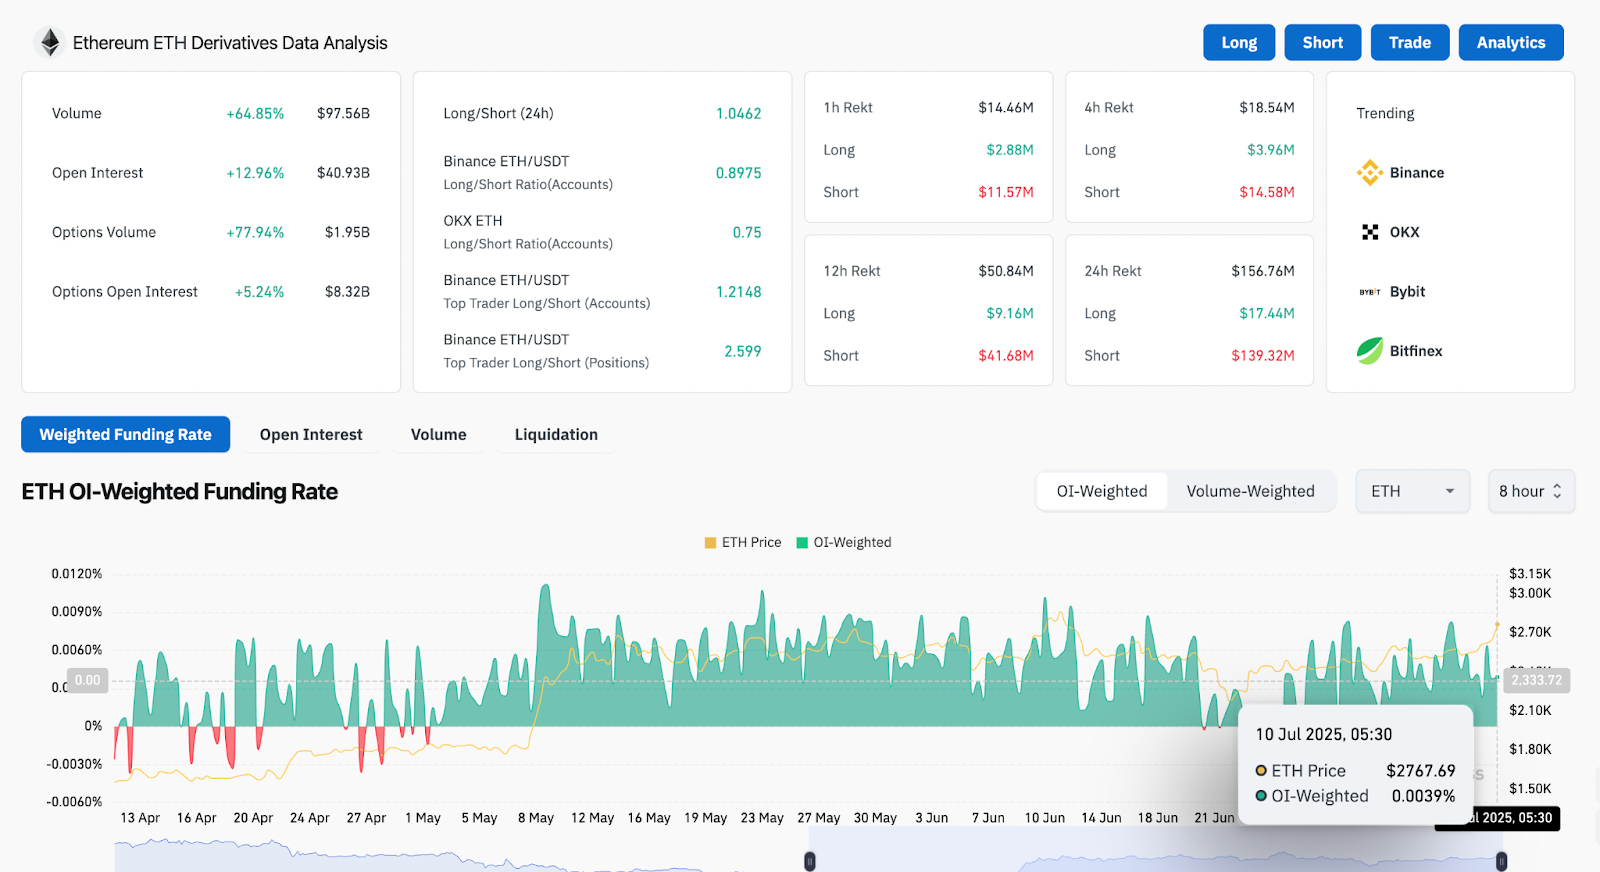
According to Coinglass, ETH derivatives volume has jumped +64.85% to $97.56B in 24 hours, while open interest surged +12.96% to $40.93B. Options volume also rose nearly 78%, confirming institutional interest in ETH upside.
Notably, the Binance ETH/USDT top trader long/short ratio (positions) sits at 2.599, highlighting strong directional conviction among high-volume traders. Open Interest-Weighted Funding Rate also remains positive, suggesting continued long bias without overheated leverage.
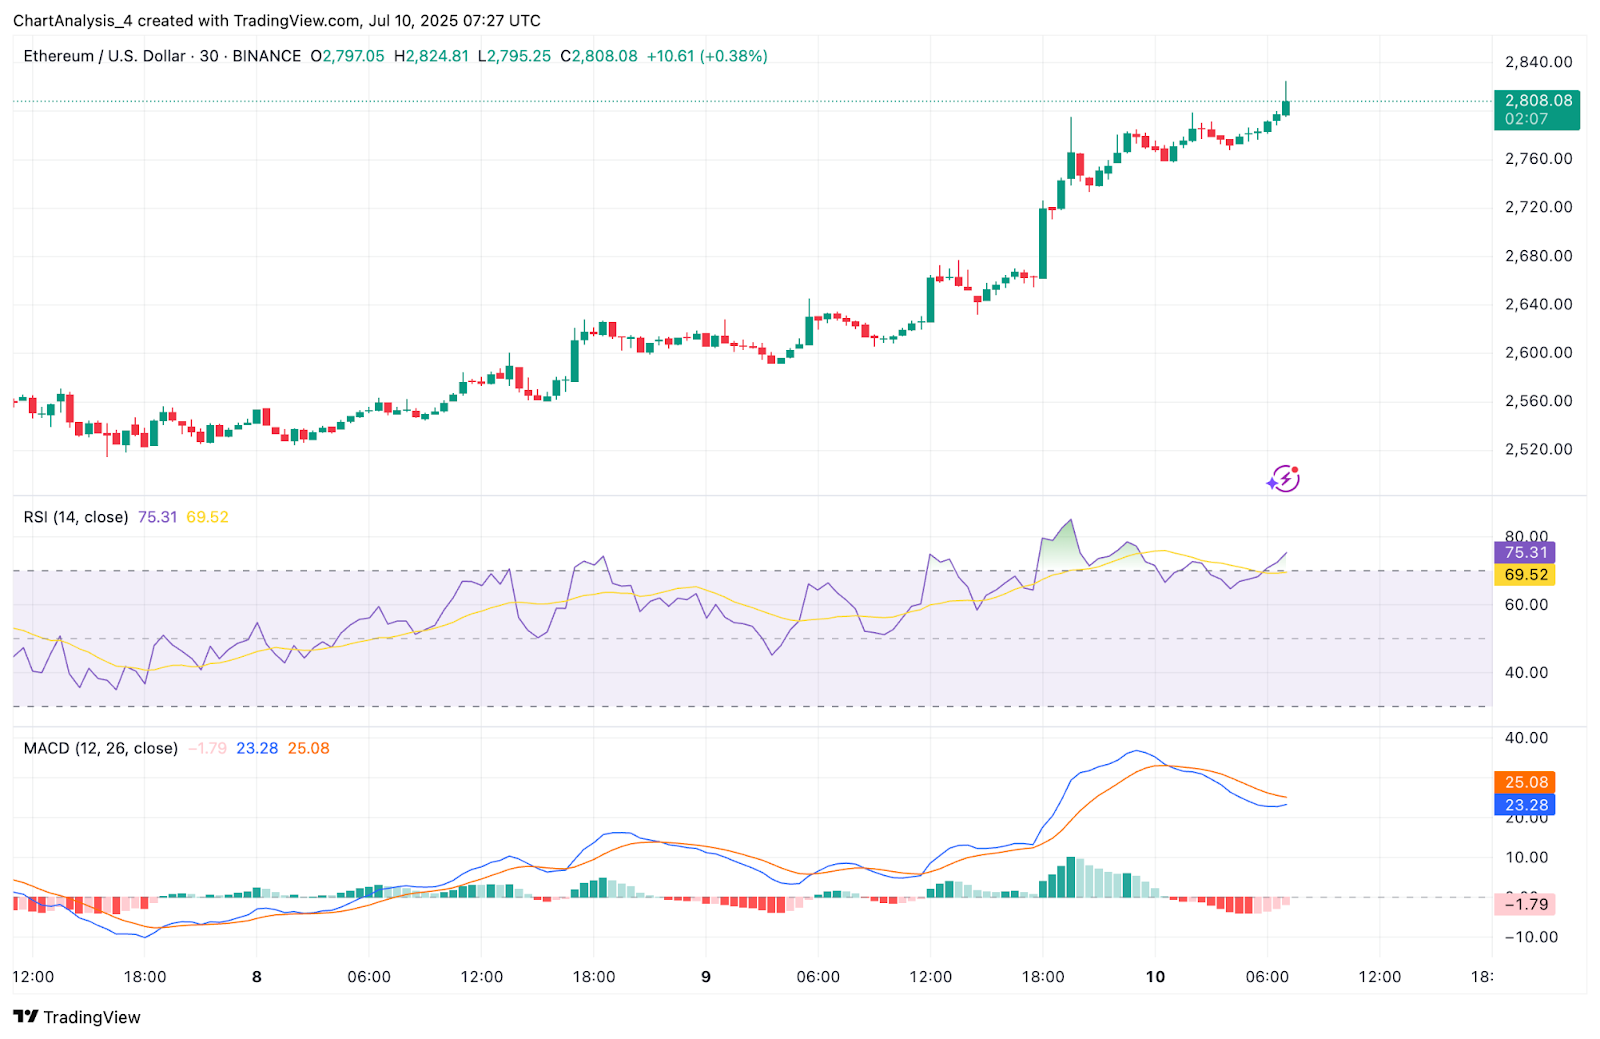
The 30-minute RSI has entered overbought territory at 75.31, reflecting strong intraday momentum. Meanwhile, MACD on the 4H chart remains bullish with a positive histogram and expanding gap between signal and MACD lines. These signals support the continuation of the current impulse.
EMA Confluence and VWAP Trend Reinforce Bullish Thesis
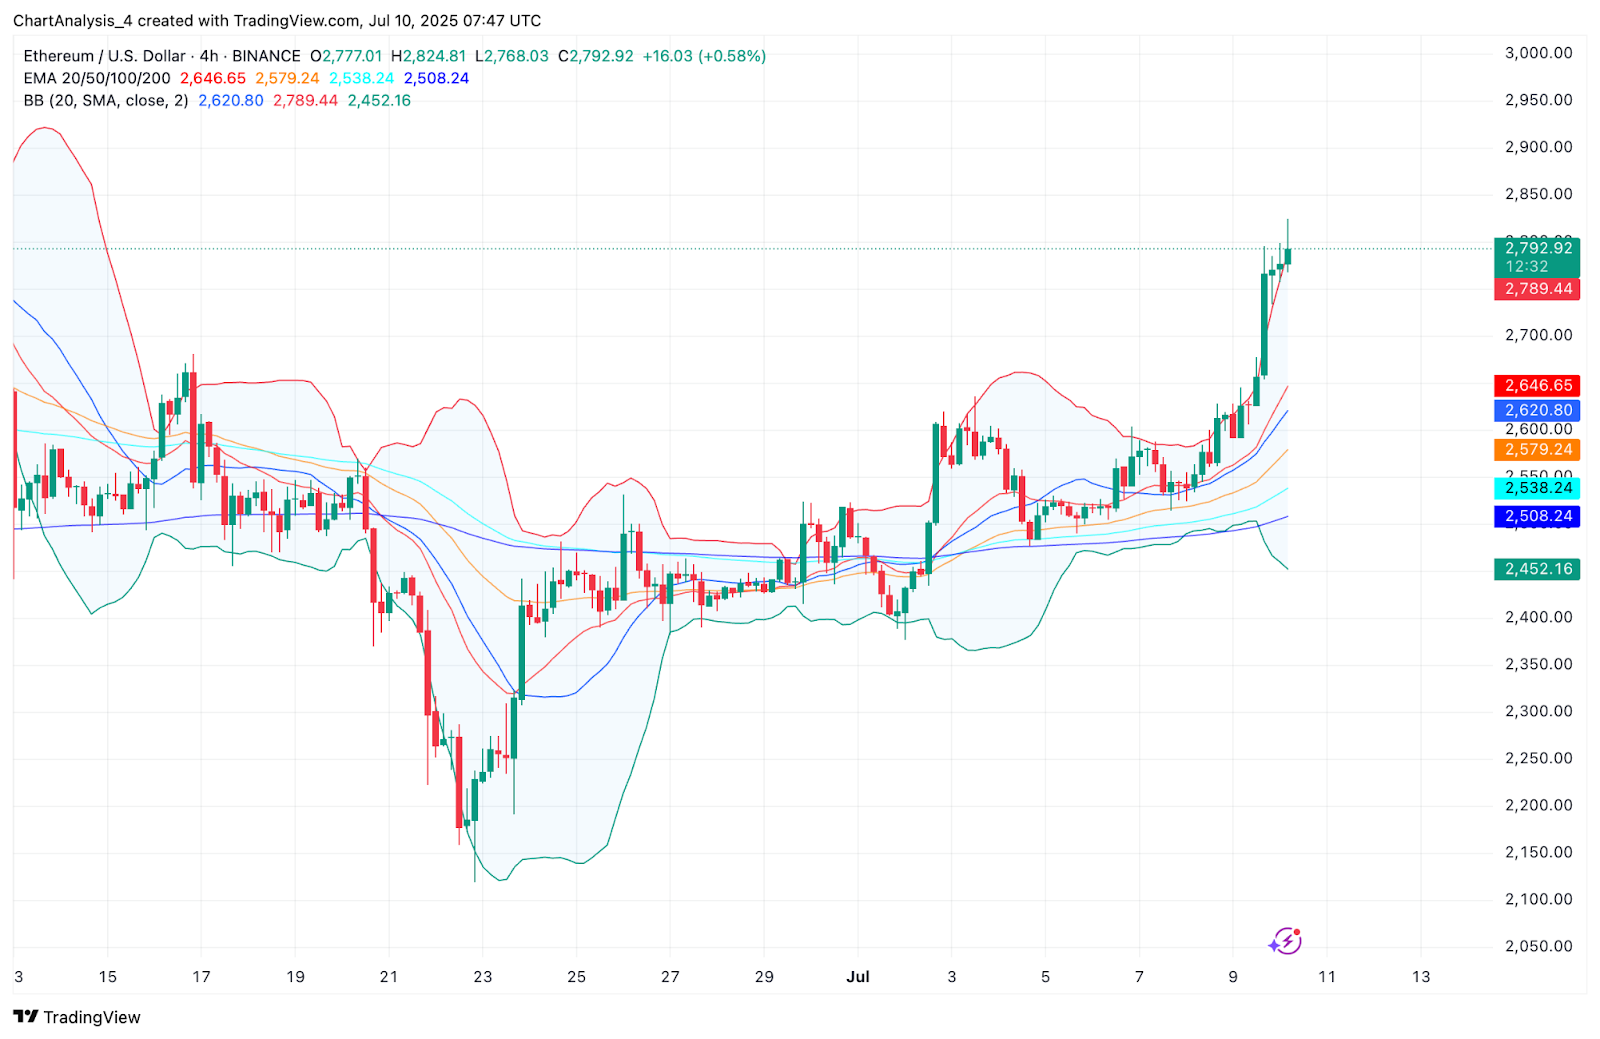
The 4-hour chart highlights perfect EMA alignment:
- EMA20: $2,620
- EMA50: $2,579
- EMA100: $2,538
- EMA200: $2,508
This upward stacking of EMAs below price typically confirms sustained trend strength.
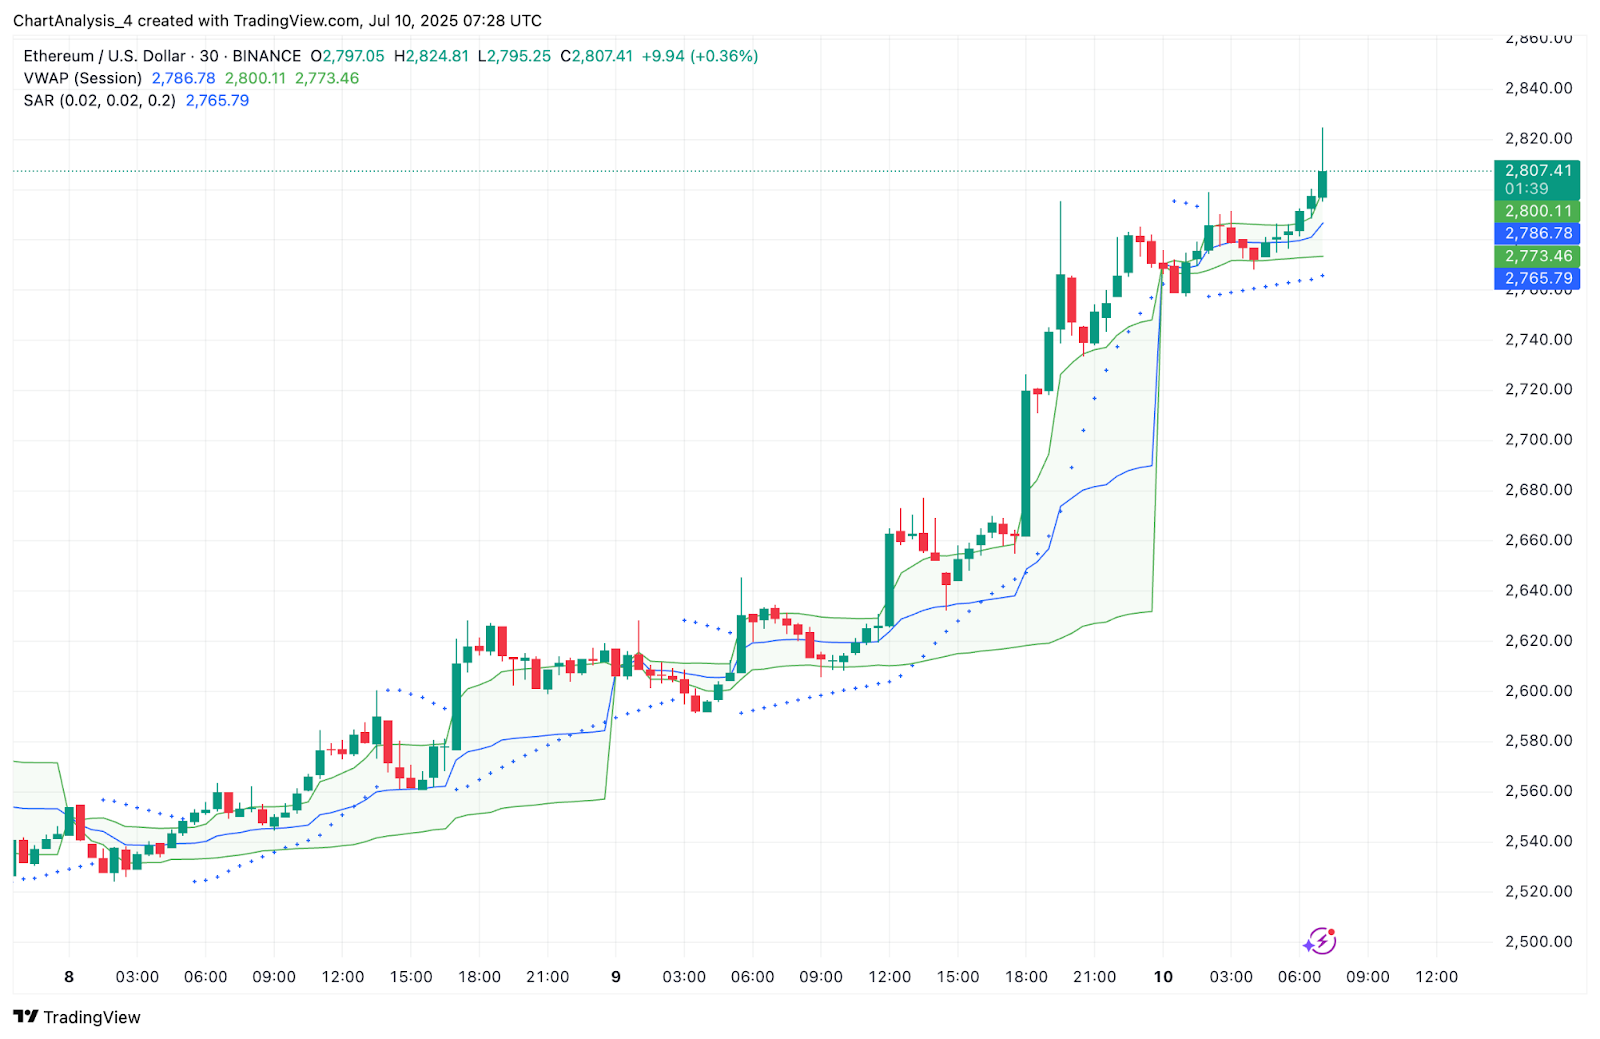
In addition, VWAP on the 30-minute chart has consistently trailed the price, with ETH now holding above the session VWAP at $2,786.78 and anchored VWAP at $2,800.
Parabolic SAR dots also remain below candles, adding more confirmation to bullish bias. As long as ETH holds above these dynamic zones, bulls remain in control.
ETH Price Prediction: Short-Term Outlook (24H)
With the triangle breakout confirmed and momentum accelerating, Ethereum price is now targeting the $2,940–$2,960 resistance zone. This area represents the final order block from the February decline and could act as a magnet in the next 24–48 hours.
If price continues to hold above $2,790, upside continuation becomes the base case. However, a minor pullback toward $2,760–$2,773 (VWAP zone) is possible if short-term exhaustion sets in. Below that, strong support lies at $2,650 (Supertrend baseline) and $2,620 (EMA20 on 4H).
Given the bullish DMI alignment (+DI above −DI with rising ADX), RSI breakout, and derivatives flow, ETH appears poised to climb further unless rejected from $2,950.
Ethereum Price Forecast Table: July 11, 2025
| Indicator/Zone | Level / Signal |
| Ethereum price today | $2,808 |
| Resistance 1 | $2,940 (Triangle breakout target) |
| Resistance 2 | $2,960 (Order block supply zone) |
| Support 1 | $2,773 (VWAP / 30-min support) |
| Support 2 | $2,650 (Supertrend + EMA cluster) |
| RSI (30-min) | 75.31 (Overbought, strong momentum) |
| MACD (4H) | Bullish Crossover Expanding |
| VWAP Trend | Holding Above VWAP & Anchored VWAP |
| Bollinger Bands (4H) | Price Above Upper Band |
| EMAs (20/50/100/200) | Bullish Stacked Support |
| DMI (14, 4H) | +DI Leads, ADX Rising |
| Derivatives OI | $40.93B (+12.96%), Bullish Bias |
| Long/Short Ratio (Binance) | 2.599 (Heavy Longs) |
Disclaimer: The information presented in this article is for informational and educational purposes only. The article does not constitute financial advice or advice of any kind. Coin Edition is not responsible for any losses incurred as a result of the utilization of content, products, or services mentioned. Readers are advised to exercise caution before taking any action related to the company.

 Price Prediction: Can Bulls Reclaim the 0.236 Level?")

 Price Prediction: Can Bulls Break the $329 Barrier?")
