 Price Prediction For July 16")
Ethereum is currently trading around $2,989, after a volatile push higher earlier this week that briefly tapped the $3,082 mark. While price action has shown signs of consolidation just below the psychological $3,000 level, technical and on-chain data suggest bulls remain in control for now. The broader rally is supported by rising institutional accumulation, including Bit Digital’s $67.3 million ETH treasury expansion.
Ethereum Price Forecast Table: July 16 2025
| Indicator/Zone | Level / Signal |
| Ethereum price today | $2,989 |
| Resistance 1 | $3,050 |
| Resistance 2 | $3,256 (Fib 0.618 weekly) |
| Support 1 | $2,933 |
| Support 2 | $2,800 |
| RSI (30-min) | 50.1 (Neutral) |
| MACD (30-min) | Weak Bullish Crossover |
| Bollinger Bands (4H) | Expanding, fresh volatility |
| SAR (Daily) | Bullish, below price |
| Bull Market Support Band | $2,202 – $2,459 (support zone) |
| Volume Profile (Weekly POC) | $2,778 (held above) |
| Open Interest (ETH Futures) | $44.09B (+0.67%) |
| Derivatives Bias | Long-Heavy (Binance ratio > 2.4) |
What’s Happening With Ethereum’s Price?
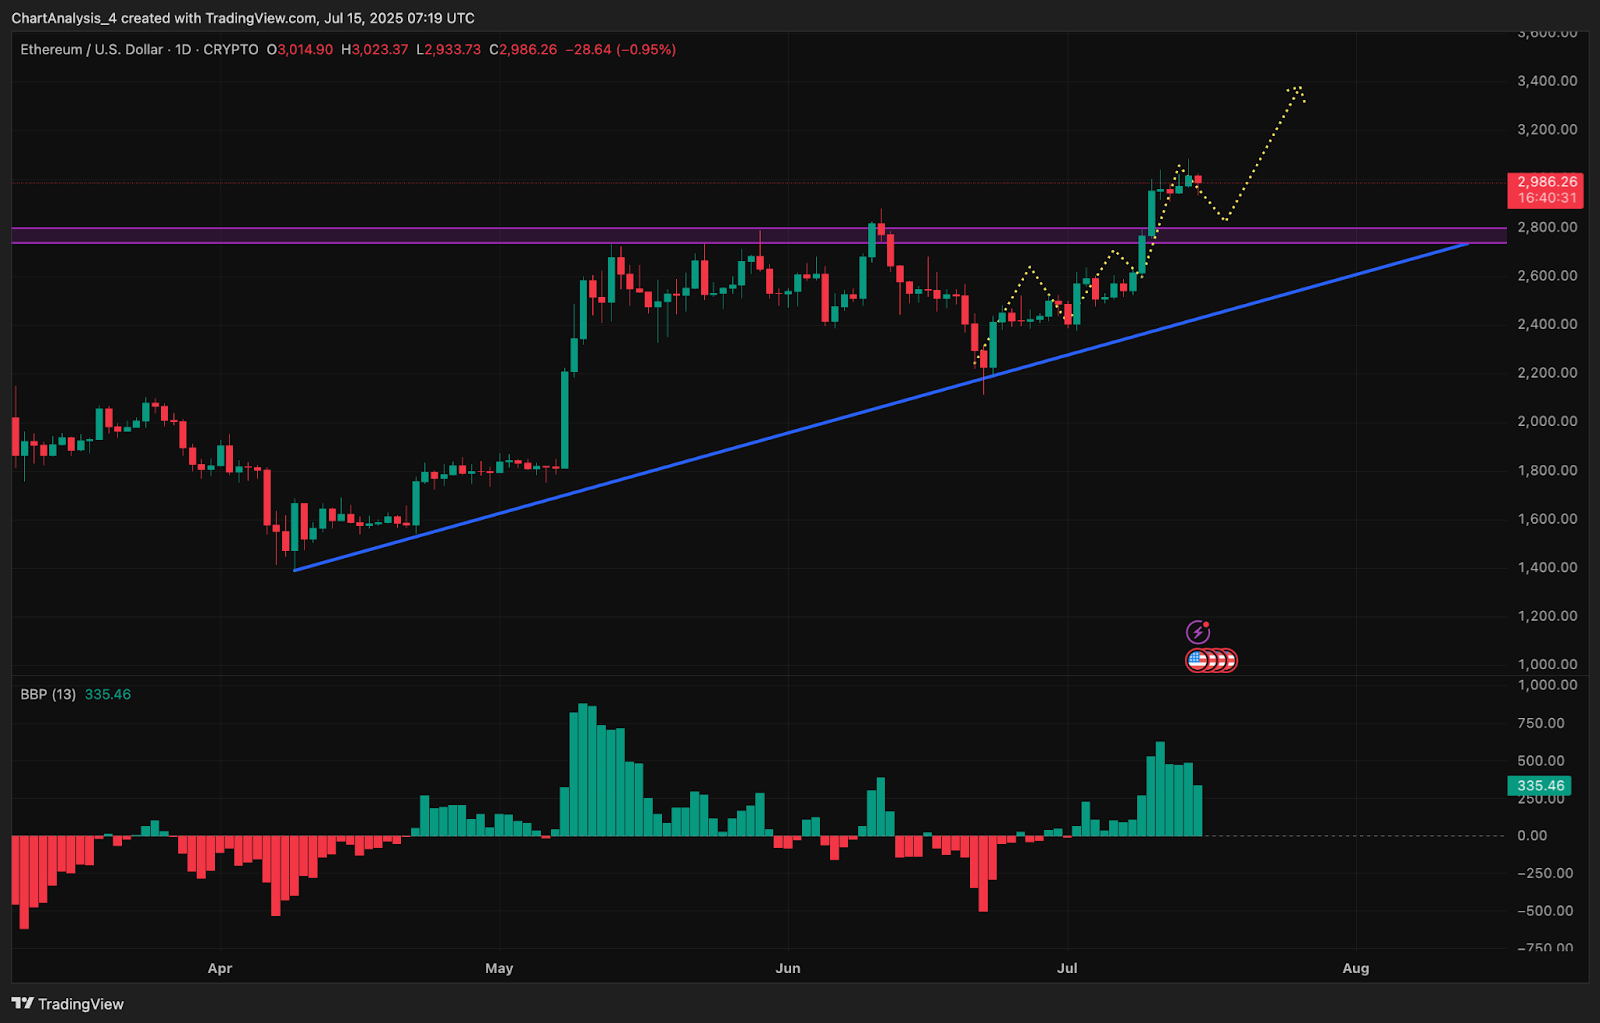
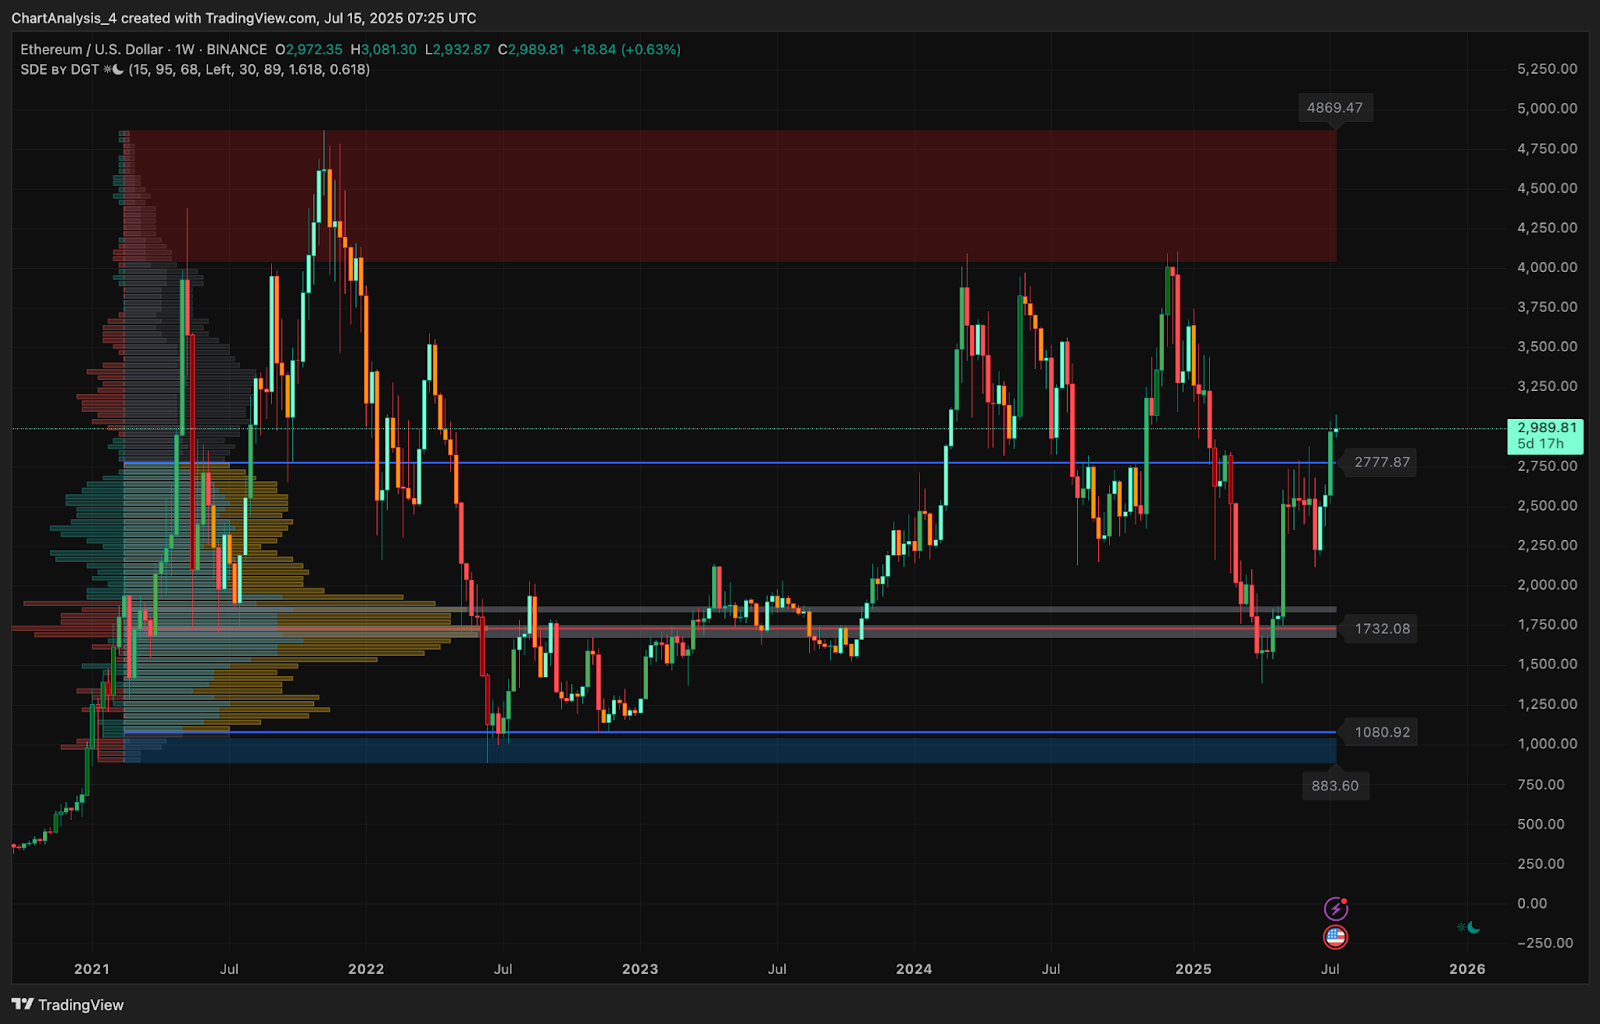
On the daily timeframe, Ethereum price continues to hold above a long-standing ascending trendline stretching from the April swing low near $1,900. A breakout above the $2,800 resistance zone has now flipped that area into key structural support.
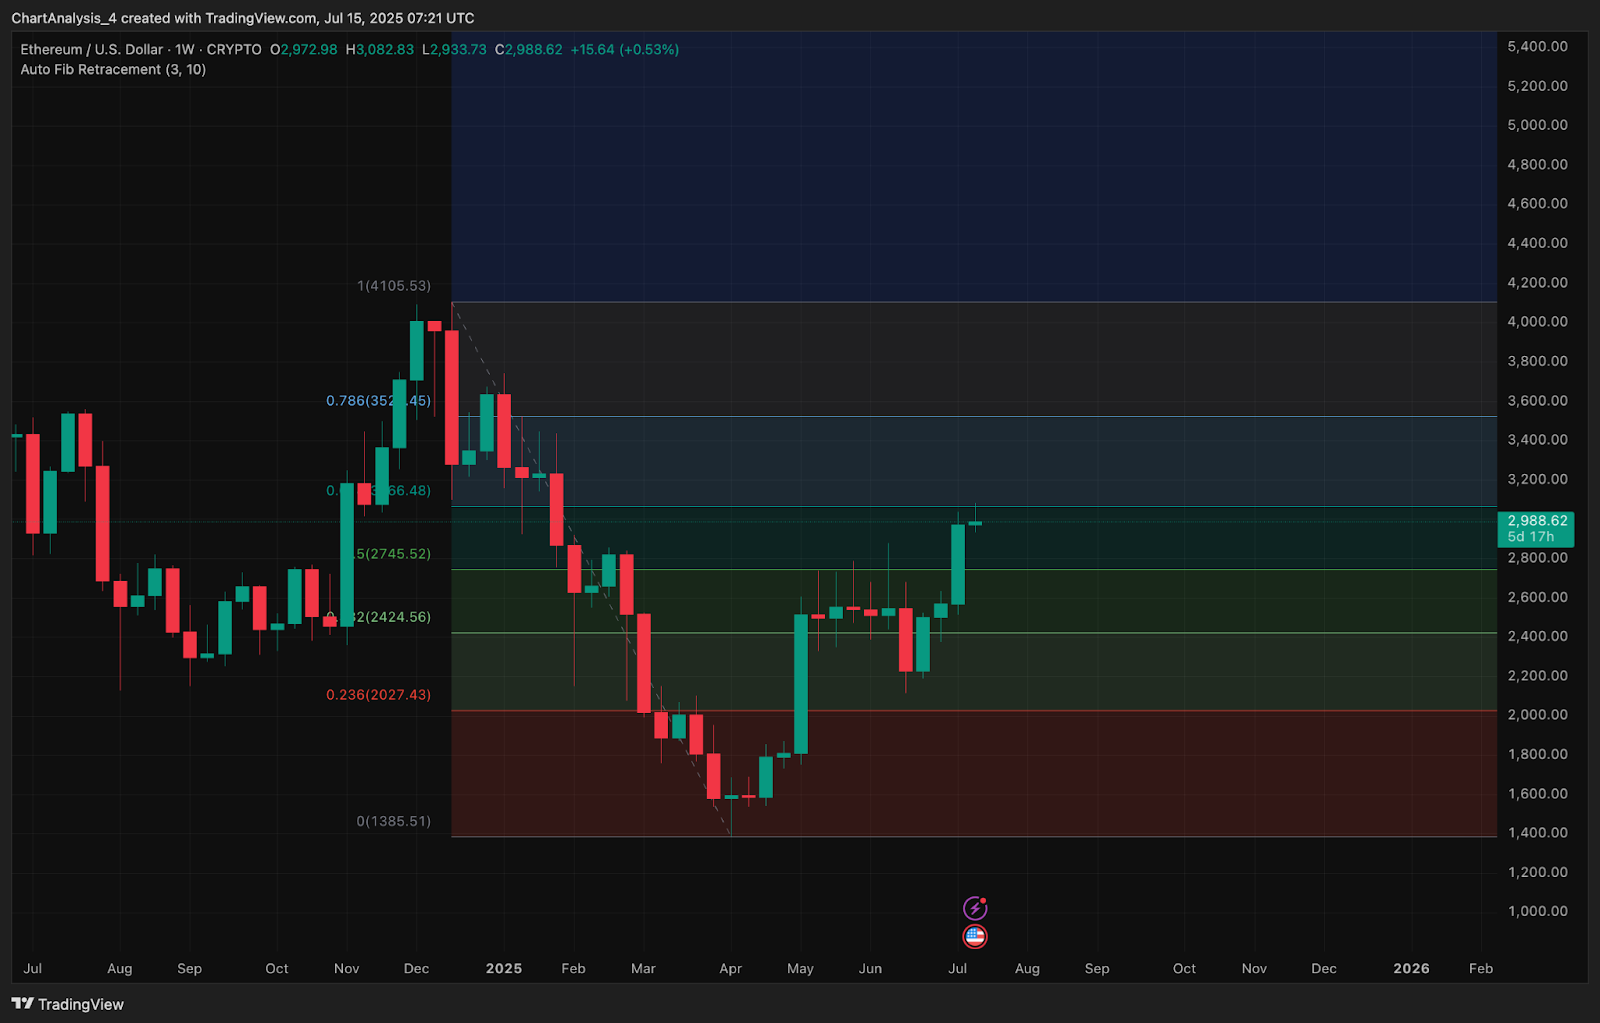
Candles are consolidating just below $3,000, with the next immediate resistance seen near $3,120 and the weekly 0.618 Fibonacci zone at $3,256.
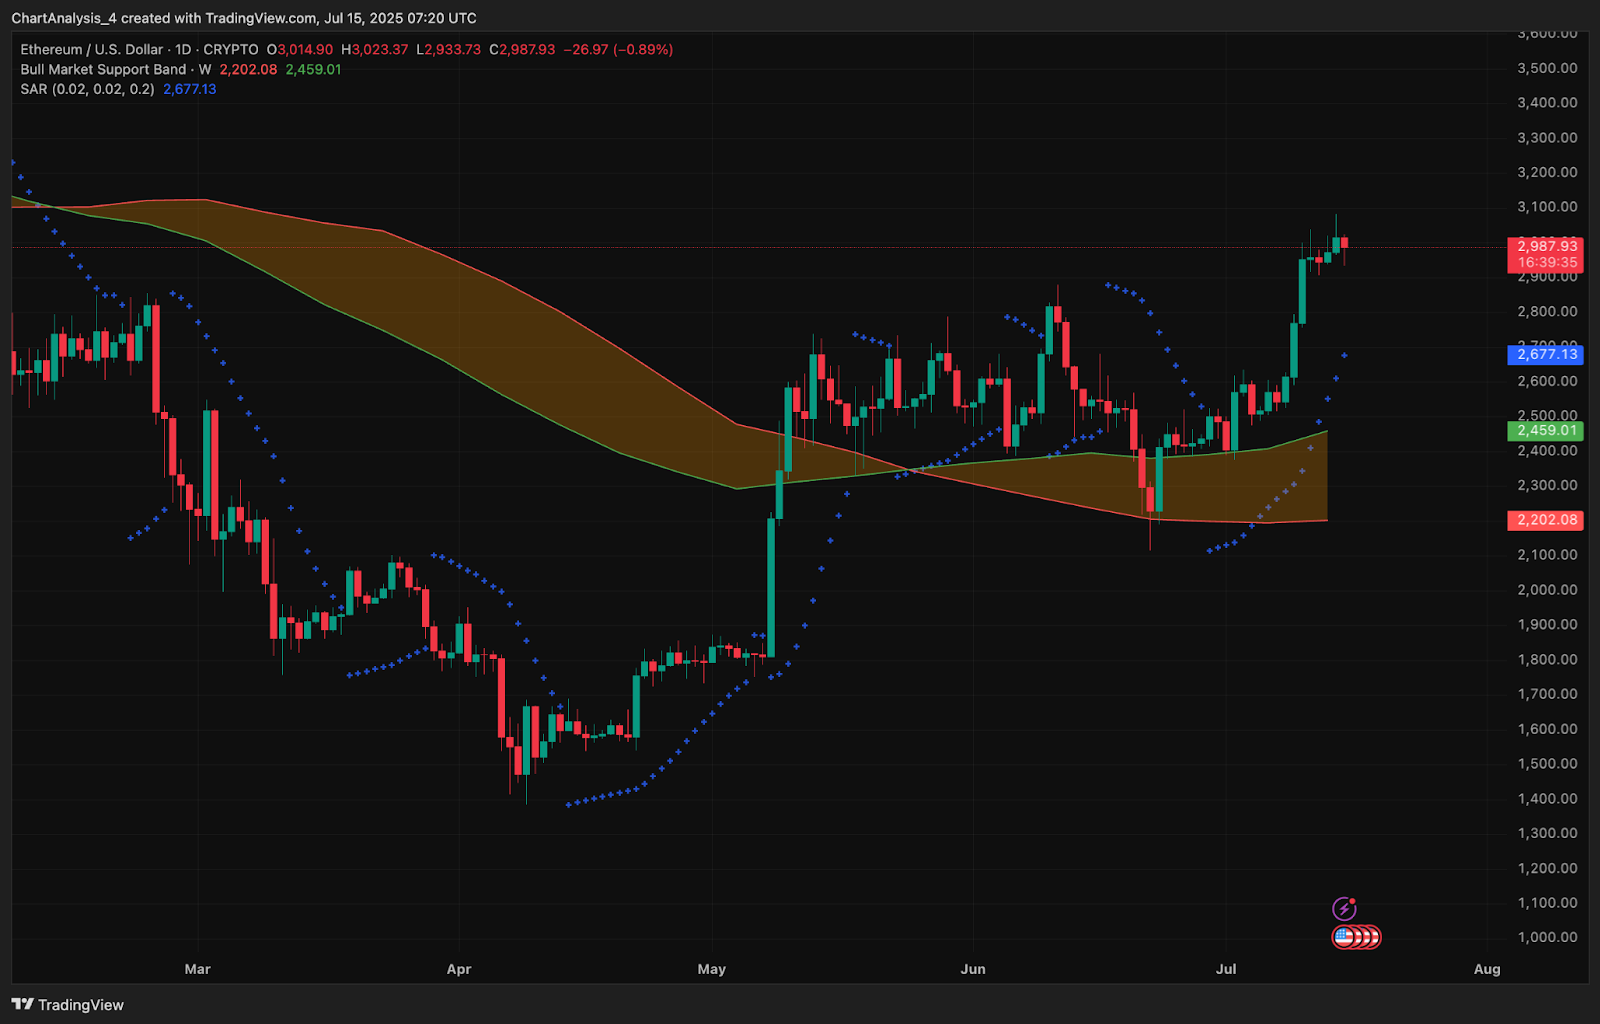
The Parabolic SAR remains below price, indicating continued bullish trend pressure, while Ethereum trades well above the Bull Market Support Band, currently between $2,202 and $2,459. The BBP oscillator also remains positive on the daily timeframe, signaling buyer dominance.
Why Ethereum Price Going Up Today?
The surge in Ethereum price today is partly fueled by renewed institutional interest. Bit Digital announced a $67.3 million direct share offering to expand its ETH treasury, having already converted its entire Bitcoin holdings to Ether. The firm currently holds over 100,600 ETH valued around $301 million. This aggressive accumulation coincides with a broader uptick in crypto markets, where Ethereum has gained 18% over the past week.
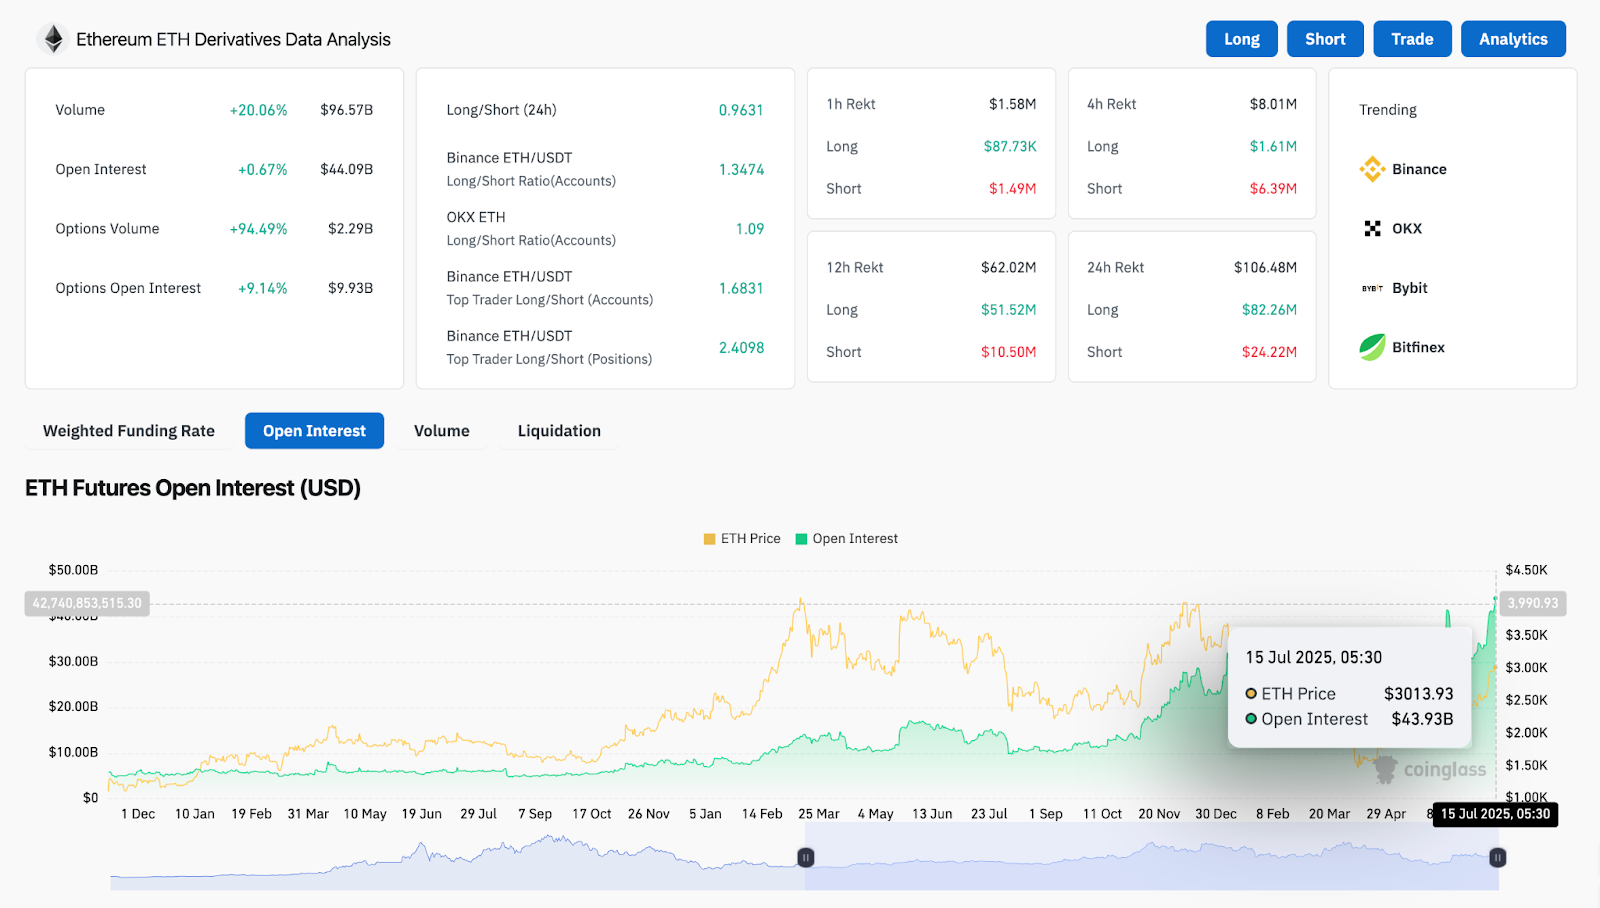
On-chain derivatives data from Coinglass confirms this bullish momentum. Open interest rose to $44.09 billion, while options volume spiked 94.5% to $2.29 billion. The Binance ETH/USDT long/short ratio among top traders is over 2.4, reflecting dominant long positioning. Additionally, total liquidations over 24 hours hit $106.4 million, with $82 million in shorts wiped out, reinforcing bullish dominance.
Bollinger Bands And MACD Suggest Short-Term Volatility Ahead
On the 4-hour chart, Ethereum price action shows the asset pulling back slightly from its recent local high at $3,082. Bollinger Bands have started to expand following a squeeze breakout near $2,750, indicating that fresh volatility is entering the market. Price currently hovers near the mid-band and may test the $2,933 support before attempting another move higher.
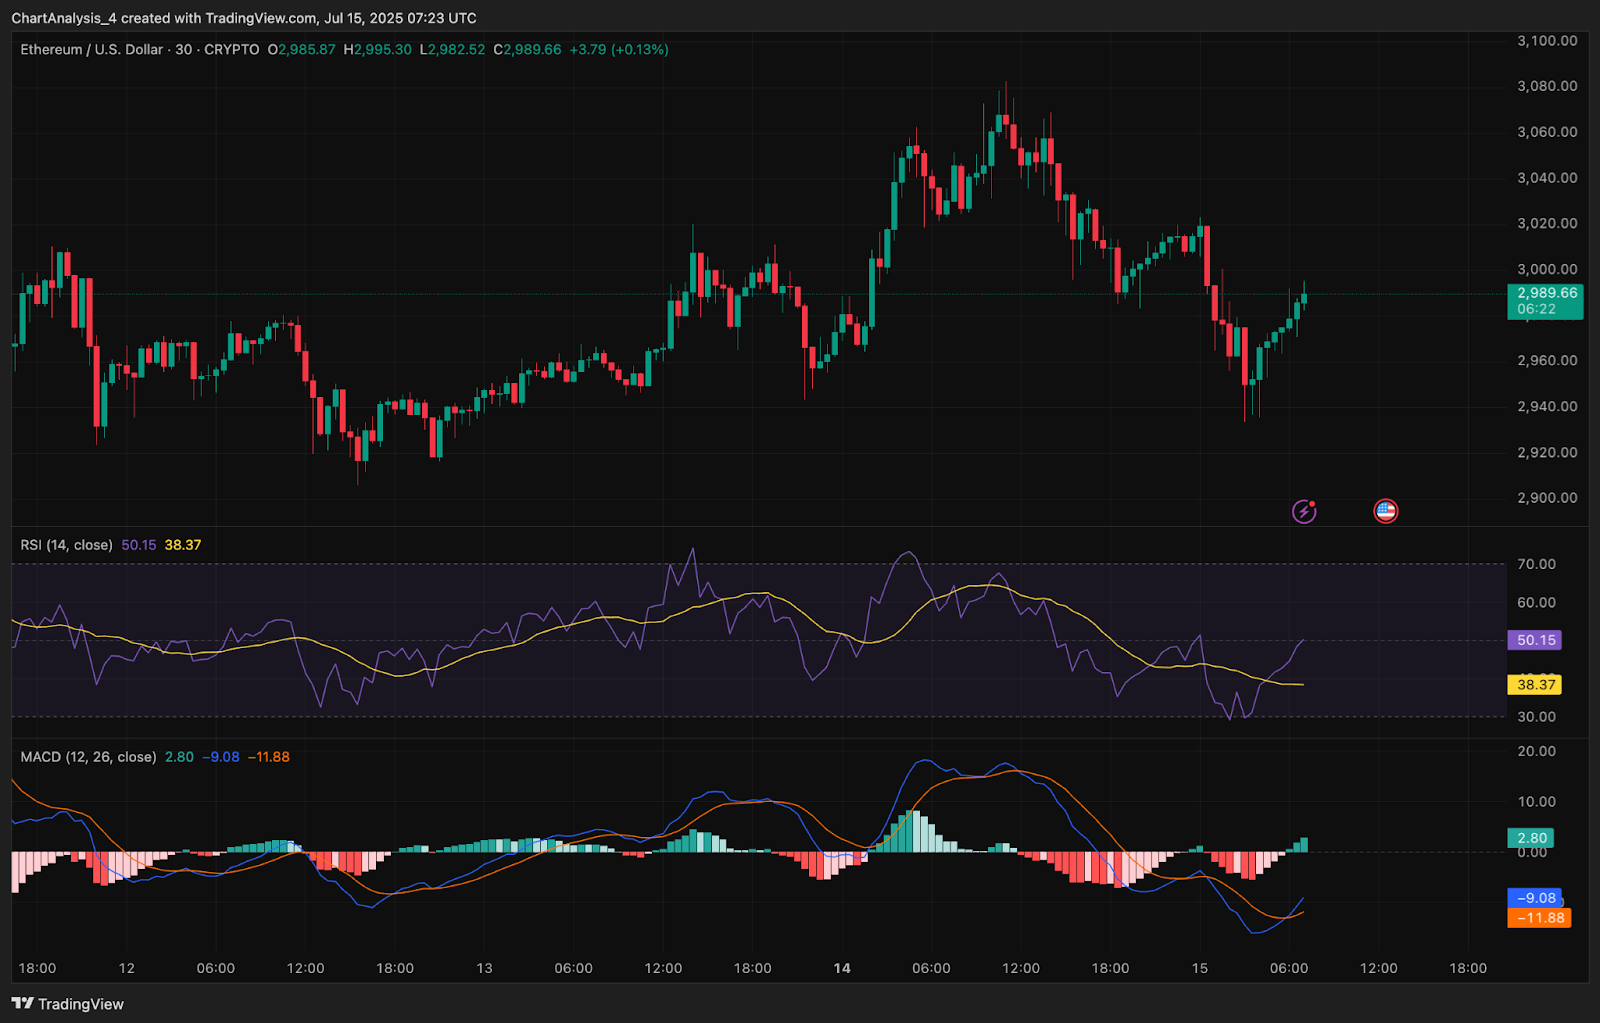
The 30-minute RSI bounced from oversold territory and now sits at 50.1, reflecting a neutral stance after recovering from 38. MACD on the same timeframe is showing signs of a potential bullish crossover, although momentum remains soft for now. A confirmed crossover and a move above the $3,050 resistance would be needed to trigger the next leg toward $3,256.
Ethereum Price Prediction: Short-Term Outlook (24H)
Short-term structure suggests that Ethereum price may retest the $2,933–$2,960 support zone before attempting another breakout toward $3,100. A move above $3,050 with volume confirmation would open up a path toward the 0.618 Fib level at $3,256. On the flip side, if bulls lose the $2,930 handle, Ethereum could slide back toward $2,800, where the previous breakout zone and ascending trendline intersect.
Given the support from both derivatives and on-chain metrics, upside momentum remains intact. However, traders should monitor $3,050 closely as a pivotal breakout threshold.
Disclaimer: The information presented in this article is for informational and educational purposes only. The article does not constitute financial advice or advice of any kind. Coin Edition is not responsible for any losses incurred as a result of the utilization of content, products, or services mentioned. Readers are advised to exercise caution before taking any action related to the company.


