 Price Prediction for July 23")
Following an explosive multi-week rally, Ethereum price is showing signs of fatigue as the market reacts to resistance near the $3,820 supply zone. Ethereum price today is around $3,690, down 1.9% intraday, after slipping below both local VWAP and trendline support. Traders are closely watching the $3,650 to $3,680 region, which could define the next directional move.
What’s Happening With Ethereum’s Price?
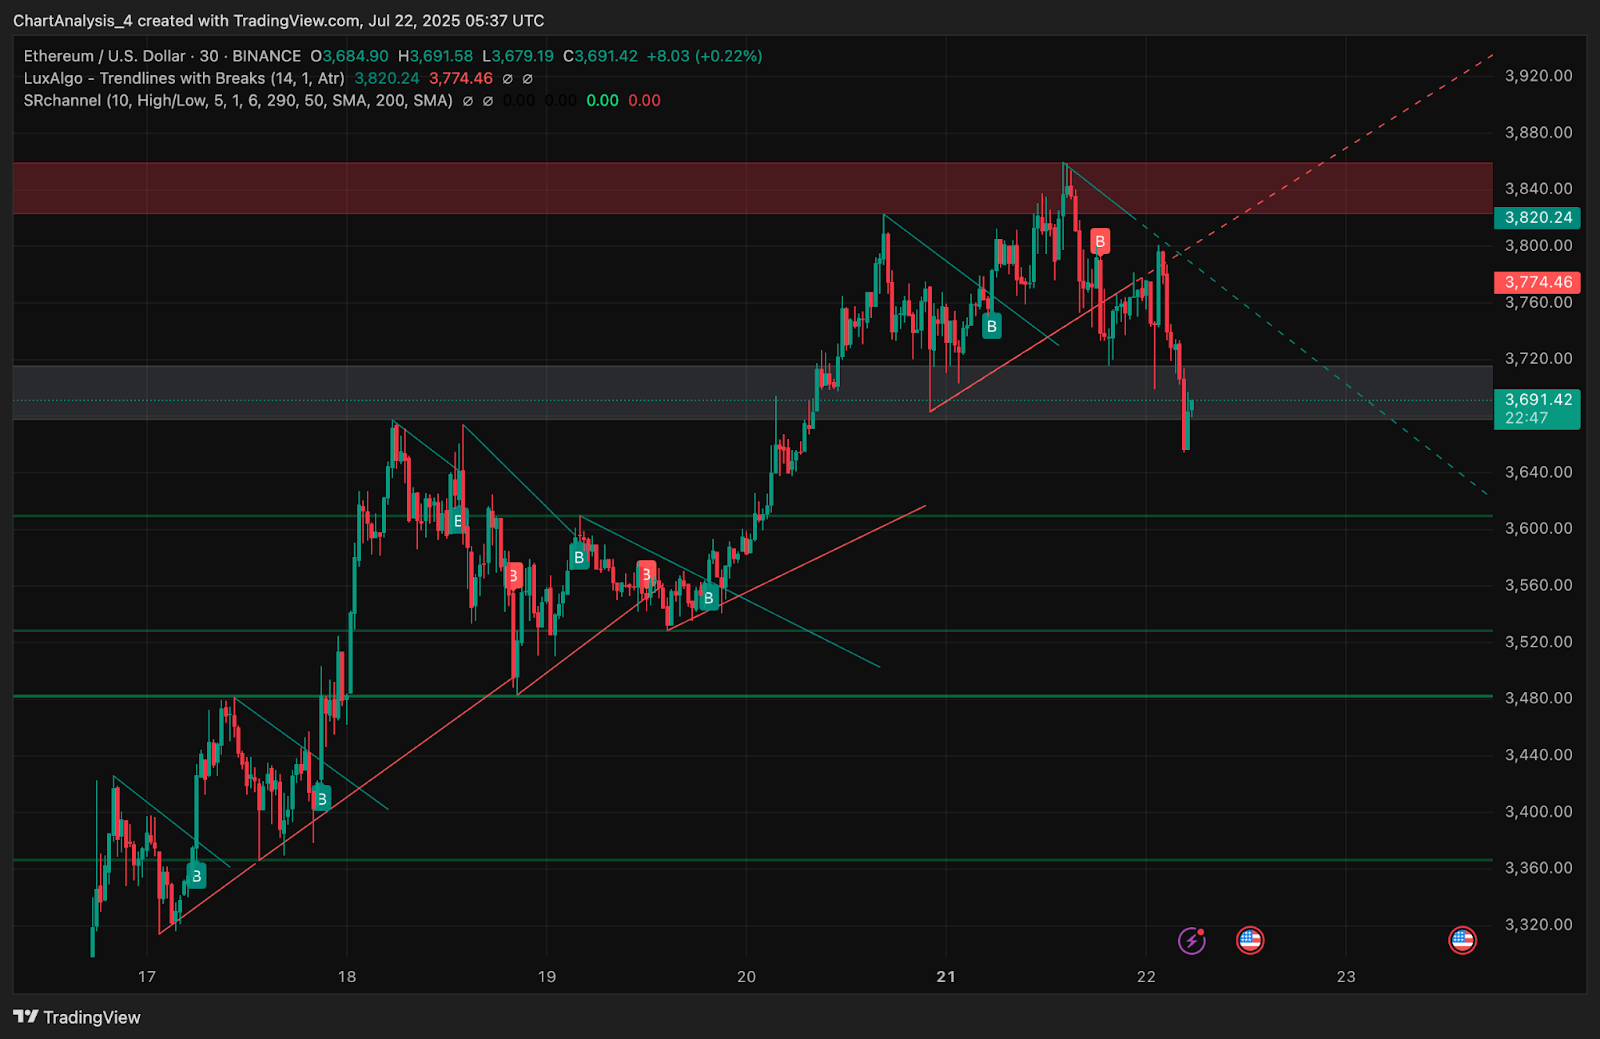
ETH is undergoing a technical rejection after a strong vertical run from $2,800 to nearly $3,820. The 30-minute chart reveals a clean break below a rising wedge structure, followed by a bearish retest of the broken trendline. This shift occurred right after ETH failed to sustain above $3,800, which aligns with key Fibonacci and supply zone resistances.
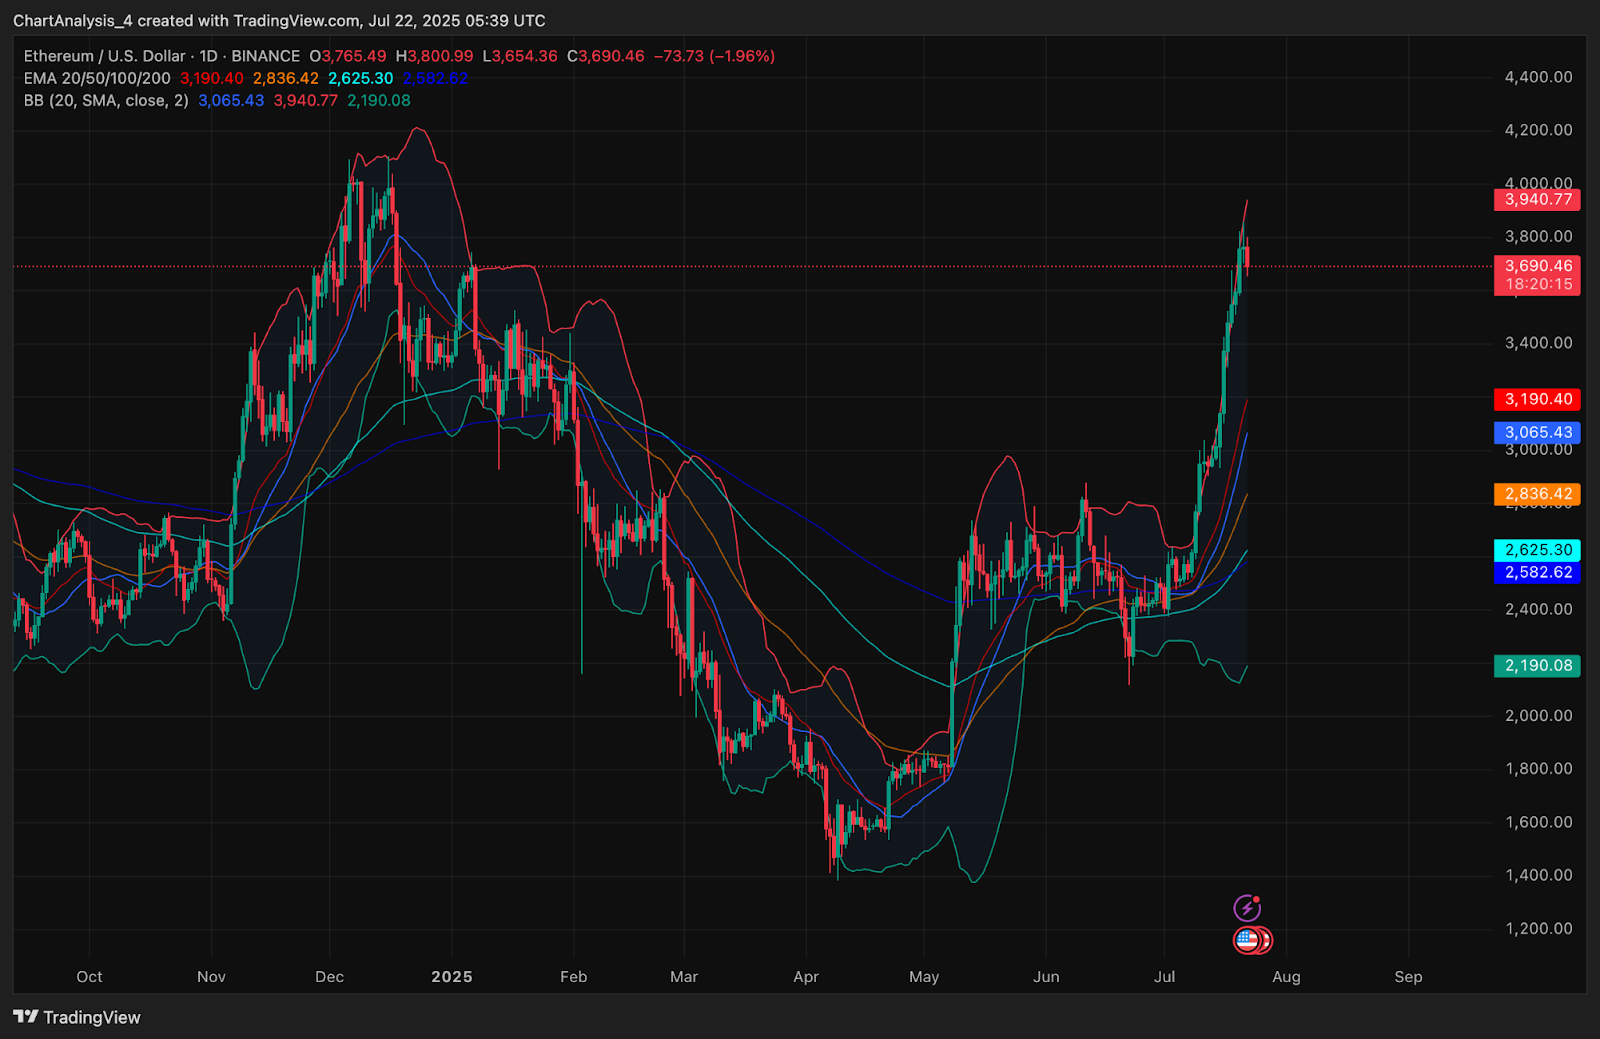
The 1-day chart shows ETH still holding above all major EMAs. However, the daily candle has now cut below the upper Bollinger Band near $3,940, which had expanded significantly during the recent surge. This suggests that Ethereum price volatility may begin contracting, particularly if the $3,650 to $3,600 region does not hold as support.
Why Is The Ethereum Price Going Down Today?
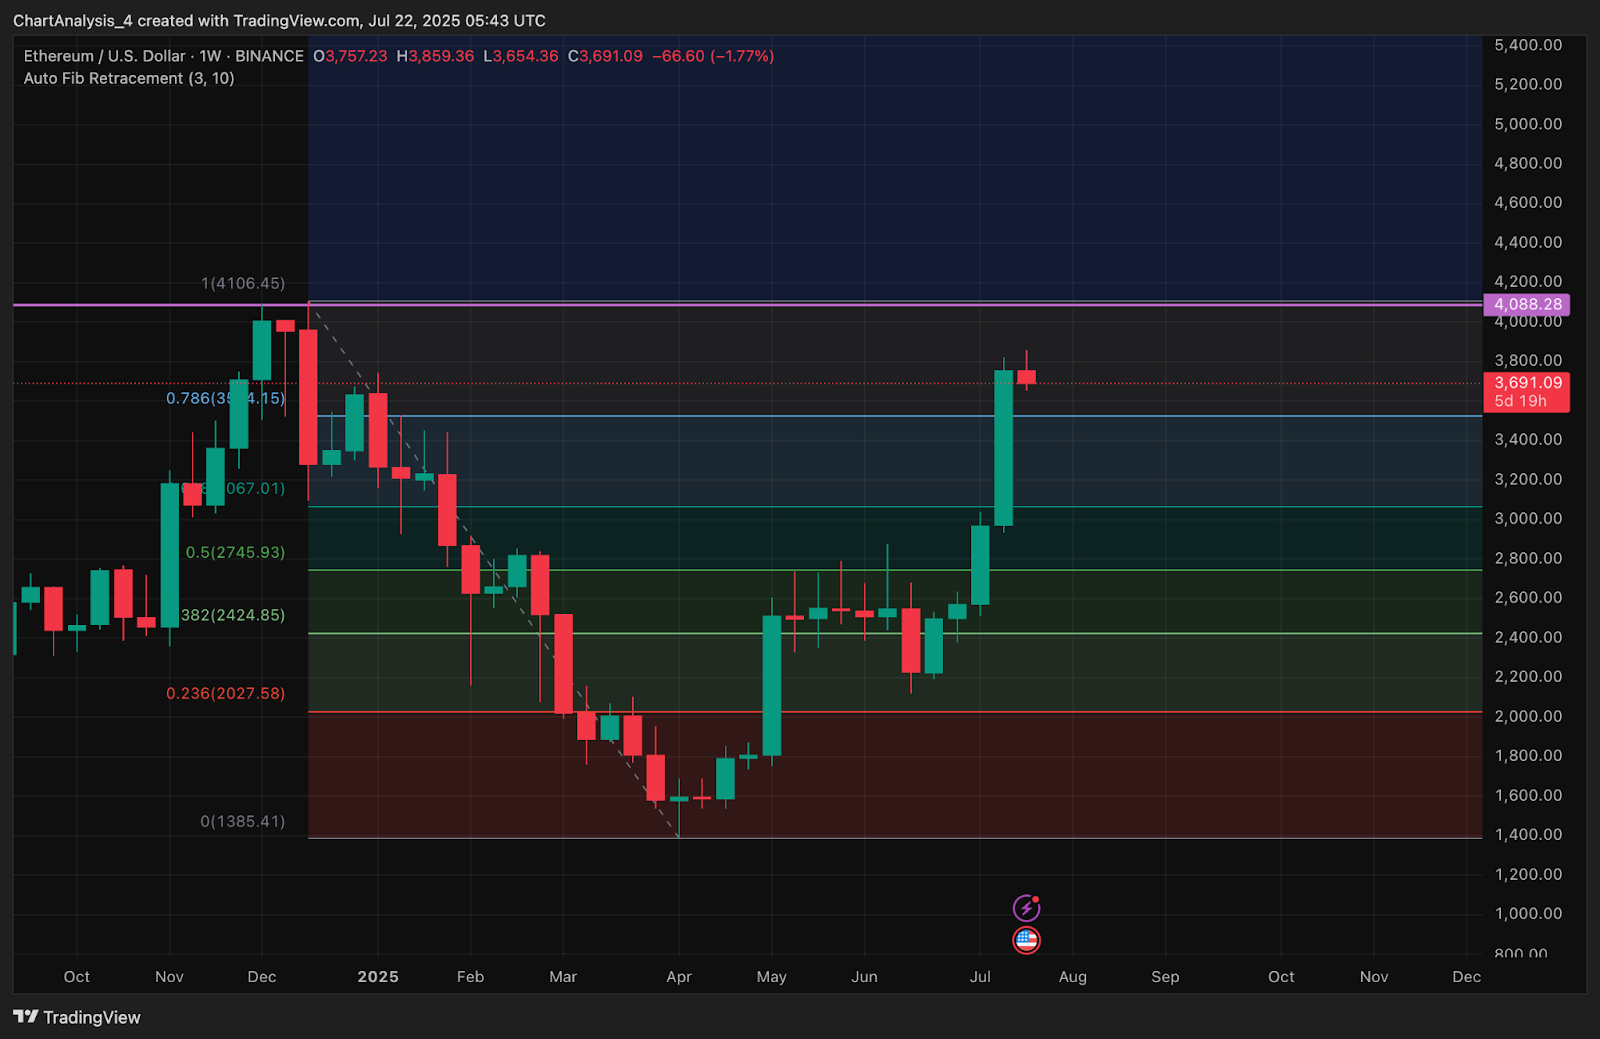
Why Ethereum price going down today stems from two key pressures. The first is a confluence of historical resistance levels. The second is visible profit-taking from leveraged traders. On the weekly chart, ETH touched the 0.786 Fibonacci retracement at $3,624, measured from the November 2024 to April 2025 decline, before reversing lower. This area had previously triggered multiple rejections, and current price action appears to be repeating that pattern.
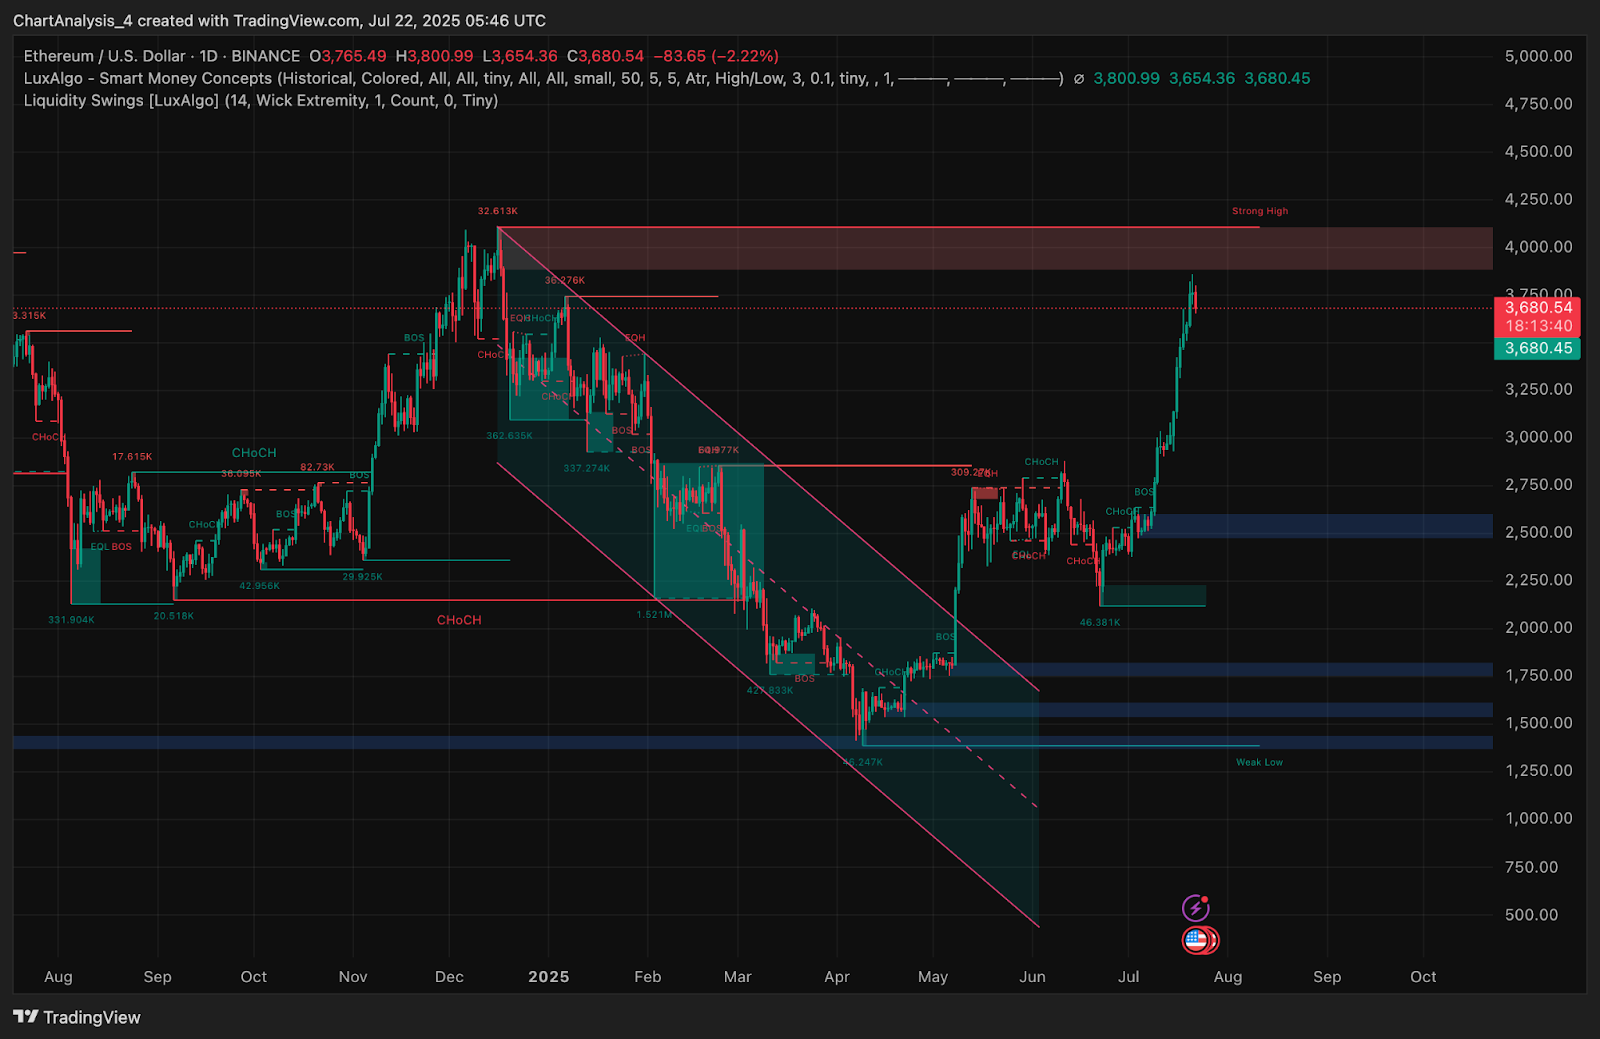
Smart Money Concept indicators confirm a short-term change of character below the $3,750 region. ETH also failed to break through the $3,820 to $3,940 supply block, which is clearly highlighted on both daily and LuxAlgo charts. This now places downside pressure targeting demand clusters between $3,600 and $3,500.
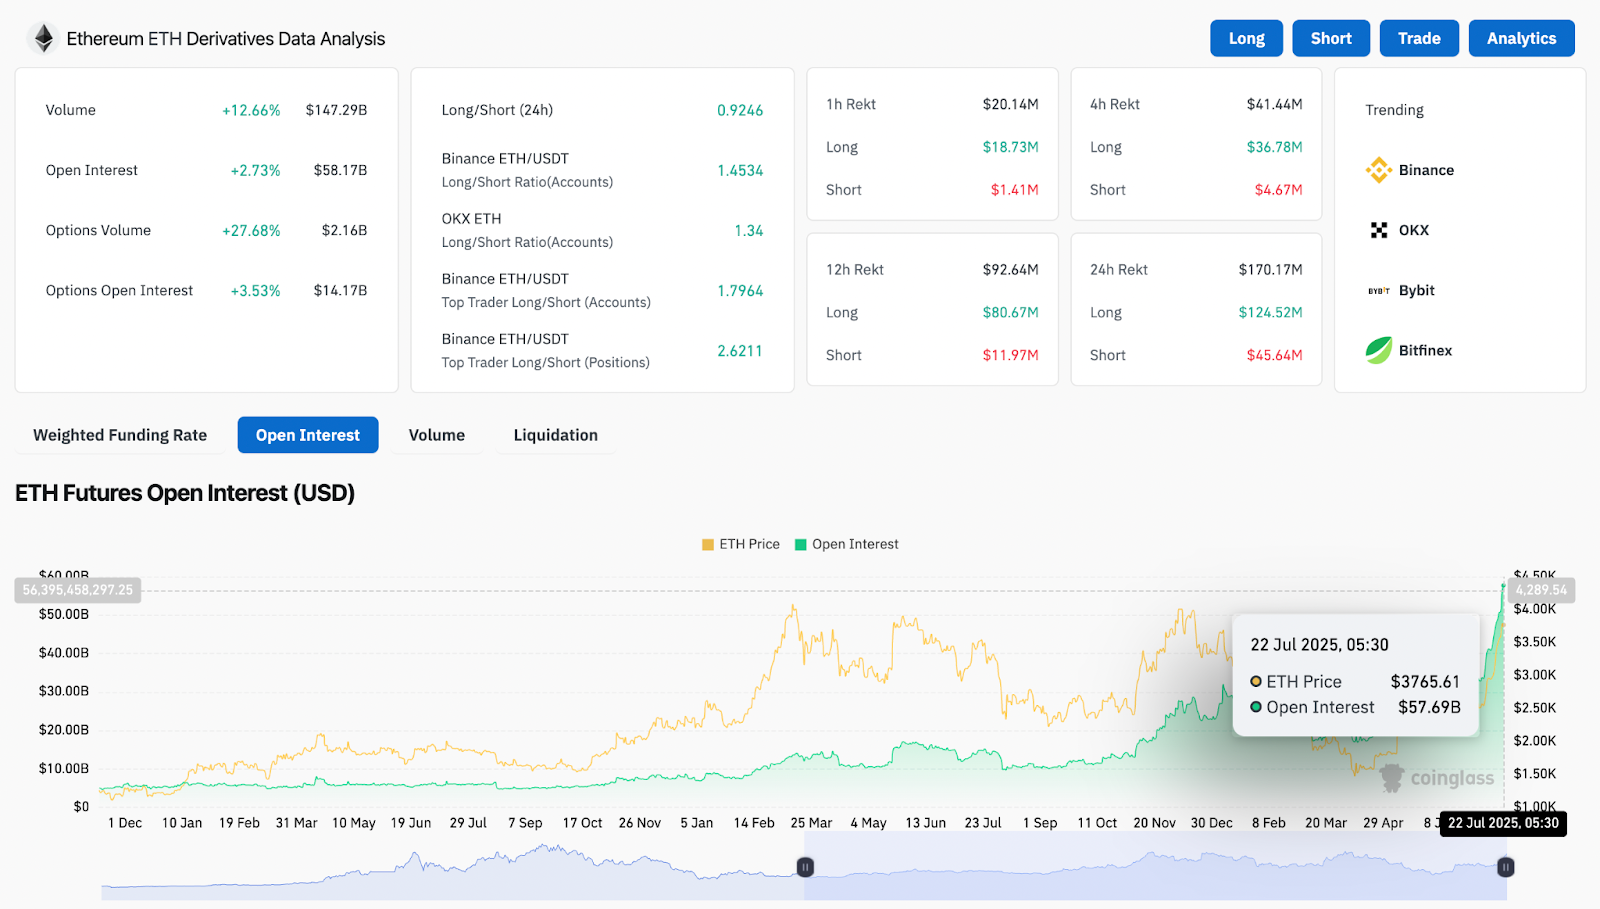
On-chain positioning and futures data support this outlook. According to Coinglass, Ethereum’s 24-hour volume is up by 12.6 percent to $147.29 billion, while open interest climbed only 2.73 percent. This shows that volume is driven by liquidations or profit exits rather than fresh conviction. The Binance top trader long to short ratio is 2.62, indicating that longs are heavily exposed and more vulnerable if $3,650 fails.
EMA Structure, SAR, and VWAP Levels Confirm Breakdown Potential
On the 1-day chart, ETH has extended well above the 200 EMA at $2,582 and 100 EMA at $2,625. However, price is now reverting toward the mid-Bollinger line around $3,065. This could act as a medium-term pullback zone if support levels do not hold.
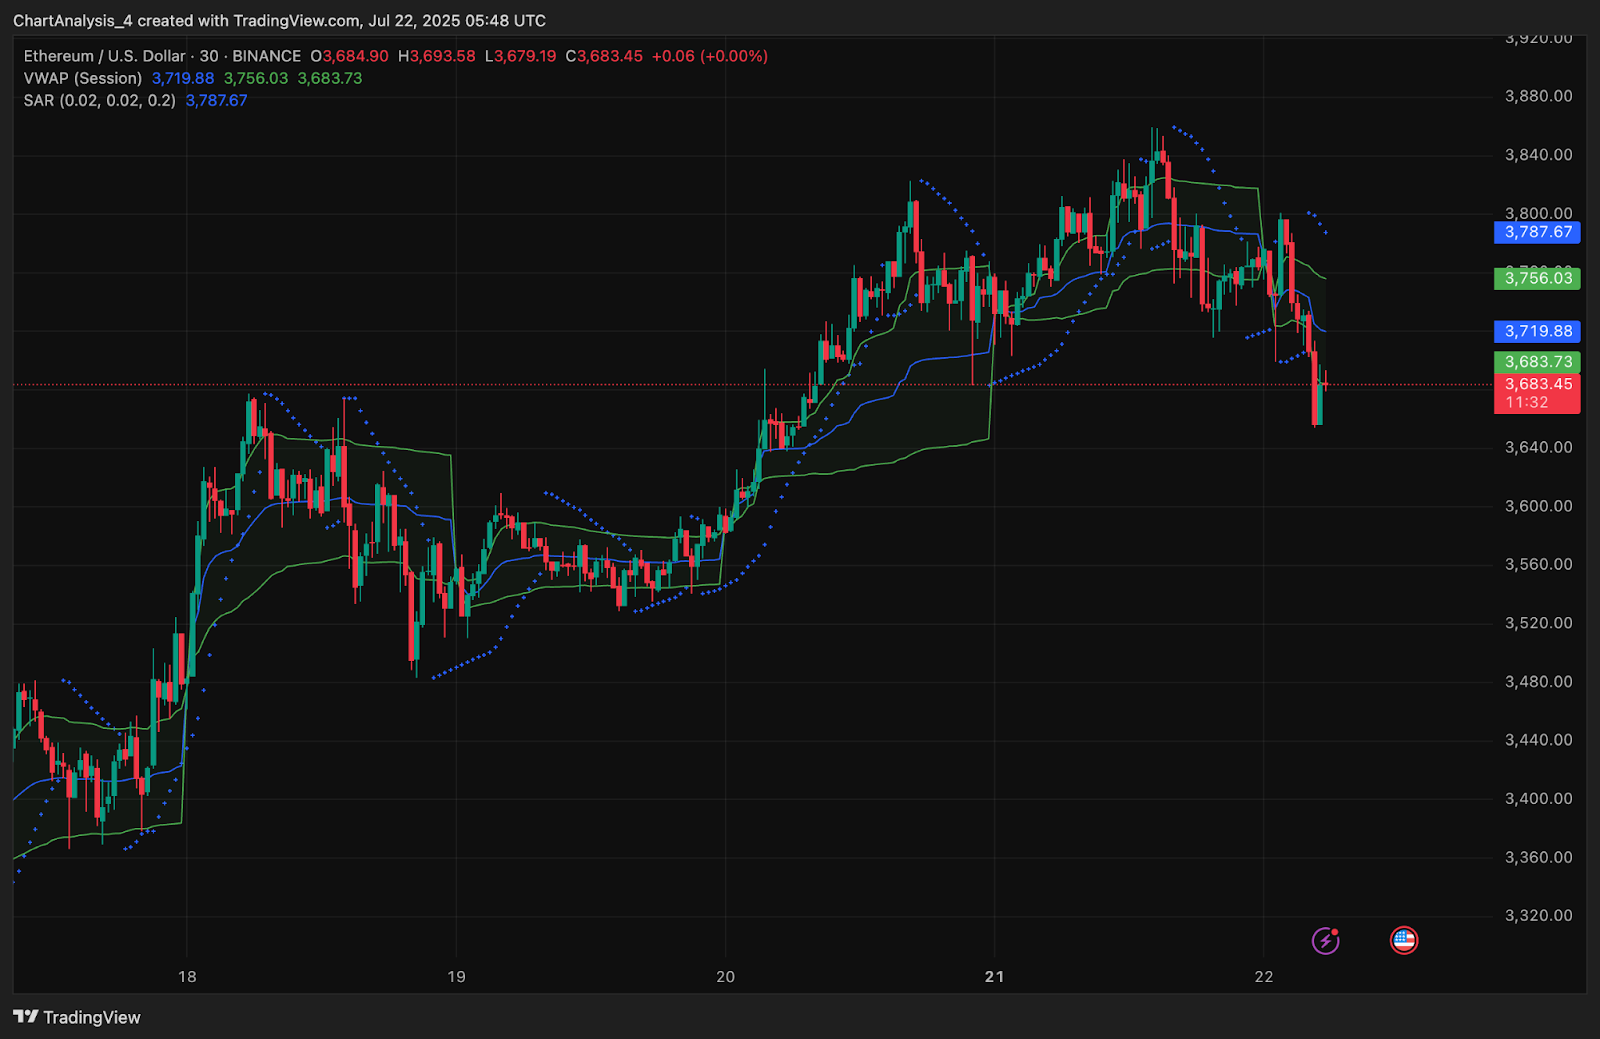
Short-term charts including the 30-minute and 4-hour reveal a more cautious picture. The Supertrend on the 4-hour chart has not yet flipped bearish, but the Parabolic SAR has already turned negative. VWAP is being rejected on multiple candles, and price is pressing against the lower Bollinger Band, increasing the risk of acceleration toward $3,600 or lower.
The immediate support structure lies around $3,590 followed by $3,520. These levels correspond to previous breakout zones. If sellers push below them, the next potential target becomes the $3,380 to $3,400 liquidity region from mid-July.
ETH Price Prediction: Short-Term Outlook (24H)
At present, Ethereum price today is correcting inside a larger bullish trend. If ETH confirms an hourly close below $3,650, it may drop further into the $3,590 to $3,520 zone. Deeper targets include $3,380 and $3,200, where price last consolidated before the recent breakout.
A bounce above VWAP at $3,719 and recovery into the $3,750 to $3,780 range would be needed for bulls to reattempt $3,820. However, this would require fresh volume and improved sentiment in the derivatives market.
With Parabolic SAR flipping, VWAP resistance, and long exposure climbing, ETH remains vulnerable to more downside unless buyers strongly defend current support.
Ethereum Price Forecast Table: July 23, 2025
| Indicator/Zone | Level / Signal |
| Ethereum price today | $3,690 |
| Resistance 1 | $3,750 |
| Resistance 2 | $3,820 to $3,940 (supply zone top) |
| Support 1 | $3,650 |
| Support 2 | $3,520 |
| VWAP (30-min) | $3,719 (price below, bearish rejection) |
| Parabolic SAR (30-min) | Dots above price (bearish) |
| EMA 20/50/100/200 (1D) | All stacked below (bullish long-term) |
| Bollinger Bands (1D) | Retracing from upper band ($3,940) |
| Fib Resistance (Weekly) | 0.786 at $3,624 (tested, reversed) |
| Open Interest (Coinglass) | $58.17B (+2.73%), high long exposure |
| Binance Top Trader Ratio | 2.6211 (long-heavy, vulnerable) |
Disclaimer: The information presented in this article is for informational and educational purposes only. The article does not constitute financial advice or advice of any kind. Coin Edition is not responsible for any losses incurred as a result of the utilization of content, products, or services mentioned. Readers are advised to exercise caution before taking any action related to the company.


 Price Prediction: Canton Eyes Key Break After Market Activity Spike")

