 Price Prediction for July 24")
Ethereum price is trading near $3,705 on July 23, stabilizing after its powerful rally from sub-$2,200 levels earlier this month. The current structure shows ETH price consolidating below a key descending trendline near $3,780–$3,820. This setup suggests that Ethereum is nearing a volatility inflection point, with directional momentum likely to return soon.
What’s Happening With Ethereum’s Price?
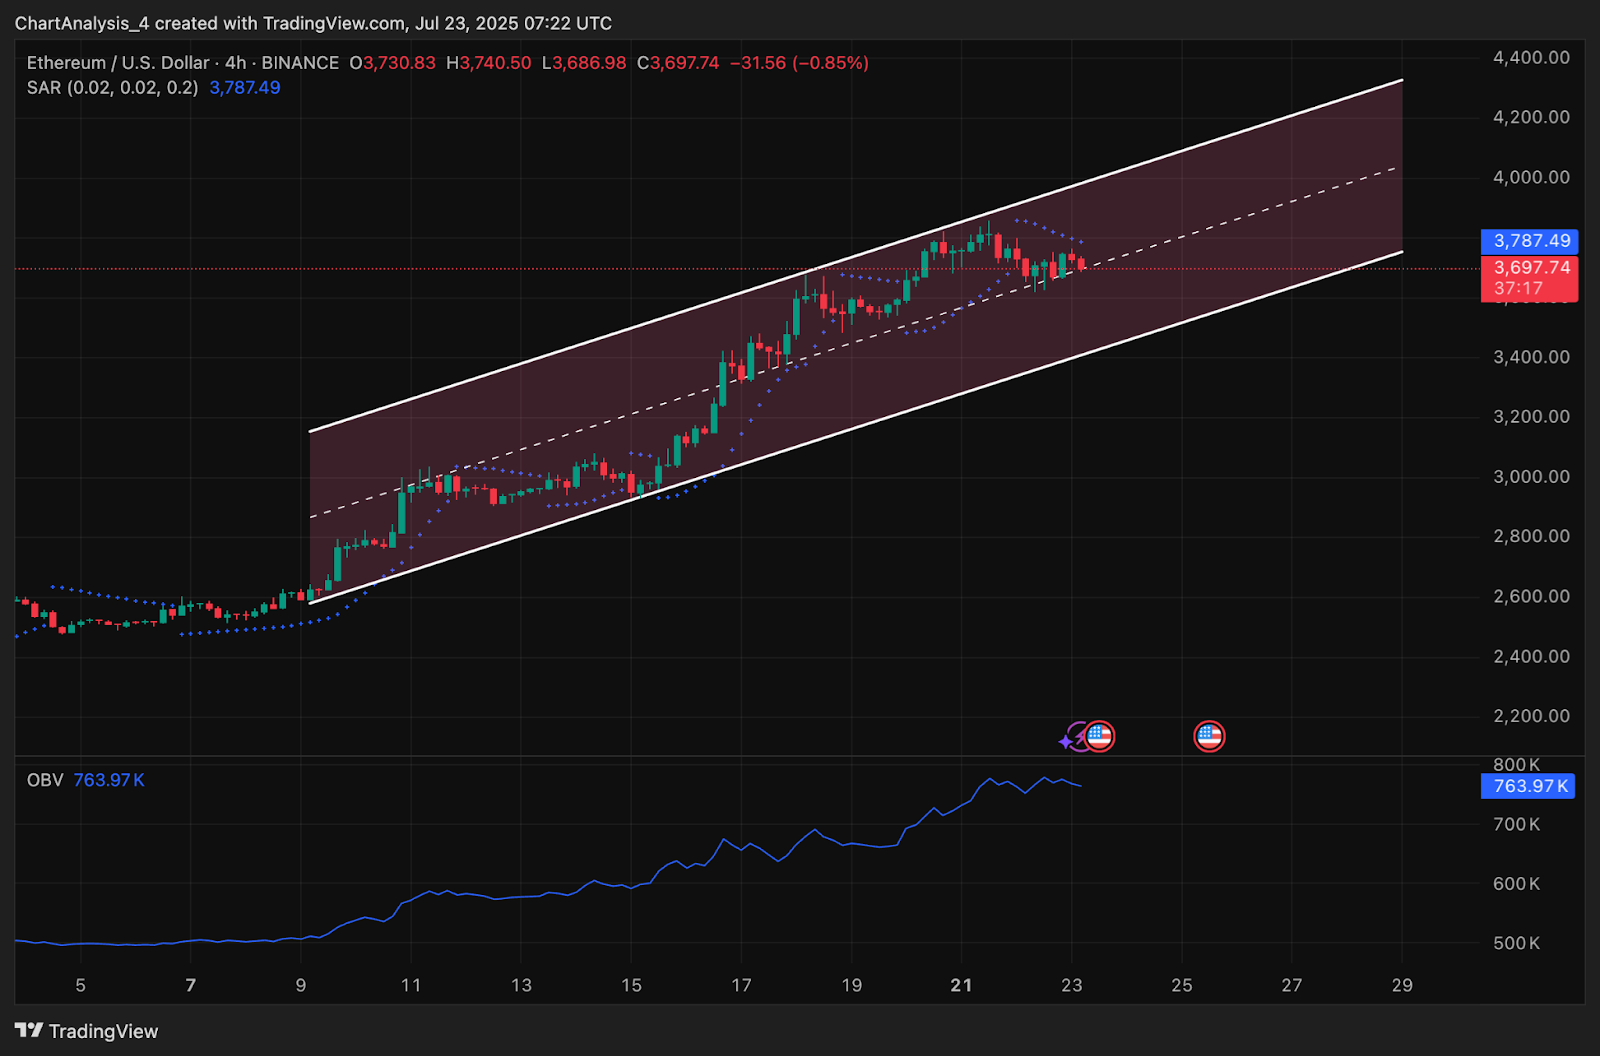
Ethereum has formed a high-compression symmetrical triangle on the 4-hour chart, with higher lows gradually pressing against a fixed horizontal resistance. Price action is currently wedged between $3,665 and $3,790, with buyers defending the rising trendline since July 5.
The recent move above $3,500 invalidated a multi-week bearish flag and flipped multiple higher timeframe EMAs. Since then, the rally has matured into consolidation as ETH price prepares for its next move. On-balance volume (OBV) remains elevated, printing around 1.24 billion on the 4-hour, confirming consistent spot accumulation through the structure.
Parabolic SAR dots continue trailing below price, showing that the short-term uptrend is still intact, albeit weakening.
Why Is The Ethereum Price Going Down Today?
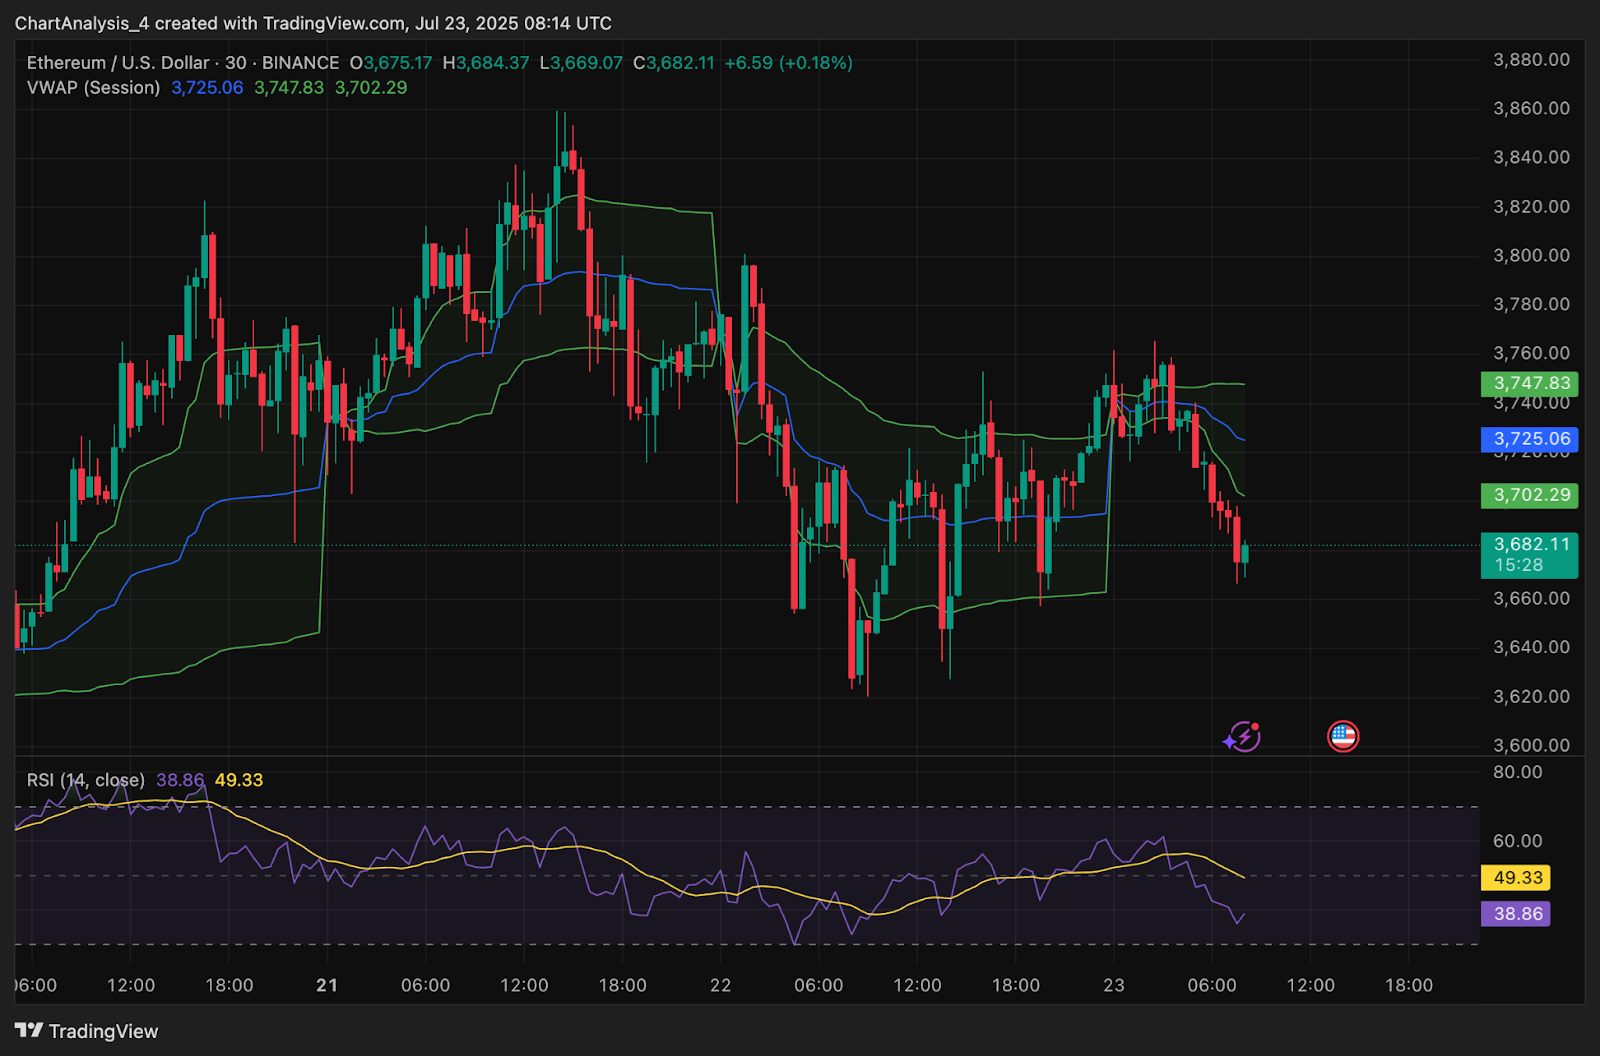
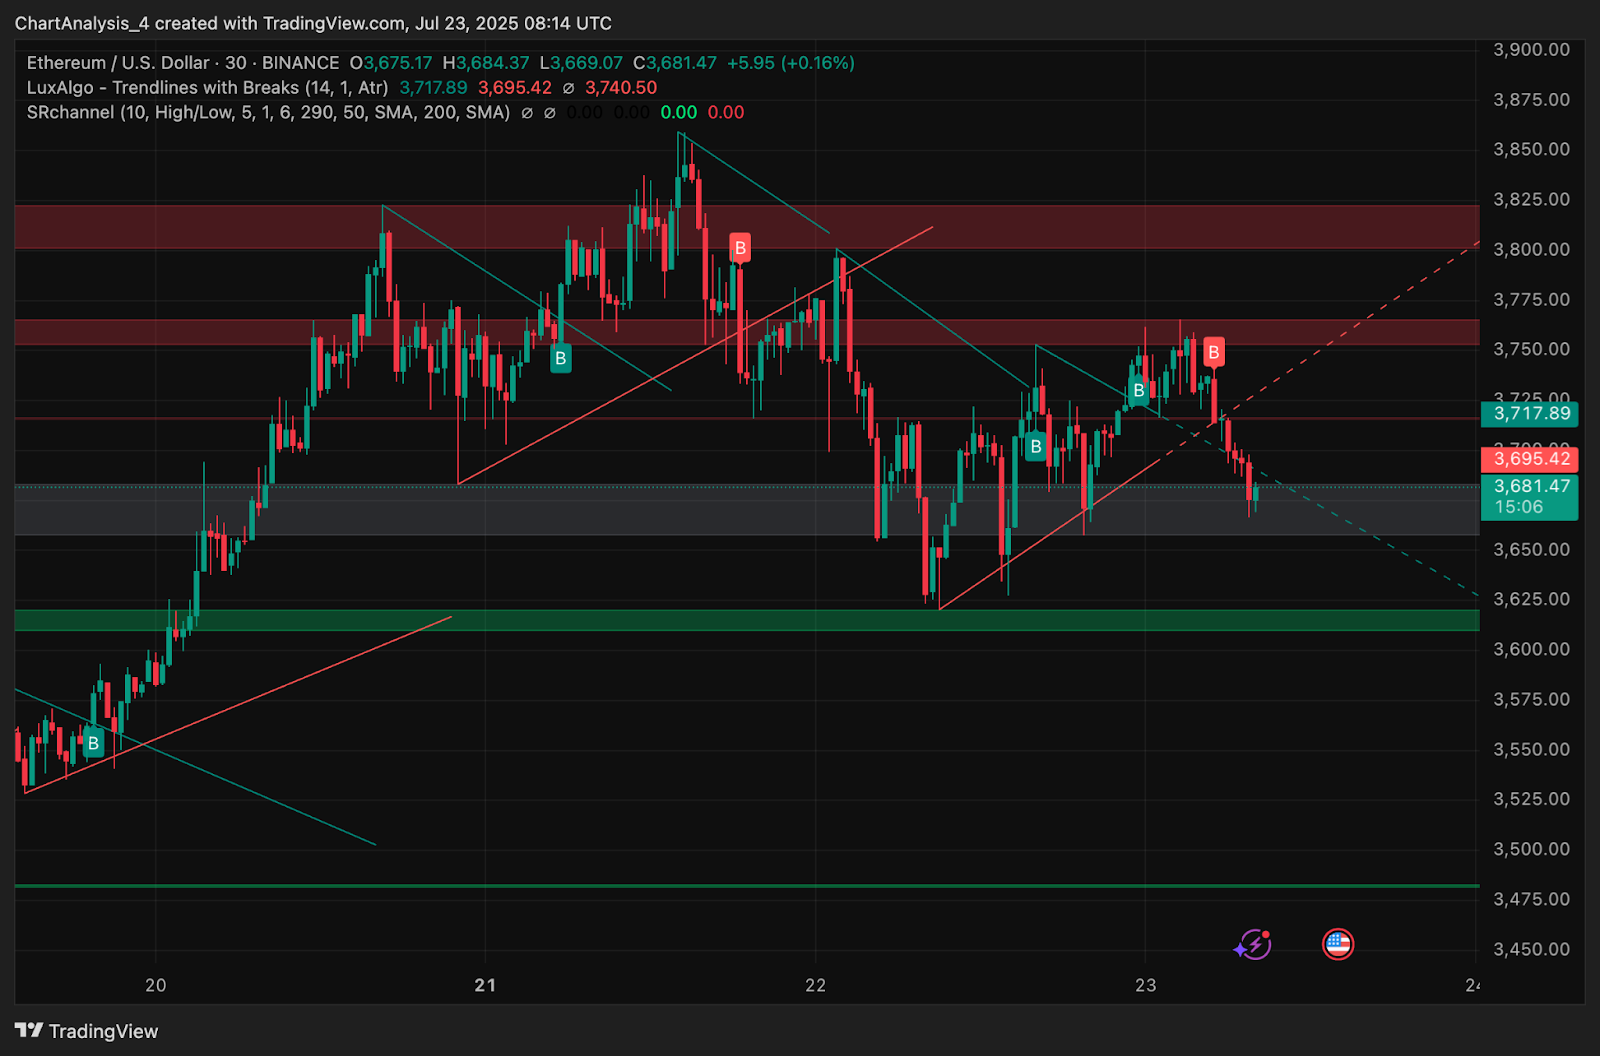
Why Ethereum price going down today relates to intraday rejection from $3,790, a zone which has capped price multiple times in July. On the 30-minute chart, ETH shows signs of fatigue, with two failed attempts to reclaim $3,780. VWAP also acted as resistance at $3,774, while the RSI has dipped below 47, suggesting weakening buying pressure.
MACD on the same timeframe has flattened, showing reduced momentum, and the +DI is declining on DMI, with ADX turning sideways.
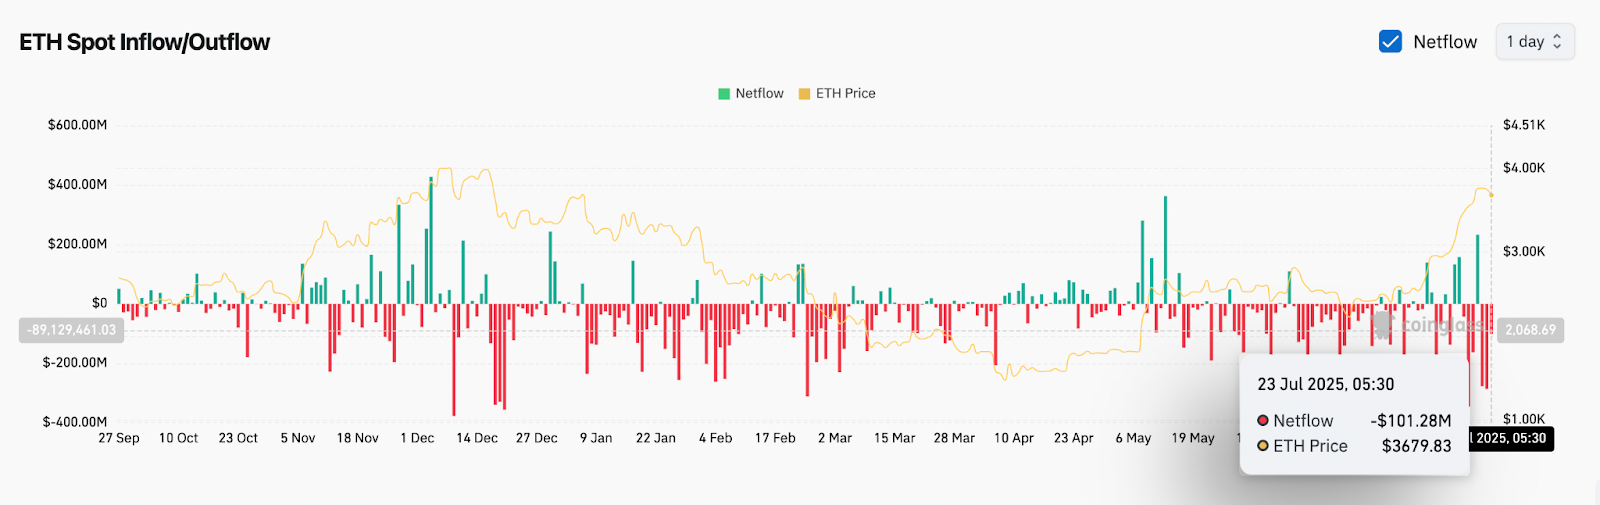
However, capital flows remain net positive. Ethereum’s 24-hour spot netflow stands at +$8.79 million, suggesting underlying investor conviction despite the short-term resistance. Unless ETH breaks below $3,645 (triangle base), the broader bullish structure remains valid.
Bollinger Bands and EMAs Point to Squeeze Setup
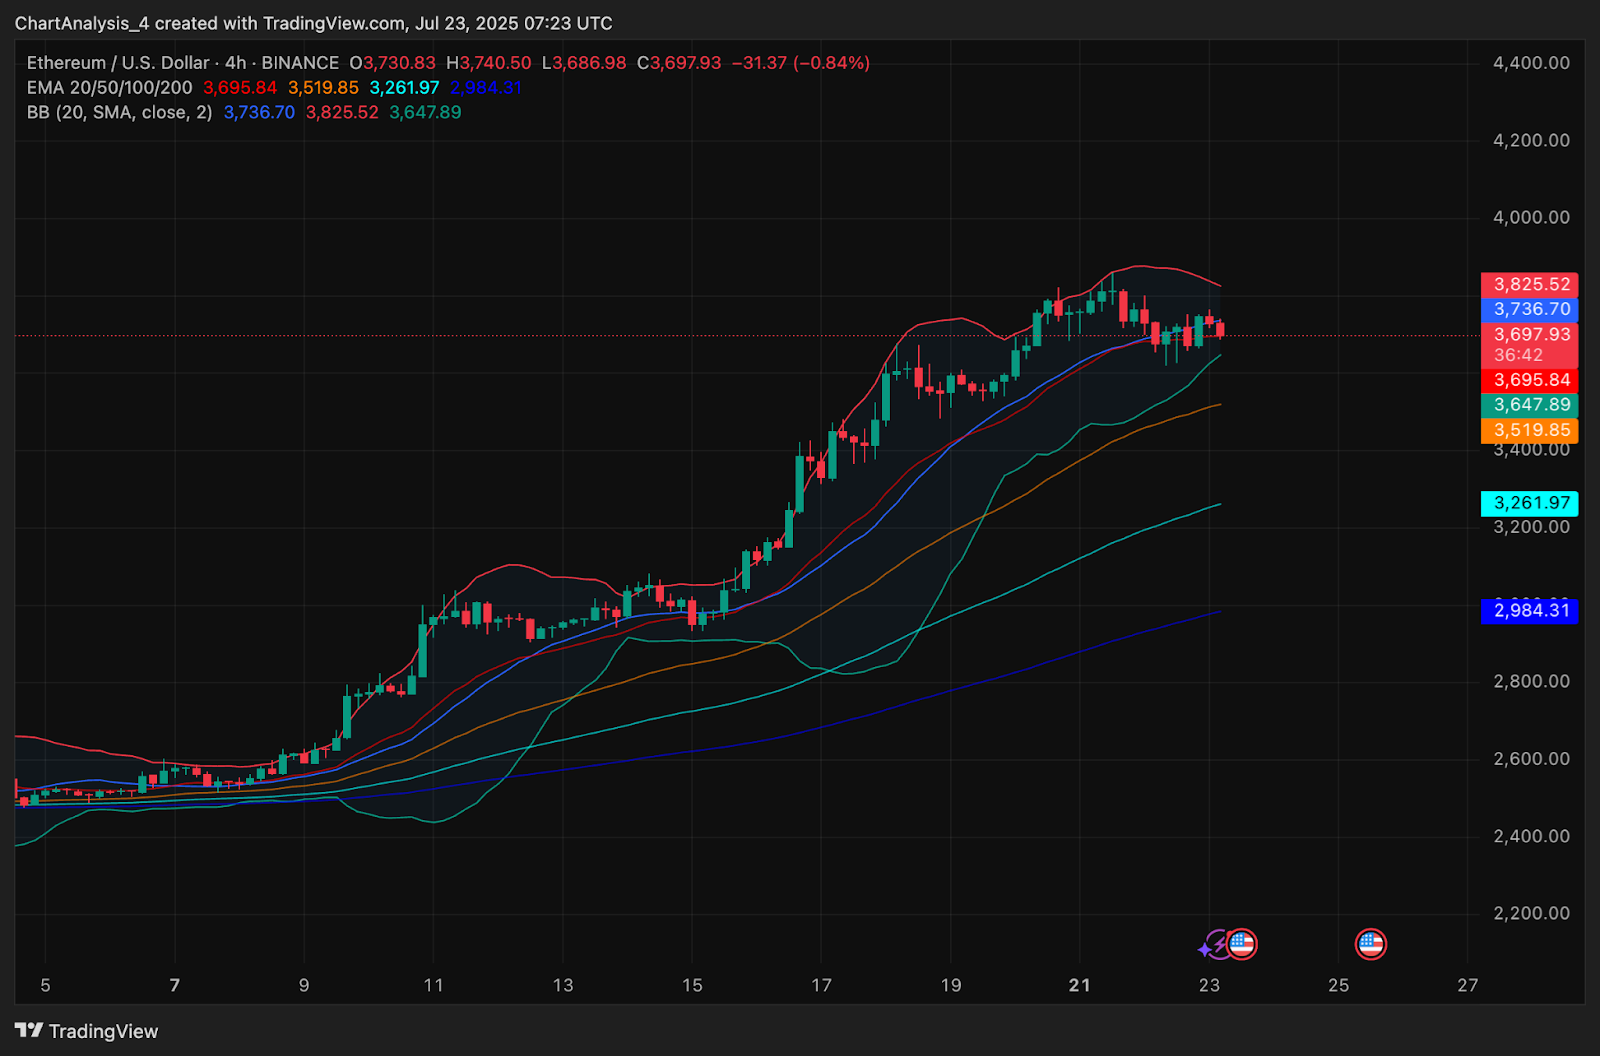
The Bollinger Bands on the 4-hour chart are tightening sharply, with price now compressed near the middle band at $3,705. This indicates reduced volatility and rising potential for expansion in the next 12–24 hours. If ETH price can close above the upper band ($3,790), it may confirm the next impulsive leg toward the $4,000–$4,140 zone.
The 20/50 EMA cluster sits between $3,625 and $3,705, currently acting as support. The 100 EMA at $3,484 and 200 EMA at $3,250 form the broader uptrend base. The bullish alignment of these moving averages continues to support upside pressure.
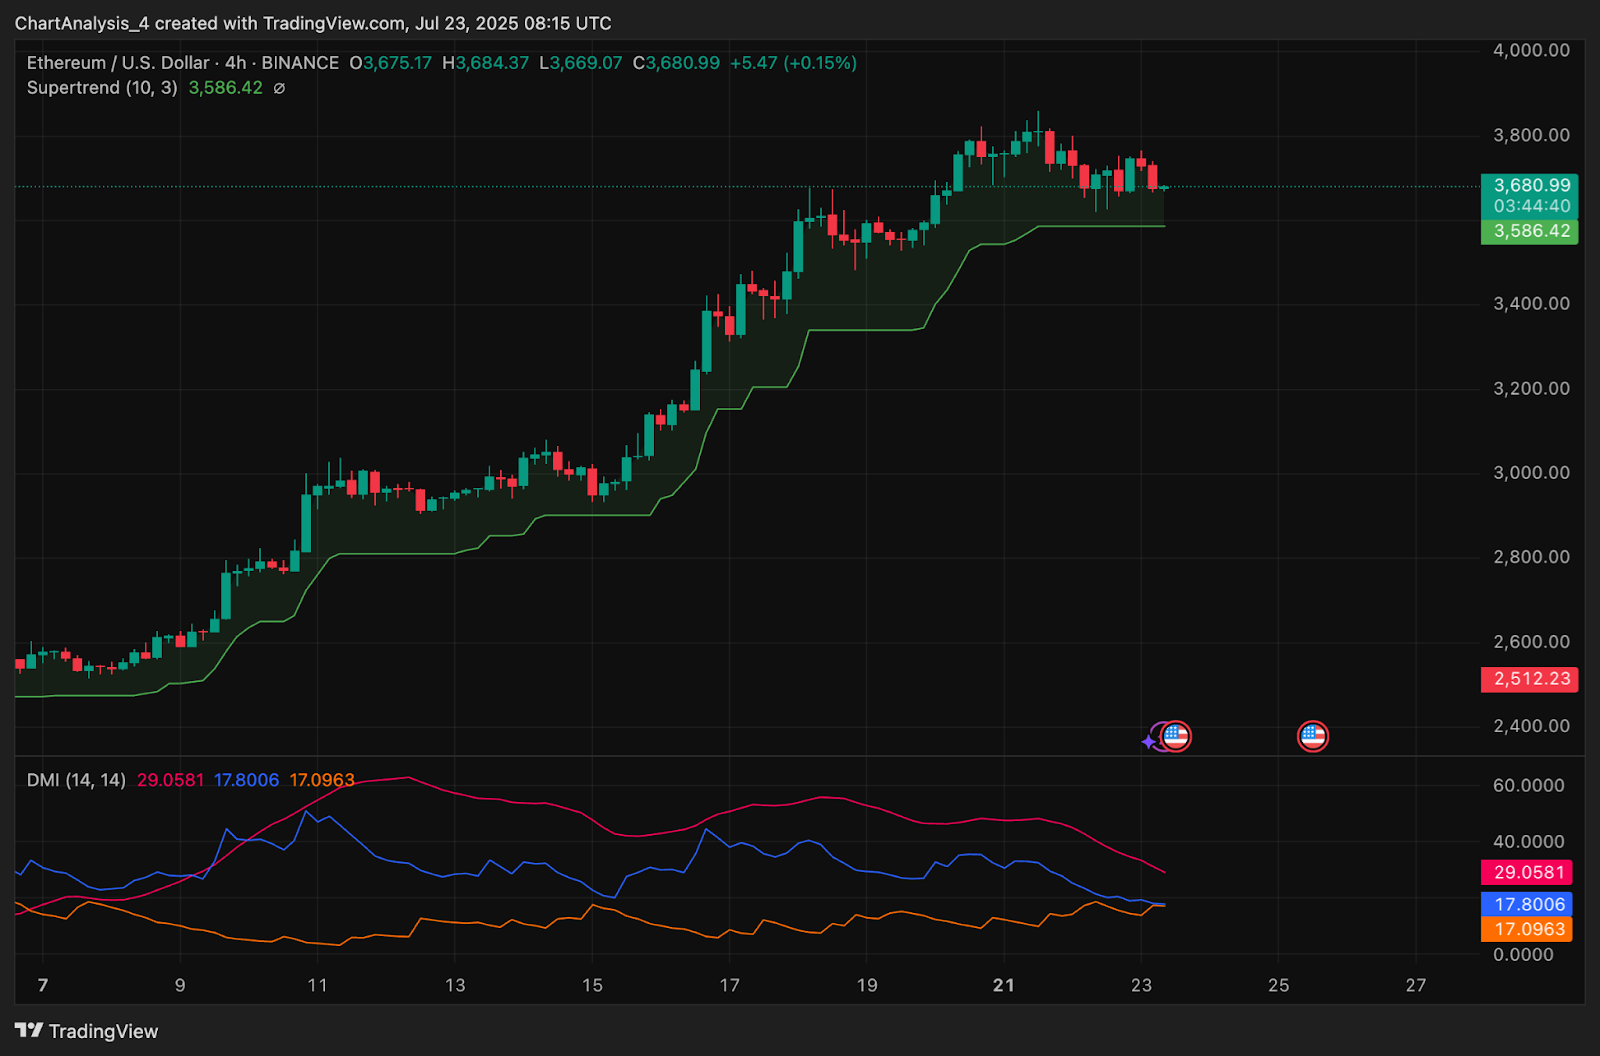
Supertrend remains bullish on the 4-hour chart, printing support near $3,605, while VWAP rests just above at $3,718. This forms a minor supply band that needs to be cleared for continuation.
Ethereum Price Prediction: Short-Term Outlook (24H)
Ethereum is locked in a pre-breakout squeeze with rising compression. If ETH breaks above $3,790 with confirmation, the next move could extend toward $4,000, with further targets at $4,120–$4,180 if upside momentum sustains. However, a rejection here could lead to a pullback toward $3,625, and further downside to $3,480 if trendline support fails.
As long as Ethereum price today remains above the 20/50 EMA cluster and Supertrend support, the short-term structure leans bullish. A decisive close outside the triangle pattern will define the breakout direction.
Ethereum Price Forecast Table: July 24, 2025
| Indicator/Zone | Level / Signal |
| Ethereum price today | $3,705 |
| Resistance 1 | $3,790 (triangle top) |
| Resistance 2 | $4,120–$4,180 (breakout zone) |
| Support 1 | $3,625 (EMA20/50 cluster) |
| Support 2 | $3,480 (EMA100 zone) |
| RSI (30-min) | 46.6 (Neutral to mild bearish) |
| MACD (30-min) | Flat, low momentum |
| EMA Cluster (4H) | Bullish alignment |
| Bollinger Bands (4H) | Tight squeeze, breakout potential |
| VWAP (30-min) | $3,718 (near-term resistance) |
| Supertrend (4H) | Bullish, support at $3,605 |
| OBV (4H) | 1.24B (Accumulation holding) |
| Spot Netflow | +$8.79M (Positive flows) |
Disclaimer: The information presented in this article is for informational and educational purposes only. The article does not constitute financial advice or advice of any kind. Coin Edition is not responsible for any losses incurred as a result of the utilization of content, products, or services mentioned. Readers are advised to exercise caution before taking any action related to the company.

 Price Prediction: Canton Eyes Key Break After Market Activity Spike")


