 Price Prediction for July 5")
After reclaiming $2,600 earlier this week, Ethereum price today has pulled back toward the $2,550–$2,560 zone, breaching key intraday support. The rejection from the $2,610 supply zone triggered renewed downside as bears forced a breakdown below a rising short-term trendline.
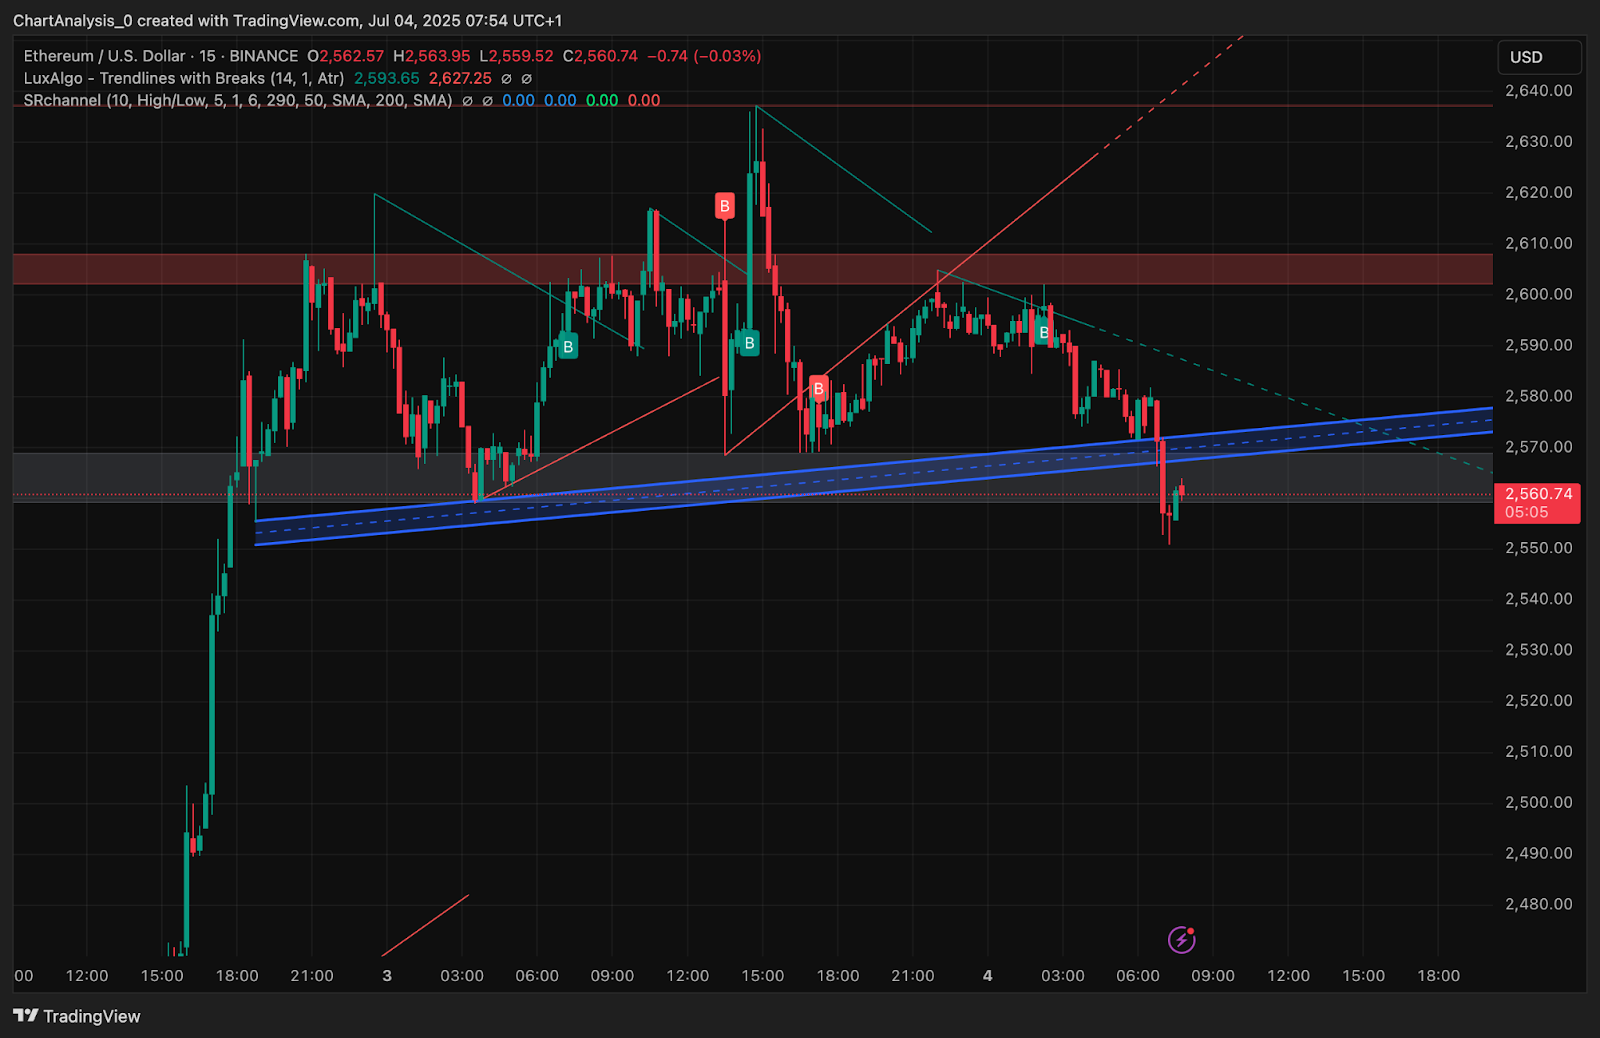
At the time of writing, Ethereum trades near $2,560 with a mild intraday loss, as short-term indicators point to waning momentum and rising volatility.
What’s Happening With Ethereum’s Price?
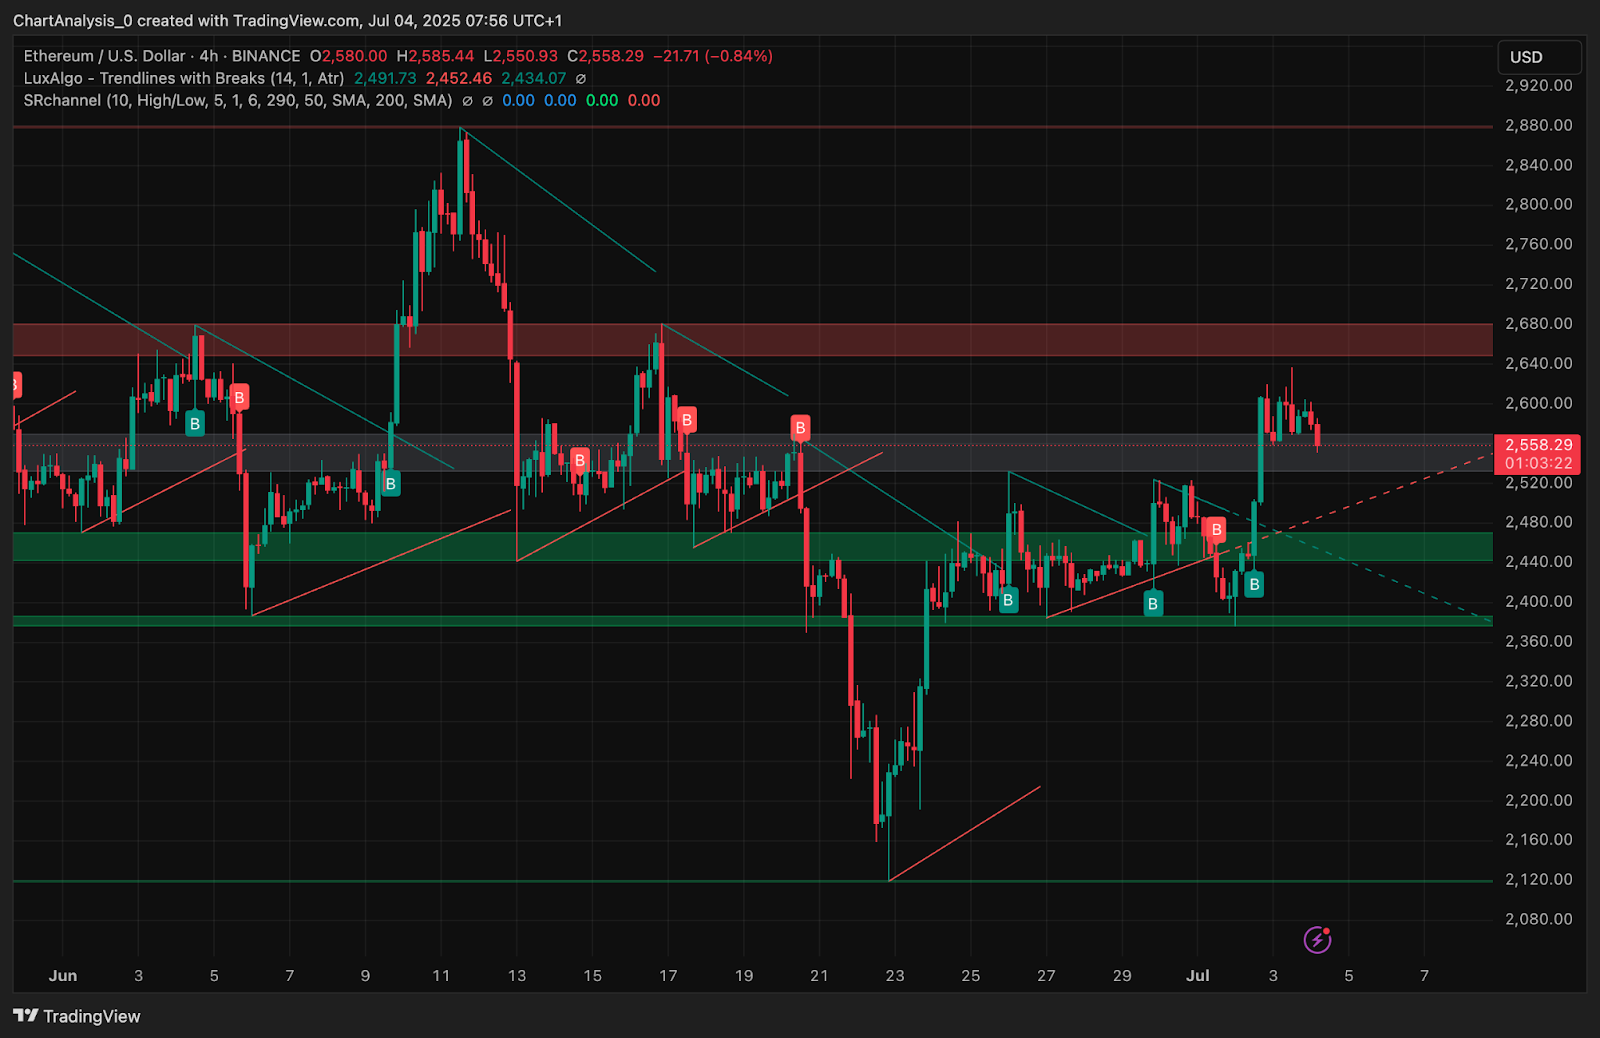
The 4-hour chart shows that Ethereum price action broke out above a multi-week consolidation range near $2,520, only to get rejected near the $2,610–$2,620 resistance band. This zone has capped ETH’s upside three times since mid-June, reinforcing it as a key supply area. The rising trendline support from the late June lows has now been breached, shifting short-term structure to bearish.
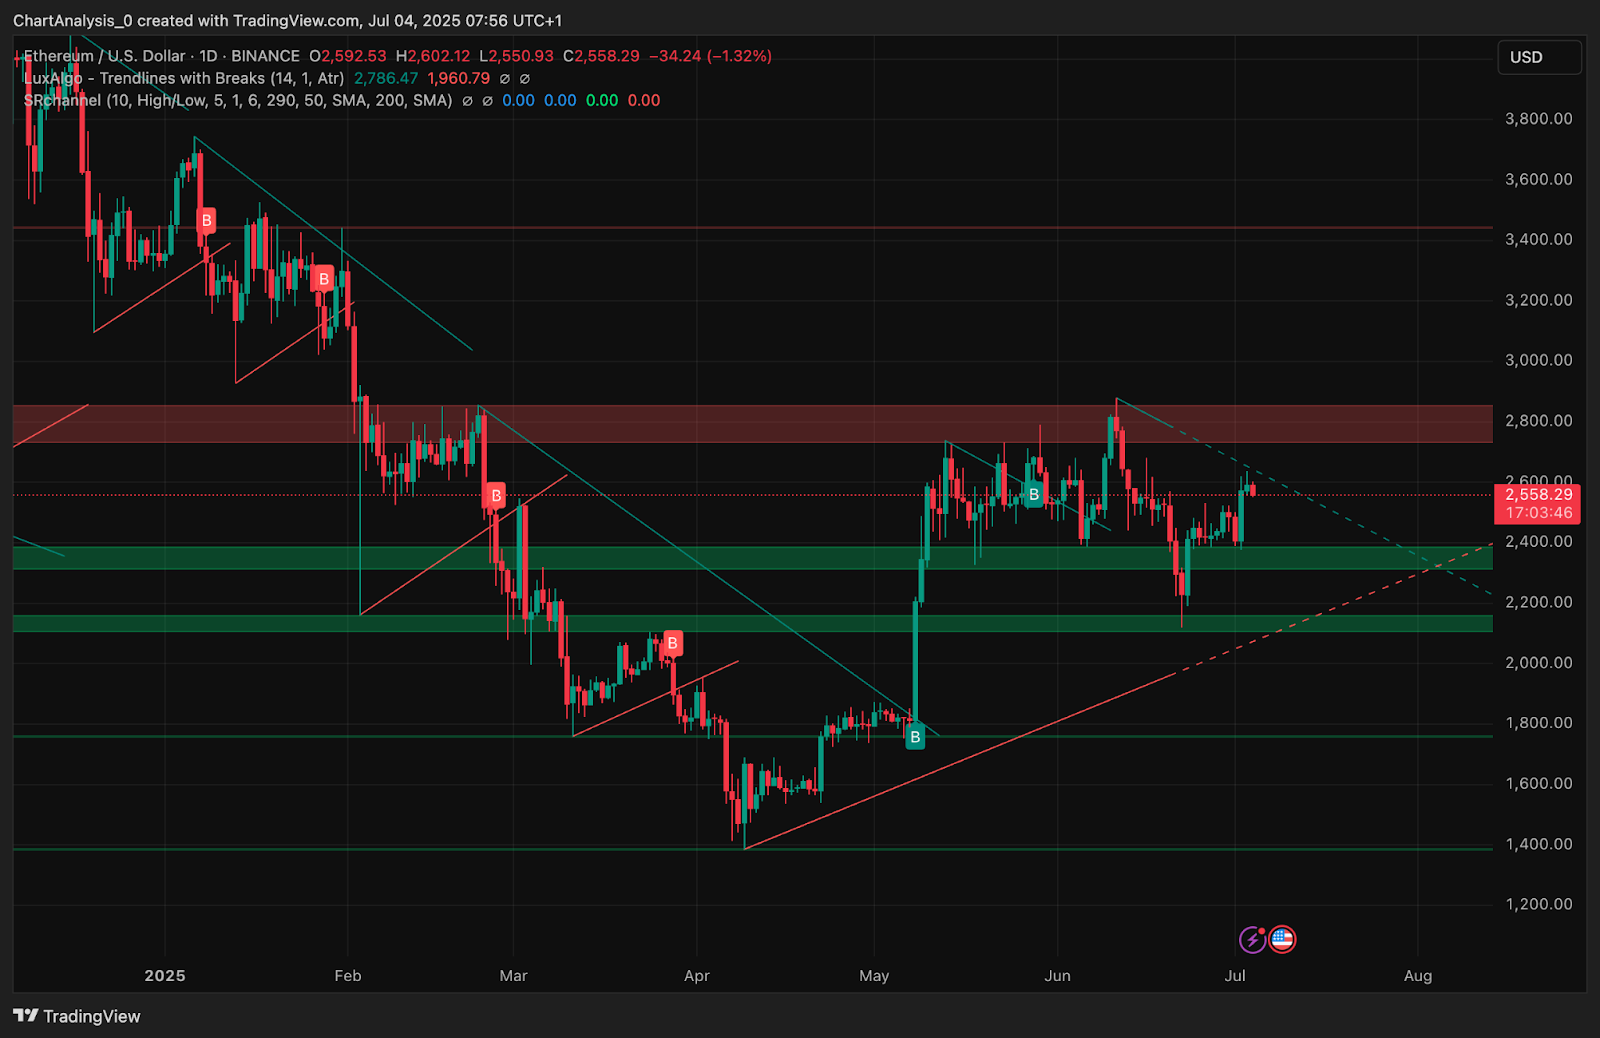
Meanwhile, on the daily timeframe, ETH remains trapped inside a large symmetrical triangle pattern, with the apex drawing closer. The lower support of this triangle currently aligns with the $2,420–$2,440 zone, making it the next potential bounce area if current weakness persists.
Why Is the Ethereum Price Going Down Today?
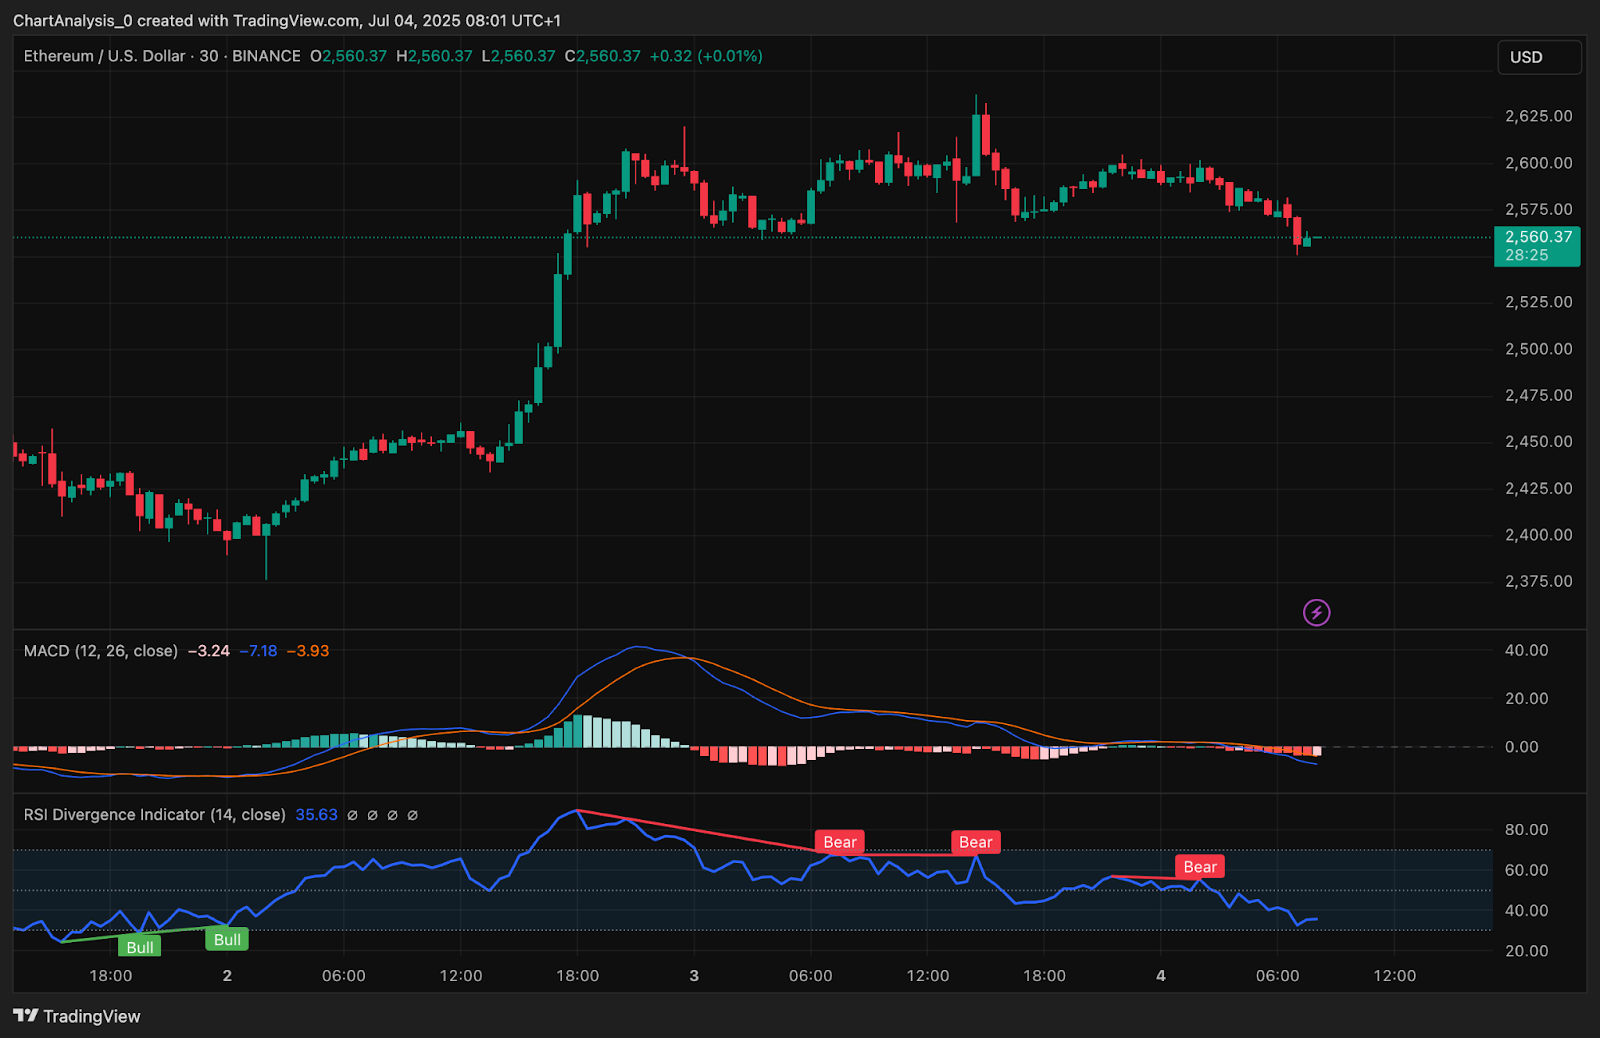
Why Ethereum price going down today can be attributed to multiple bearish technical and sentiment cues. On the 30-minute chart, a clear breakdown below the blue support channel around $2,570 has opened space for further losses. MACD is in negative territory, showing fading bullish momentum, while RSI on the same chart is at 35.6 with multiple bearish divergence signals confirmed on July 3.
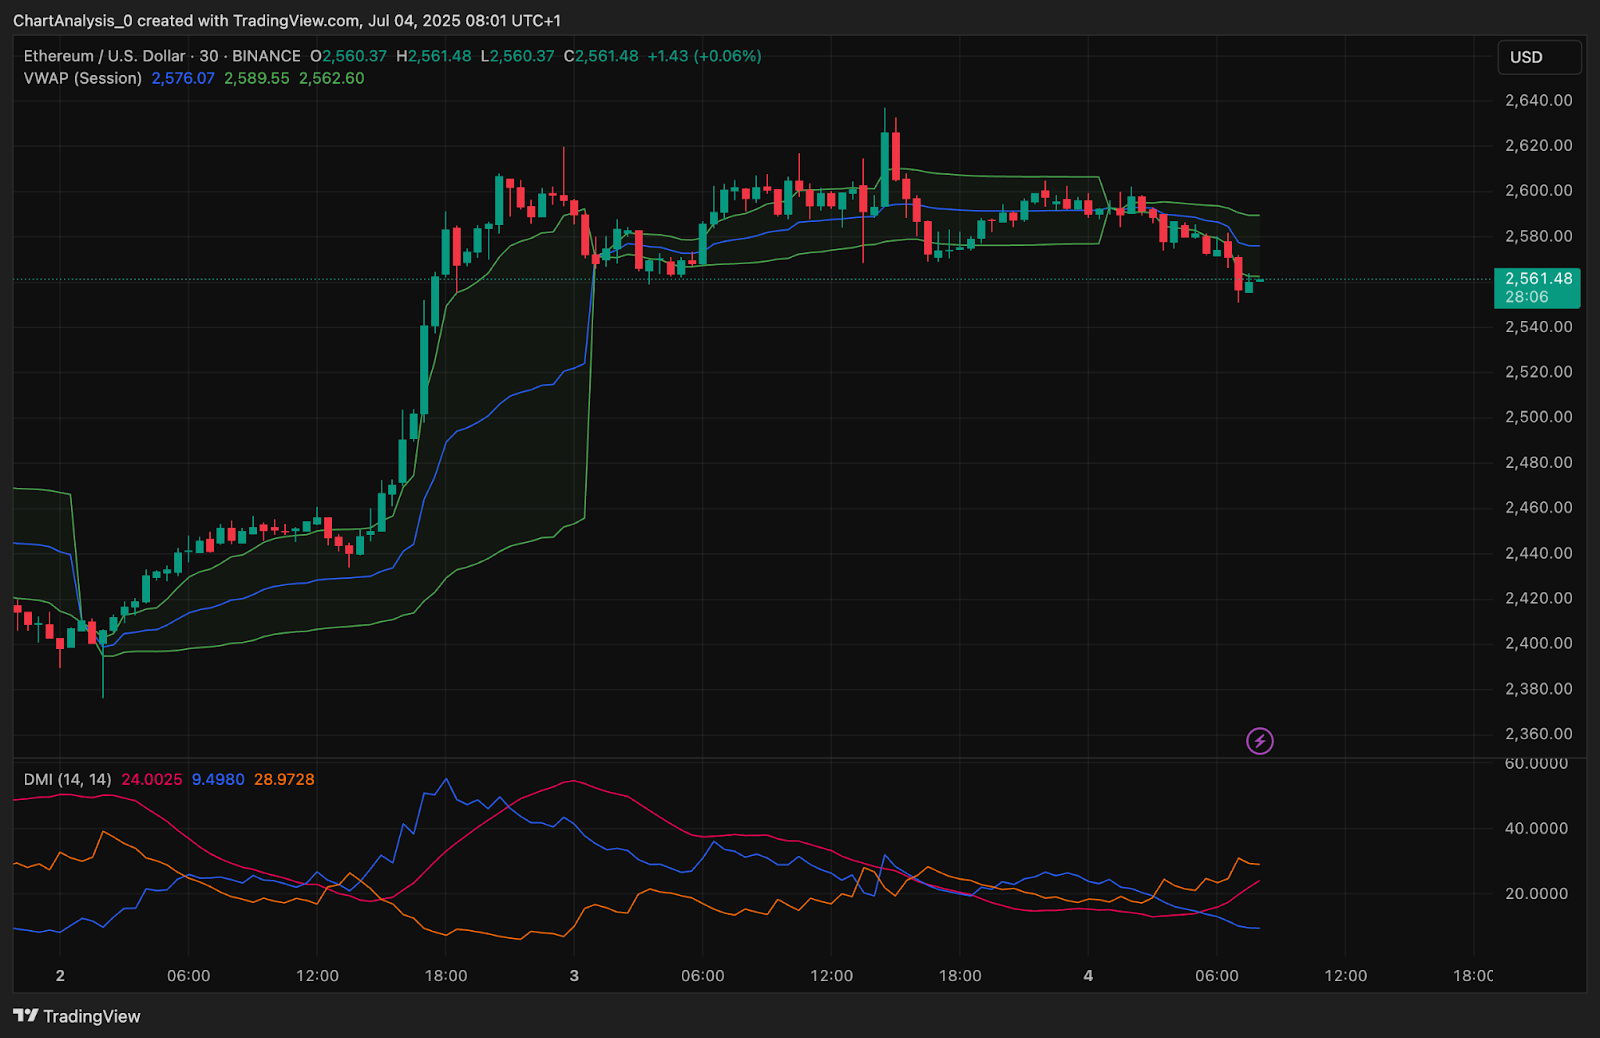
VWAP analysis reveals ETH has slipped below the session average of $2,576, indicating short-term price weakness. On the DMI, the -DI line is dominant, while ADX is rising — confirming a strengthening bearish trend.
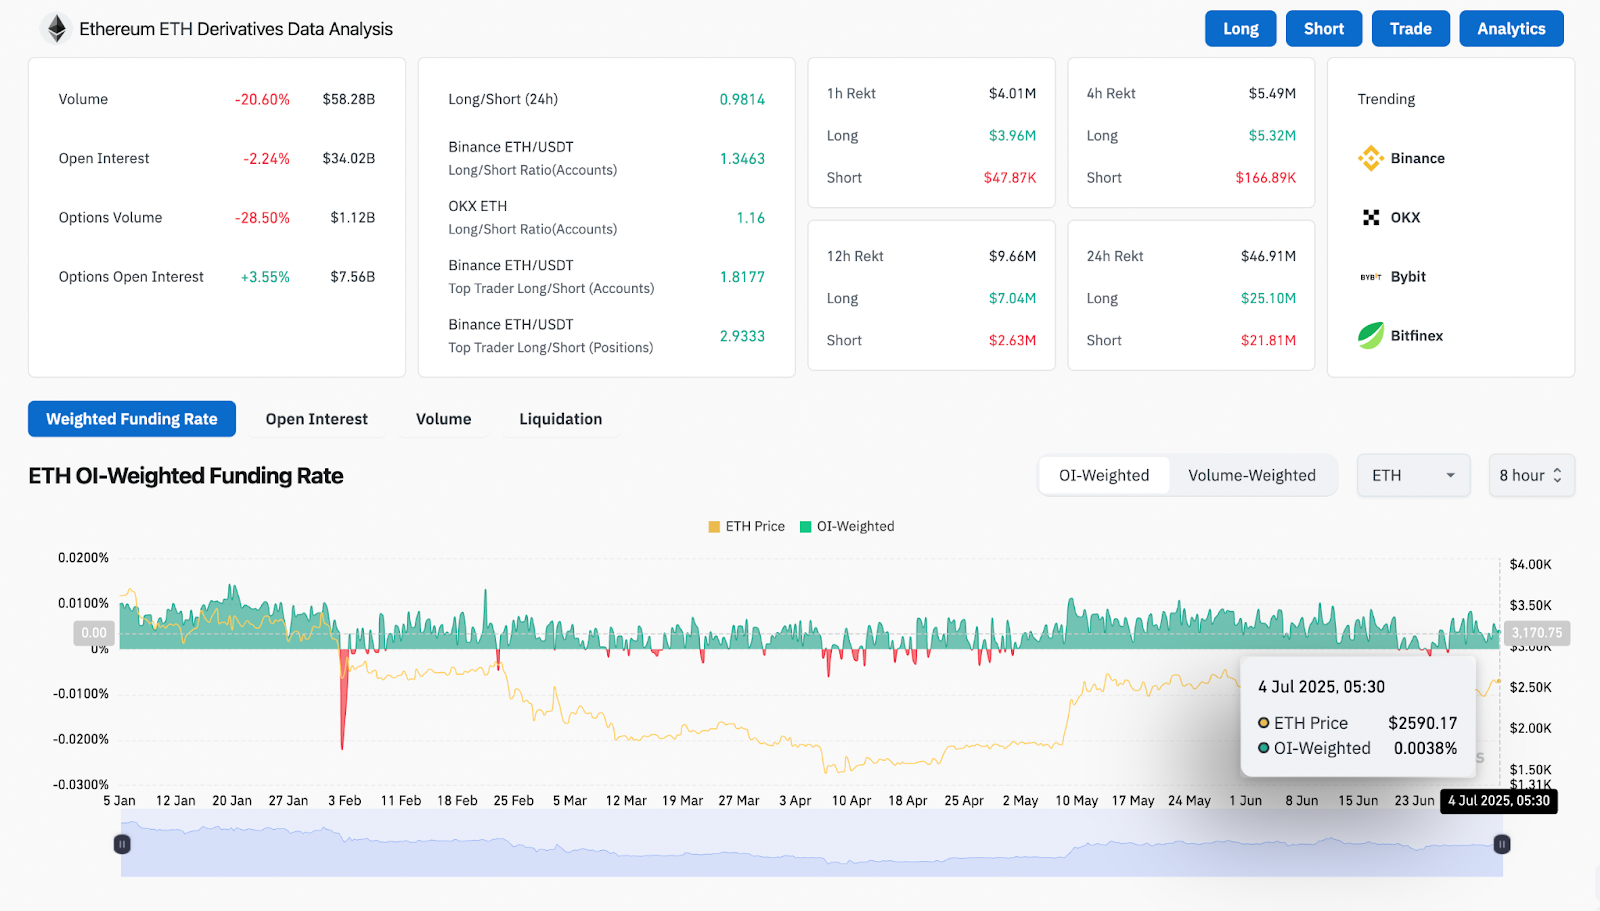
The derivatives dashboard shows a 20.60% drop in volume and a 2.24% decline in open interest, reflecting reduced market conviction. Most notably, short liquidations in the past 4 hours were minimal compared to long liquidations, implying sellers are still in control. Funding rates remain barely positive, suggesting leverage skew remains slightly long, which may invite more downside if sentiment worsens.
Price Indicators, Signals, Graphs and Charts (24h)

Bollinger Bands on the 4-hour chart are starting to widen after compression, a signal of increasing Ethereum price volatility. ETH has now closed a 4-hour candle below the mid-band ($2,560), suggesting downward pressure could continue toward the lower band near $2,515.
The EMA cluster offers mixed signals. ETH is still holding just above the 20 and 50 EMA near $2,534 and $2,491 respectively, but is starting to drift below the 100 EMA ($2,482). If price continues closing below the 100 EMA, momentum may shift decisively in favor of the bears.
On-chain data remains neutral. Despite a positive funding rate of 0.0038% and a long/short ratio favoring longs (Binance accounts at 1.34), the lack of bullish follow-through at $2,610 suggests traders are cautious.
ETH Price Prediction: Short-Term Outlook (24h)
If Ethereum price fails to reclaim $2,570 quickly, the next support lies at $2,515 (lower Bollinger Band and horizontal support). Below that, the $2,440–$2,460 demand zone aligns with trendline and Fibonacci confluence, offering a likely bounce area.
On the upside, a reclaim of $2,580 could invalidate the breakdown, with resistance again at $2,610 and then $2,645. For bulls to regain control, ETH needs to reclaim the VWAP mid-zone and break above the descending resistance from the June highs.
With RSI and MACD turning bearish and volume thinning, traders should watch for any spikes in selling pressure or sudden liquidation-driven wicks.
Ethereum Price Forecast Table: July 5, 2025
| Indicator/Zone | Level (USD) | Signal/Comment |
| Resistance 1 | 2,610 | Key rejection zone, recent highs |
| Resistance 2 | 2,645 | Weekly Fib extension resistance |
| Support 1 | 2,515 | Bollinger Band and short-term floor |
| Support 2 | 2,440 | Fib support + trendline confluence |
| RSI (30-min) | 35.6 | Bearish divergence confirmed |
| MACD (30-min) | -3.24 | Bearish histogram, fading momentum |
| EMA 20/50/100 (4H) | 2,534/2,492/2,482 | Breakdown underway |
| VWAP (30-min) | 2,576 | Price trading below session average |
| Bollinger Band Midline | 2,560 | ETH closing under mid-band |
| Funding Rate (Binance) | 0.0038% | Neutral-to-positive bias |
Disclaimer: The information presented in this article is for informational and educational purposes only. The article does not constitute financial advice or advice of any kind. Coin Edition is not responsible for any losses incurred as a result of the utilization of content, products, or services mentioned. Readers are advised to exercise caution before taking any action related to the company.

 Price Prediction for April 2026: Will Chainlink Move Higher?")
 Price Prediction: Can Bulls Sustain the $0.045 Push?")

