 Price Prediction for July 9")
Ethereum price continues to consolidate in a tight zone beneath the multi-month resistance band near $2,562. After weeks of coiling action, Ethereum price today is holding firm above the 0.382 Fib retracement from the 2024–2025 decline, with traders watching for a decisive breakout.
What’s Happening With Ethereum’s Price?
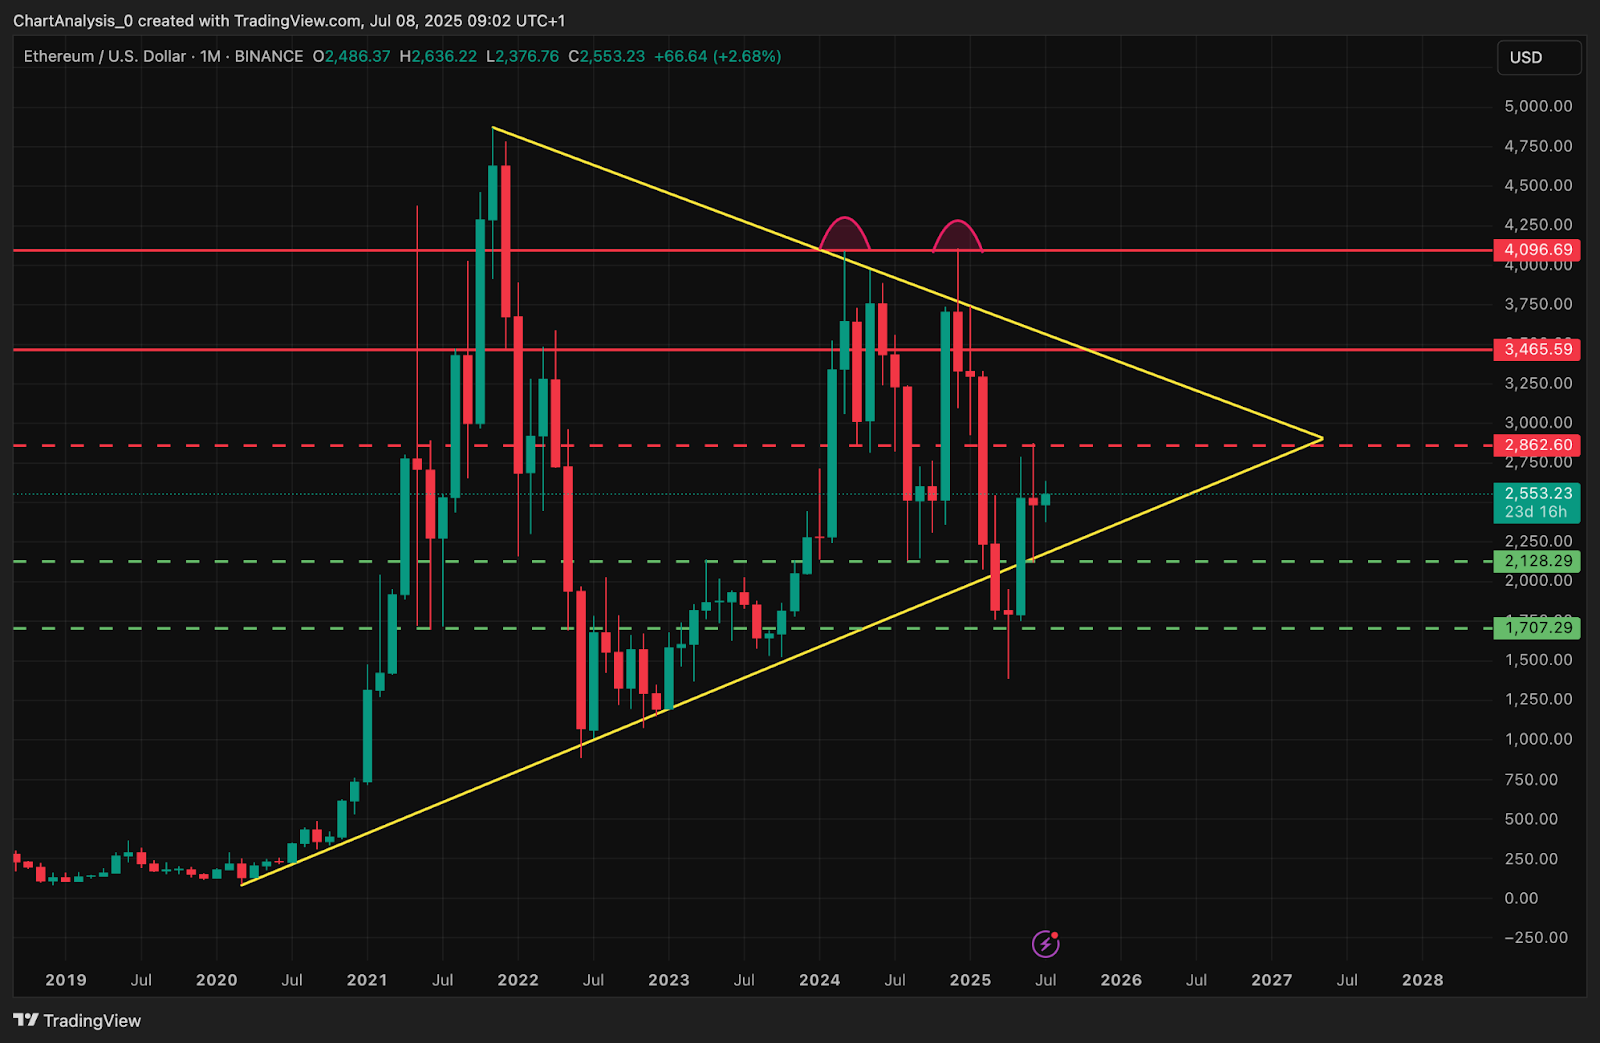
On the weekly chart, ETH remains locked inside a macro symmetrical triangle stretching back to 2022, with current price action approaching the apex. The monthly structure shows strong horizontal resistance near $2,862 and $3,465, while support remains firm above $2,128 and $1,707.
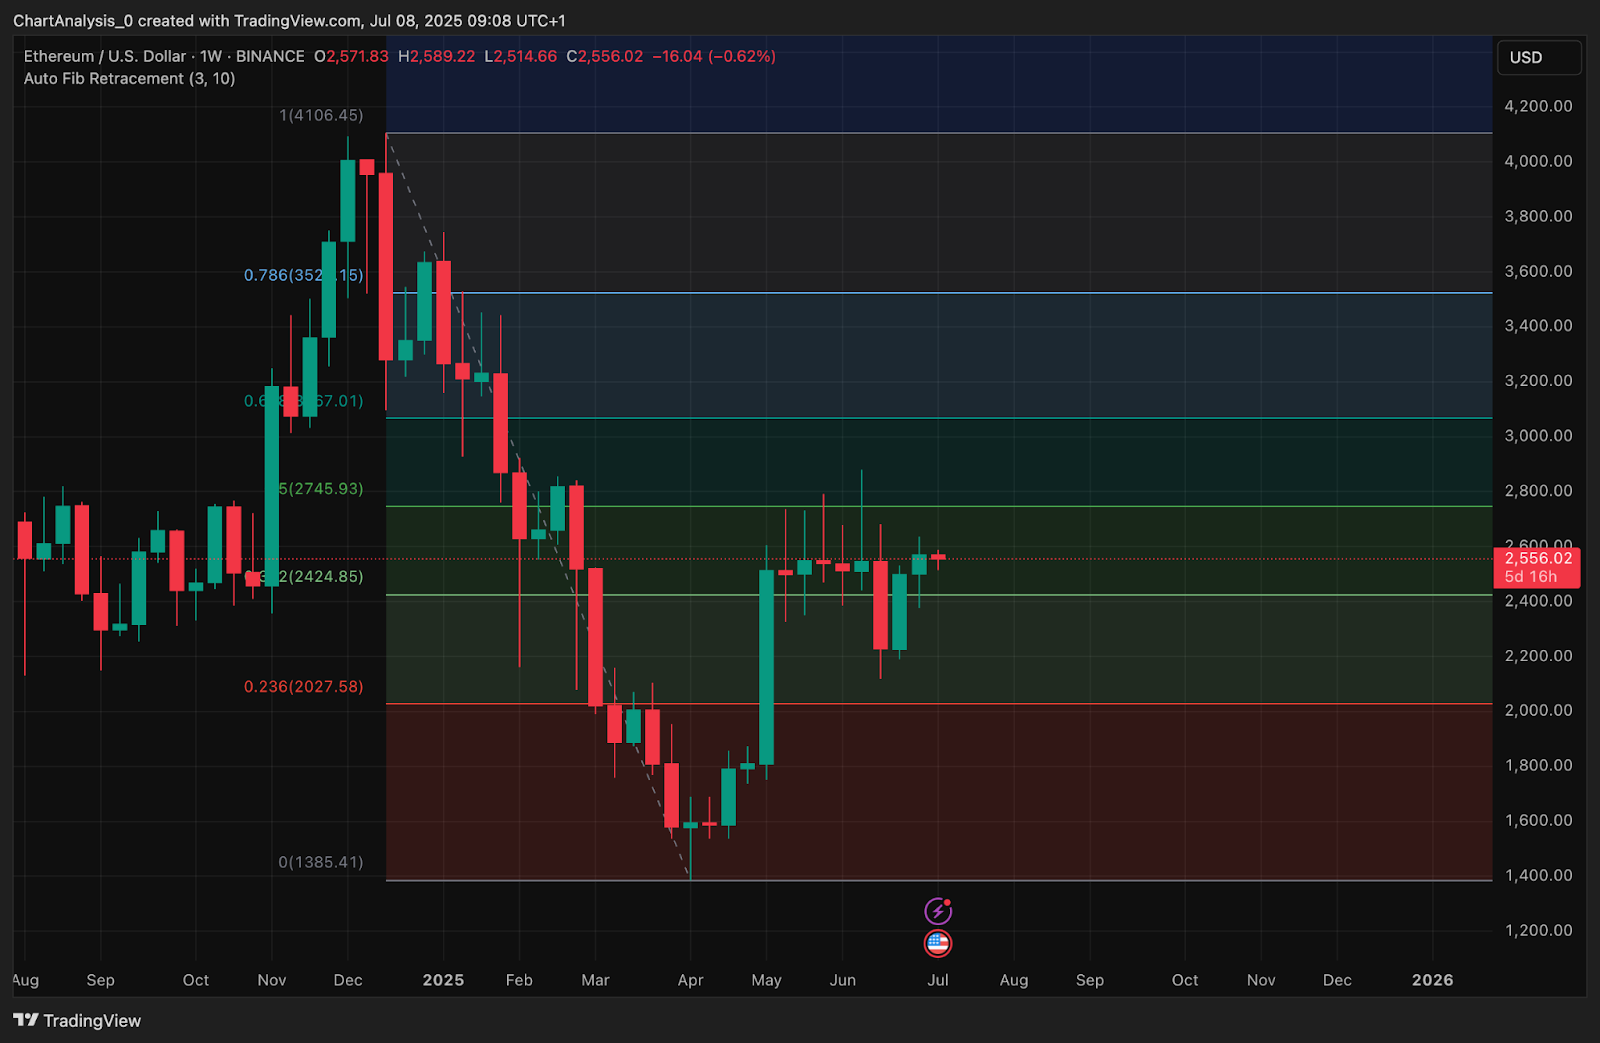
Recent price action reflects a tightening structure between $2,500 and $2,560, with multiple daily closes holding above the weekly 0.382 Fibonacci level ($2,424.85).
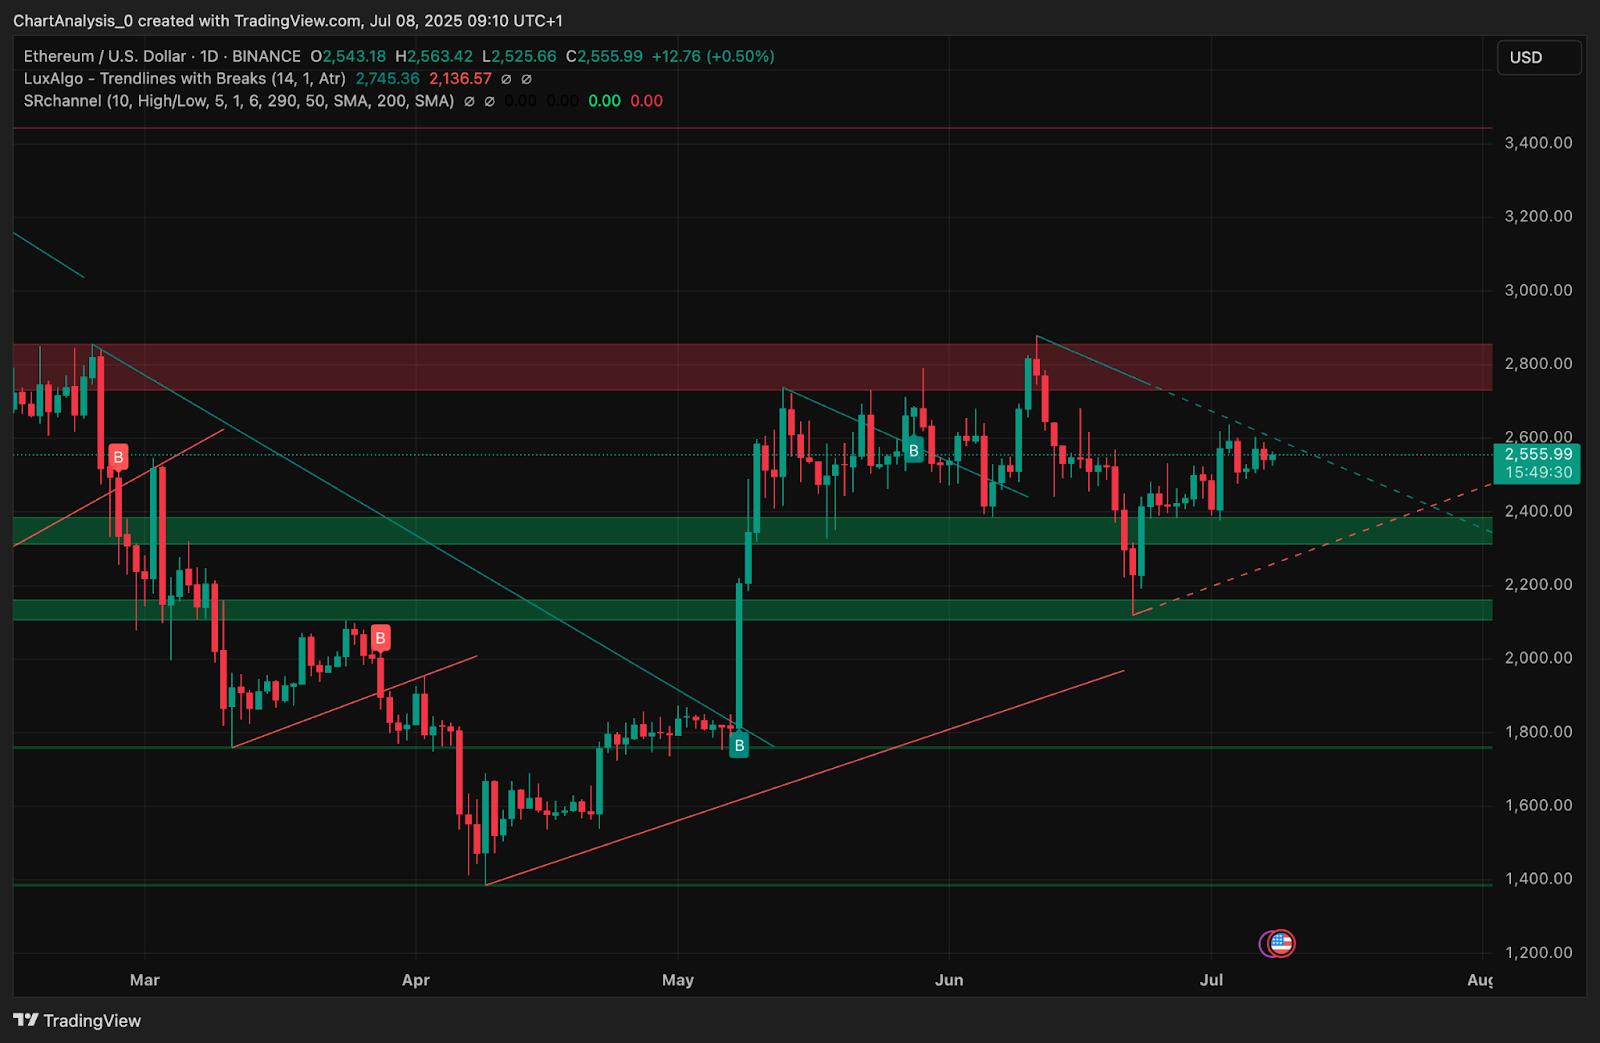
On the 1D chart, Ethereum is trading just under the descending resistance line from April, with rising support from late May continuing to converge. This consolidation suggests a breakout is imminent — either toward $2,745 or back toward the $2,400 zone.
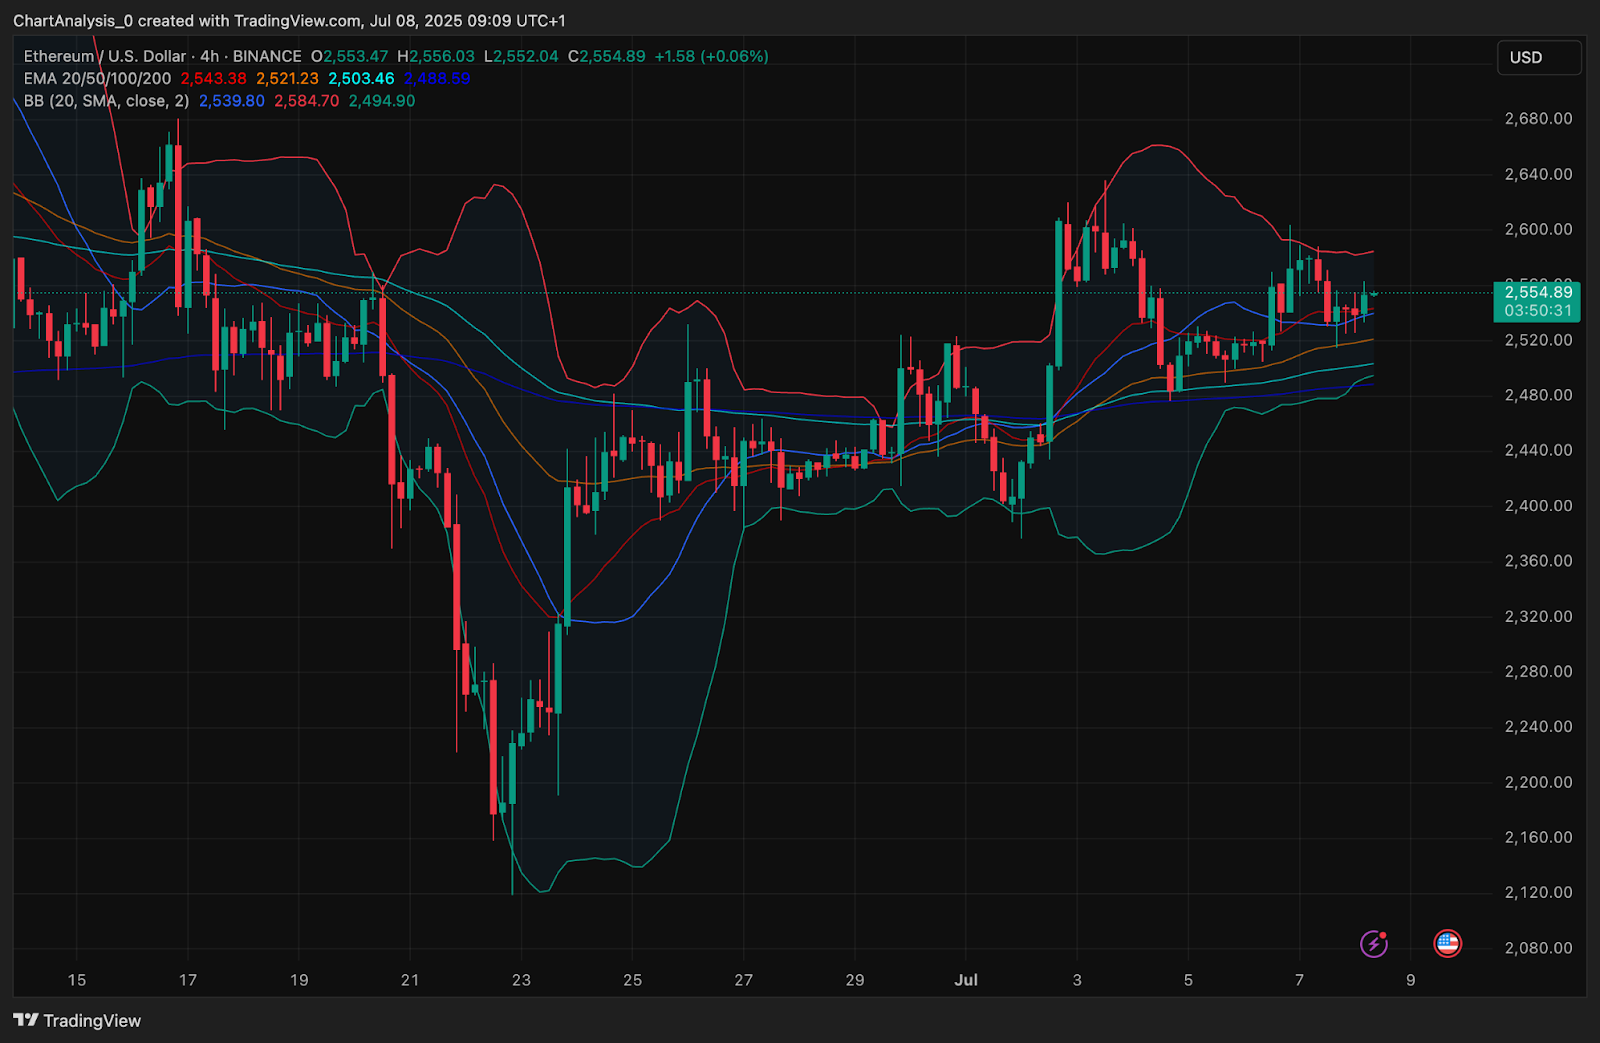
On the 4-hour chart, Ethereum is supported by a bullish EMA cluster. The 20/50/100/200 EMAs between $2,503 and $2,544 have formed a strong dynamic floor, reinforcing the compression zone. Bollinger Bands are also starting to contract, which typically precedes a large directional move.
Why Is The Ethereum Price Going Up Today?
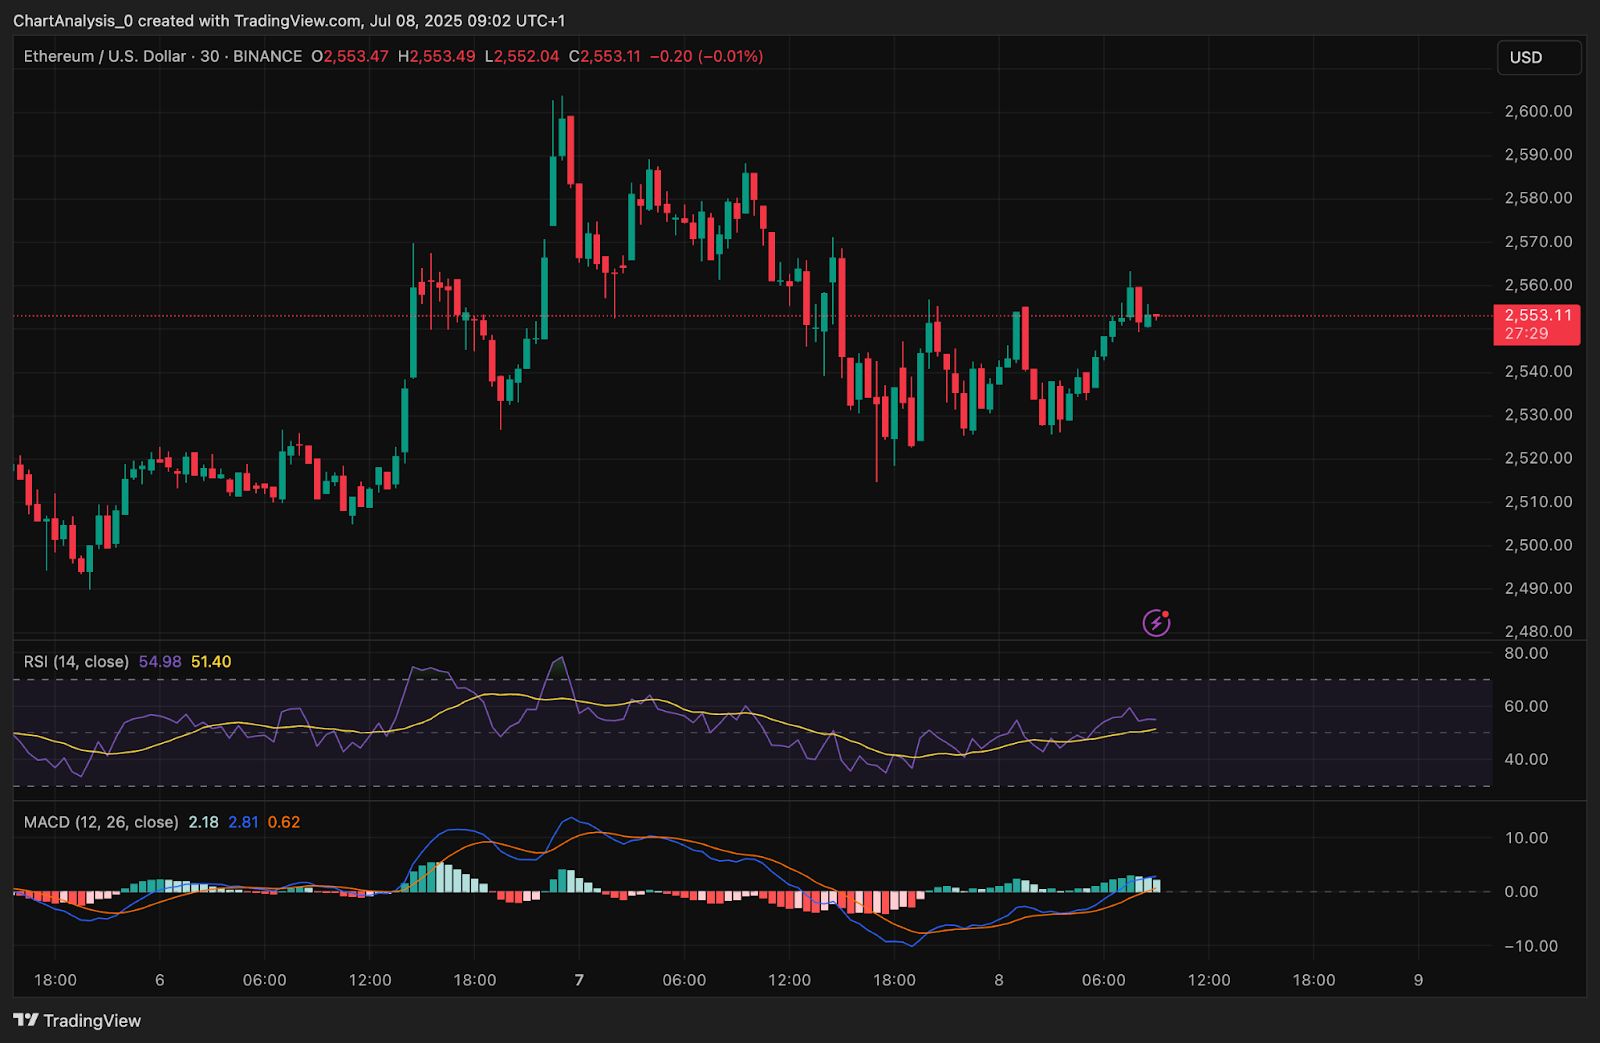
Why Ethereum price going up today can be linked to momentum build-up and minor bullish divergences seen across several indicators. On the 30-minute chart, Ethereum price action printed higher lows while RSI moved from neutral to slightly bullish territory at 54.9.
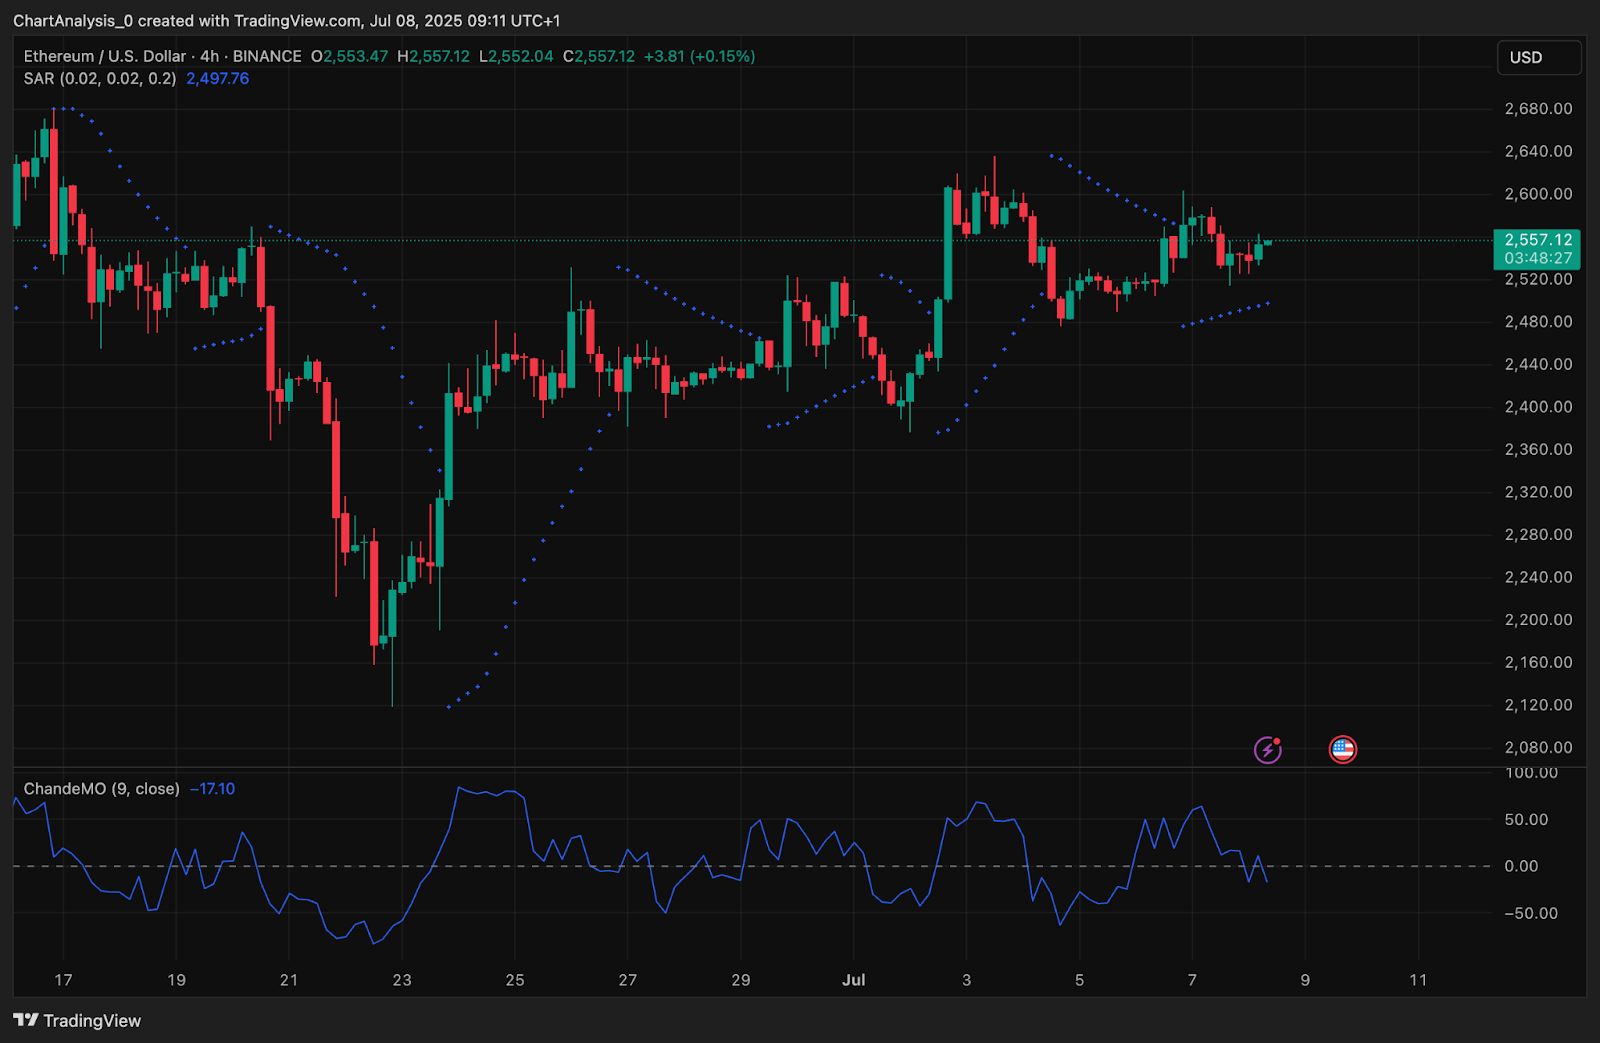
The MACD is printing a bullish crossover with rising histogram bars on short-term timeframes, suggesting growing momentum behind this current uptick. On the 4-hour chart, Parabolic SAR dots have flipped below the price, reinforcing short-term upside bias. This lack of volatility is reflected in the Chande Momentum Oscillator, which remains flat near -17.1, suggesting a potential spring-loaded move once compression ends.
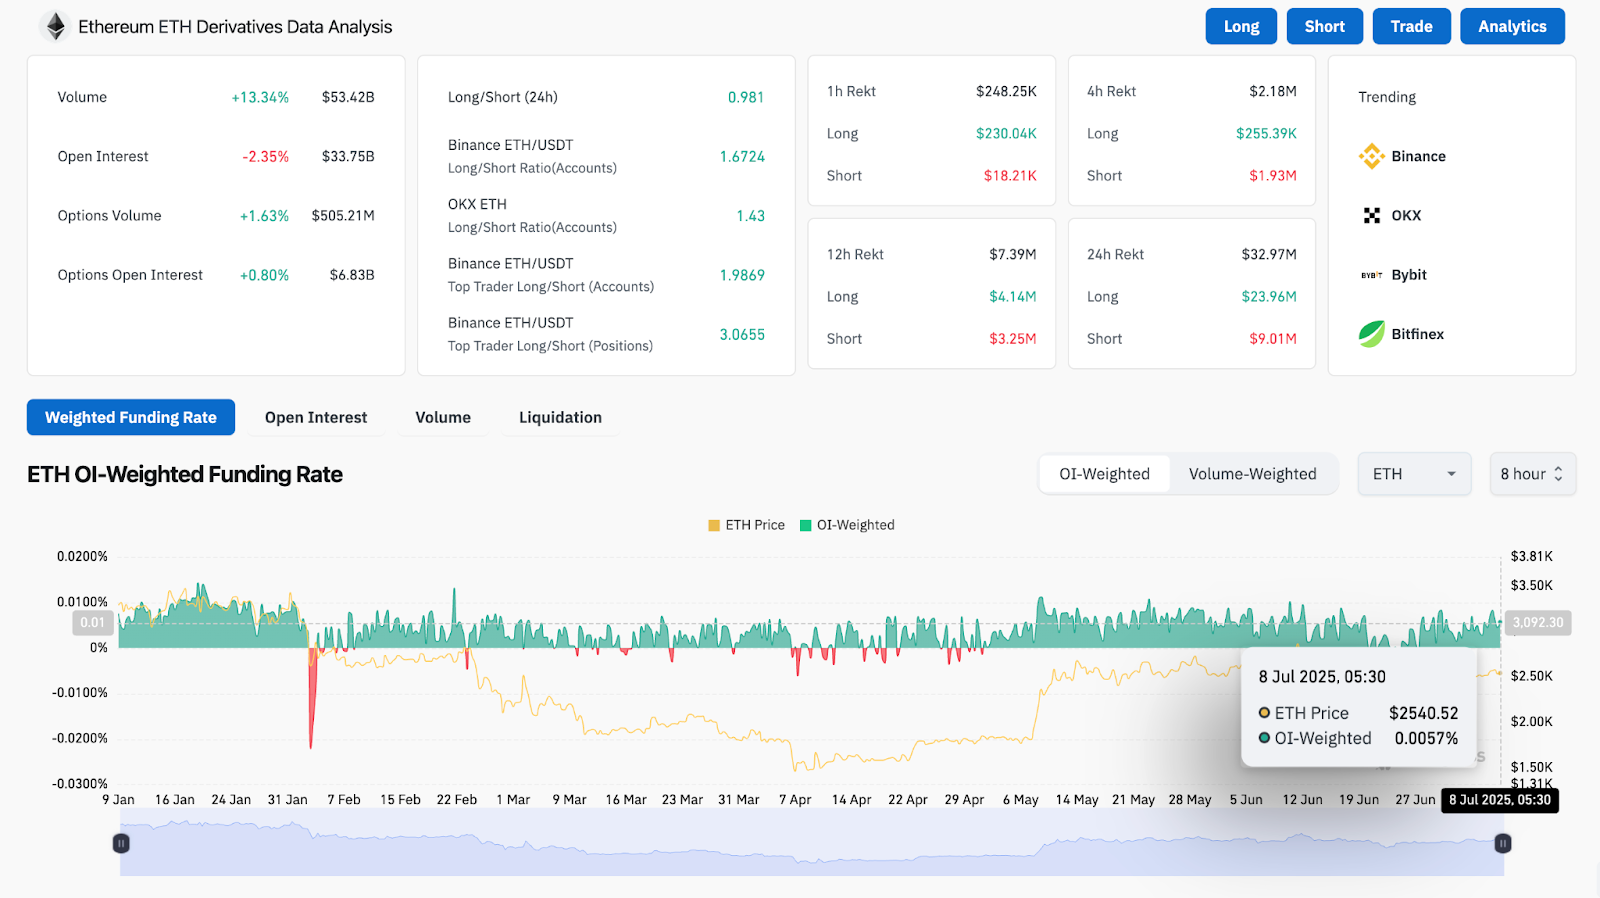
From a broader positioning standpoint, Coinglass derivatives data shows ETH volume is up 13.3% to $53.4B. However, open interest is slightly down by 2.35%, suggesting recent price action is being driven more by spot momentum than leverage. Interestingly, top trader long/short ratios on Binance remain extremely skewed toward longs (3.06:1), showing strong conviction among whales and institutions.
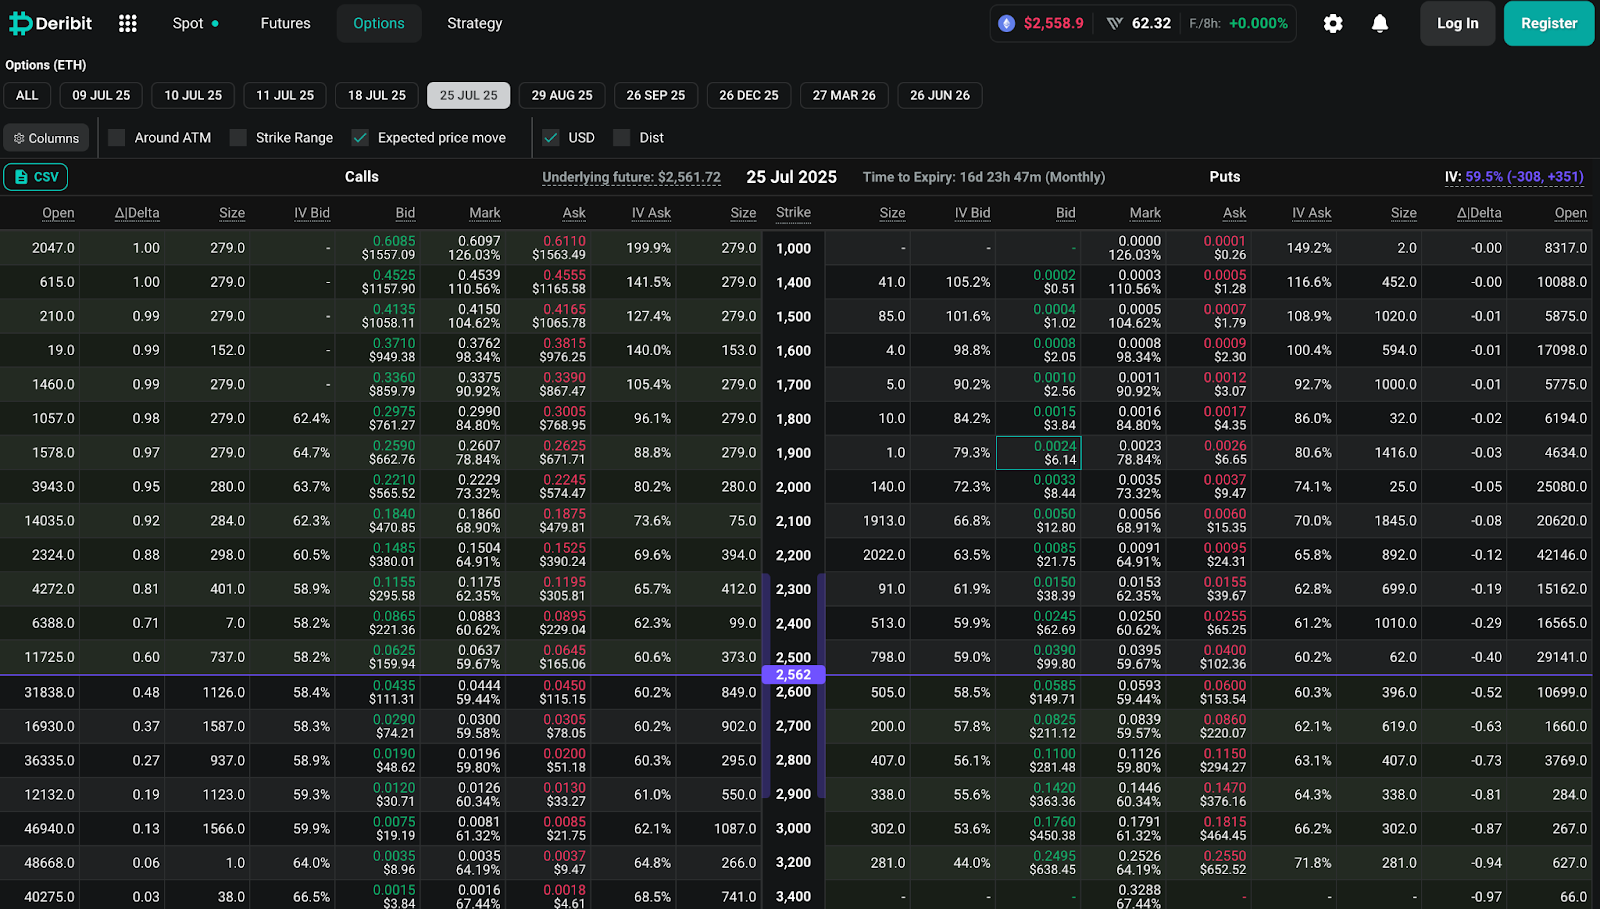
Options data also reflects strong support at the $2,500–$2,520 range, while call activity around the $2,600–$2,700 strikes suggests traders are positioning for a breakout toward $2,745.
ETH Indicators Show Bullish Structure With Waning Volatility
The 4-hour Bollinger Bands show a clear squeeze formation as price trades within a narrow range near the mid-band ($2,540).
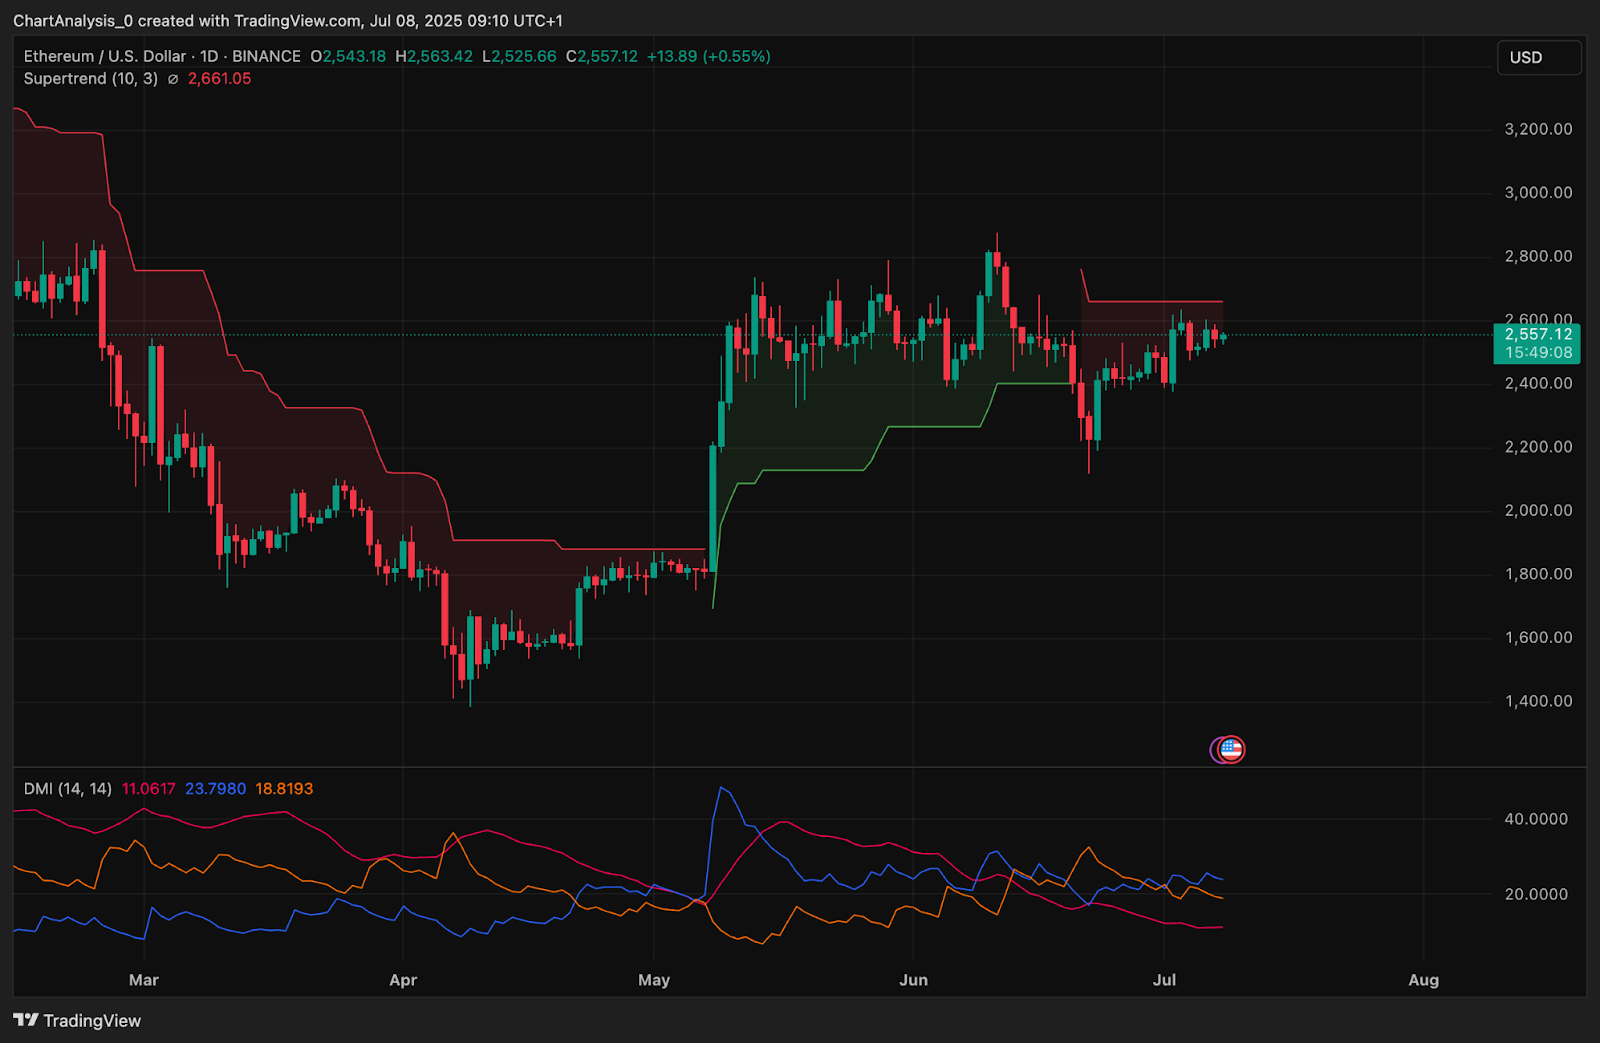
Meanwhile, the Supertrend on the daily chart remains bullish above $2,420, but price must break $2,660 to flip the trend on a higher timeframe. The Directional Movement Index (DMI) shows ADX flattening but +DI remains slightly dominant, maintaining short-term bullish control.
Ethereum is also trading just above session VWAP and is starting to reclaim short-term control, reinforcing intraday strength. However, traders should watch for confirmation via a daily close above $2,562.
Ethereum Price Prediction: Short-Term Outlook (24H)
As Ethereum price today holds above the $2,540 support region, the market is coiling in a symmetrical triangle that is nearing resolution. A confirmed breakout above $2,562 could open the door toward the $2,745 Fibonacci level, followed by the macro resistance zone near $2,862.
If the breakout fails and price falls below the $2,500–$2,480 support zone, bears may retest the $2,424.85 Fib level or even $2,300, where previous demand zones remain untested.
Given tightening volatility, a strong MACD setup, bullish EMA alignment, and derivatives bias, Ethereum appears poised for a decisive breakout within the next 24–48 hours — with direction dependent on volume and breakout strength.
Ethereum Price Forecast Table: July 9, 2025
| Indicator/Zone | Level / Signal |
| Ethereum price today | $2,556 |
| Resistance 1 | $2,562 |
| Resistance 2 | $2,745 |
| Support 1 | $2,500 |
| Support 2 | $2,424.85 |
| MACD (30-min) | Bullish Crossover |
| RSI (30-min) | 54.9 (Neutral-Bullish) |
| Bollinger Bands (4H) | Tightening, Pre-breakout Signal |
| EMA Cluster (4H) | Bullish Stack Below Price |
| VWAP (30-min) | Near Price (Supportive) |
| Supertrend (1D) | Bullish Above $2,420 |
| Parabolic SAR (4H) | Bullish (Below Price) |
| DMI (1D) | +DI Leading, ADX Flat |
| ChandeMO | -17.1 (Neutral Momentum) |
| Derivatives Volume | $53.4B (+13.3%) |
| Open Interest | $33.75B (-2.35%) |
| Options OI (Calls) | Concentrated at $2,600–$2,700 |
Disclaimer: The information presented in this article is for informational and educational purposes only. The article does not constitute financial advice or advice of any kind. Coin Edition is not responsible for any losses incurred as a result of the utilization of content, products, or services mentioned. Readers are advised to exercise caution before taking any action related to the company.


