 Price Prediction for June 23, 2025: Can ETH Rebound After Slipping Below $2,250?")
After a sharp decline from the $2,600 region, the Ethereum price today is struggling to hold above $2,240. The daily candle has closed in the red for three straight sessions, confirming a break below the critical $2,425–$2,450 demand zone. Intraday action is leaning heavily bearish, with RSI nearing oversold levels and MACD momentum weakening across multiple timeframes.
What’s Happening With Ethereum’s Price?
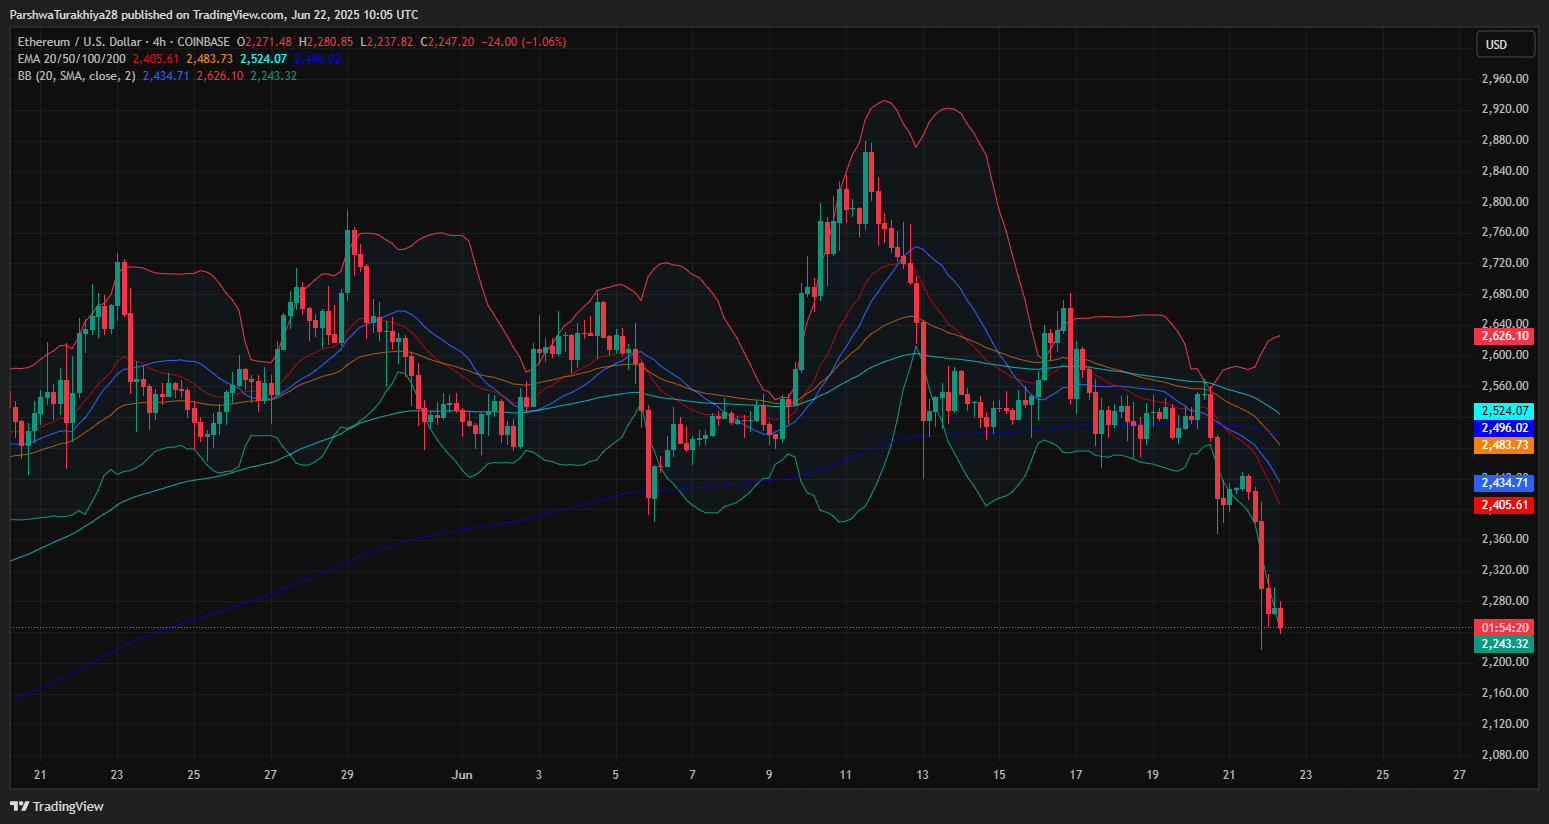
Ethereum’s 4-hour chart confirms a breakdown below the rising wedge structure that held throughout mid-June. Current price action is trading around $2,245, far below the 20/50 EMA cluster near $2,480–$2,525. Price also remains outside the lower Bollinger Band ($2,243), indicating Ethereum price volatility is elevated and downside risk is expanding.
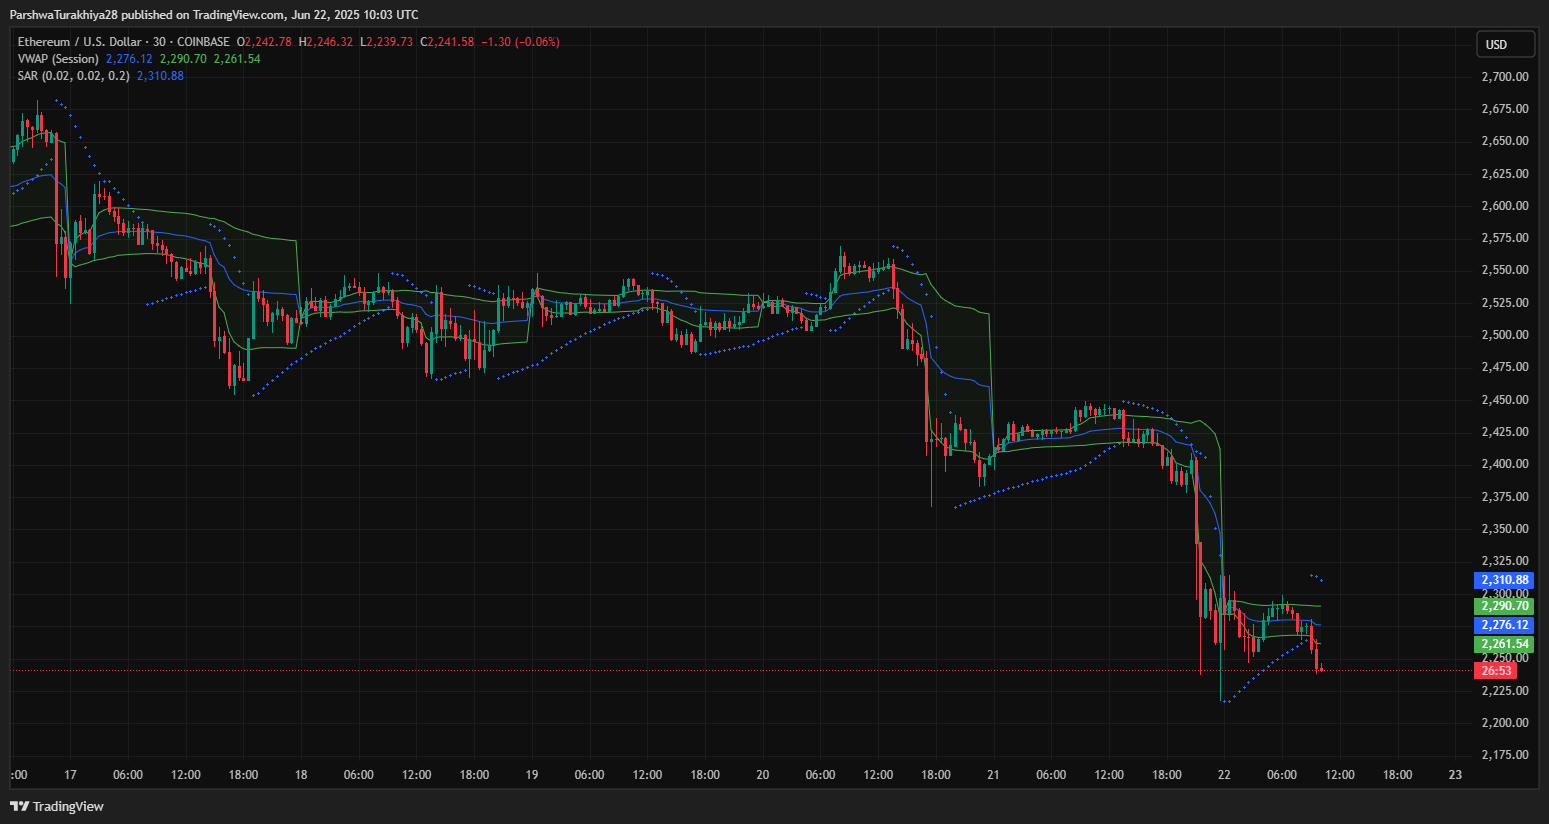
The VWAP on the 30-minute chart sits above the price at $2,276 while the Parabolic SAR dots hover above the candles, showing persistent bearish momentum.
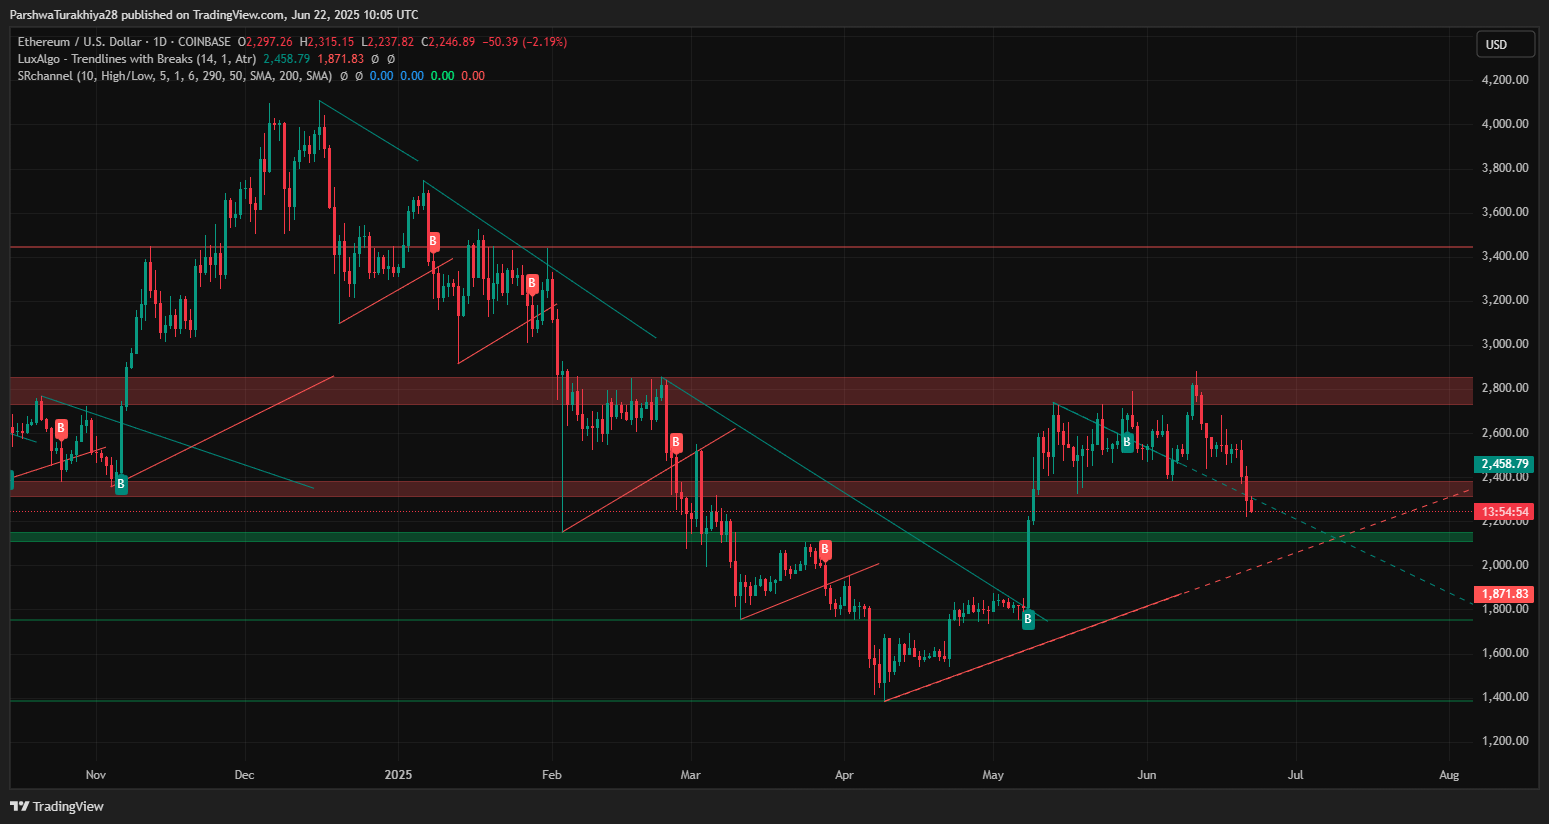
From a broader trend perspective, the daily chart shows a rejection from the $2,800–$2,850 supply zone, with Ethereum now testing the long-term trendline that began in April near $2,230. A close below this support could trigger further downside toward the $2,070–$2,100 region.
Why Ethereum Price Going Down Today?
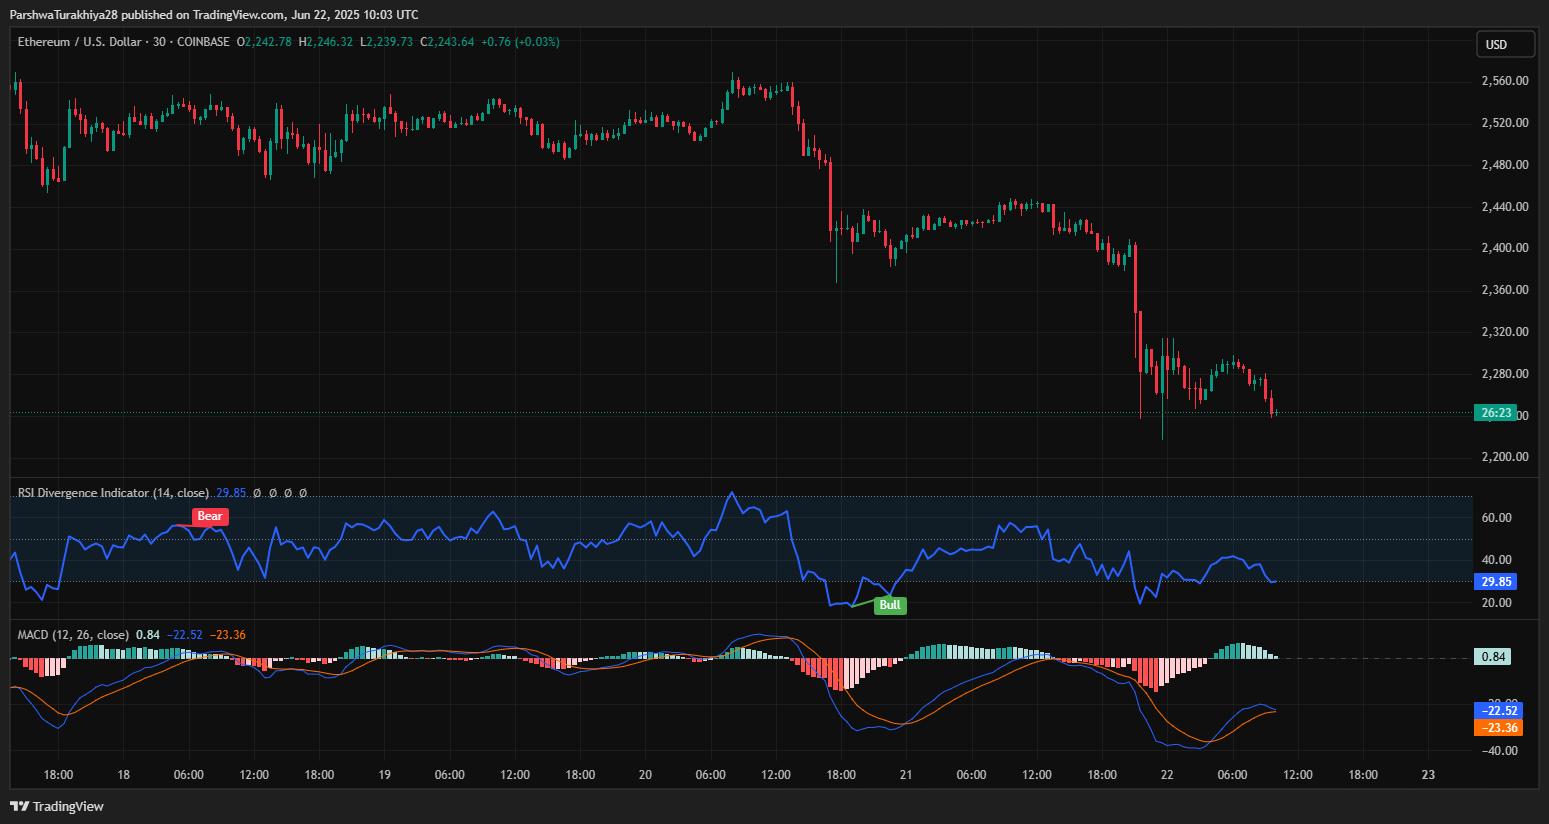
The answer lies in both price structure and on-chain sentiment. The RSI on the 30-minute and 4-hour charts has dropped below 30, now printing 29.85 — a sign of short-term exhaustion, but not yet a confirmed reversal. The MACD histogram on lower timeframes remains flat, with a weak bullish crossover that lacks conviction.
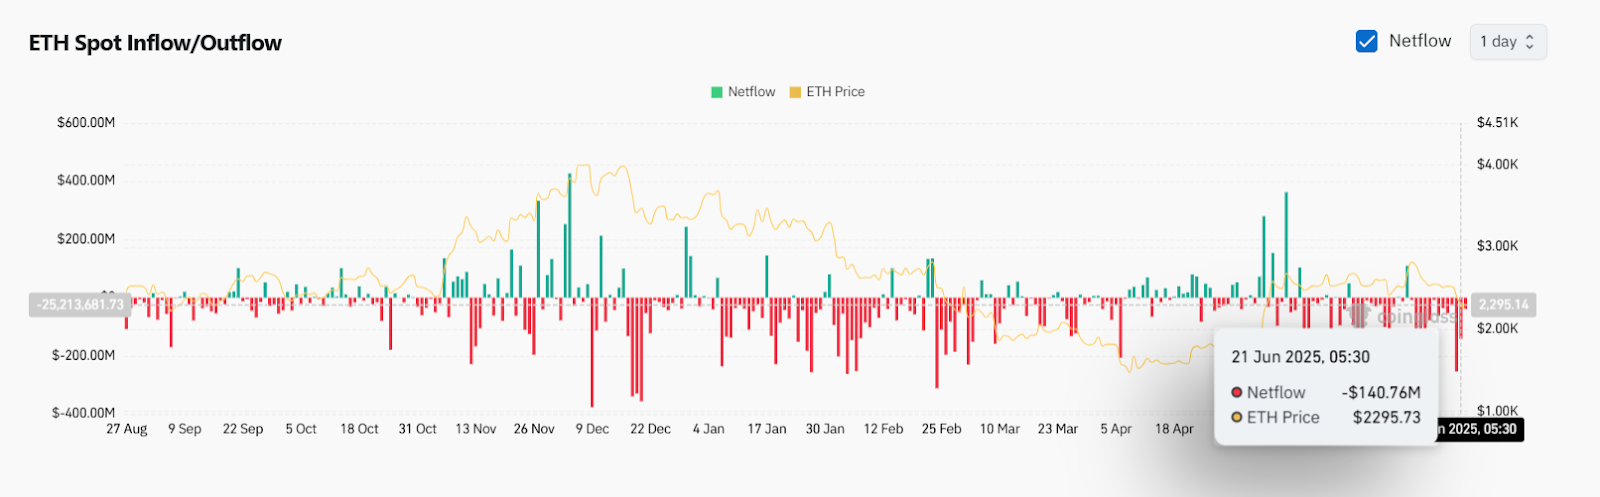
Adding to the bearish narrative, spot Ethereum price spikes have aligned with net outflows. According to on-chain data from June 21, ETH saw a net outflow of $140.76 million, indicating that traders are withdrawing assets from exchanges — typically a bearish signal when accompanied by falling prices.
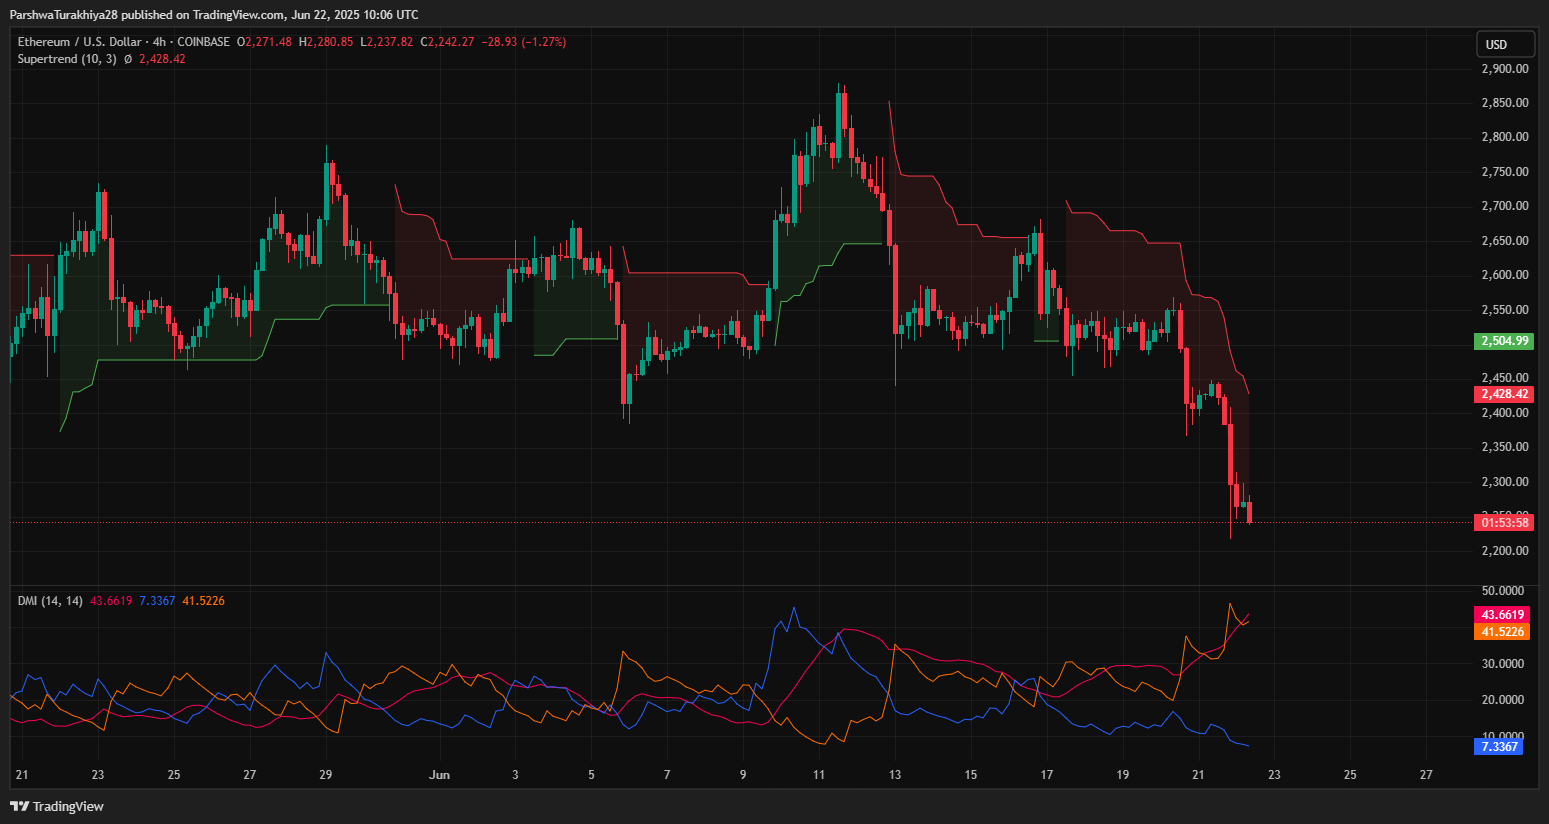
The Supertrend flipped red on June 20 and remains bearish with no reversal signals yet. The ETH price also broke below the rising wedge trendline on the intraday chart. Bearish pressure remains intact unless the price can reclaim the $2,310–$2,330 zone with strength.
Short-Term Outlook: Can Ethereum Defend $2,230?
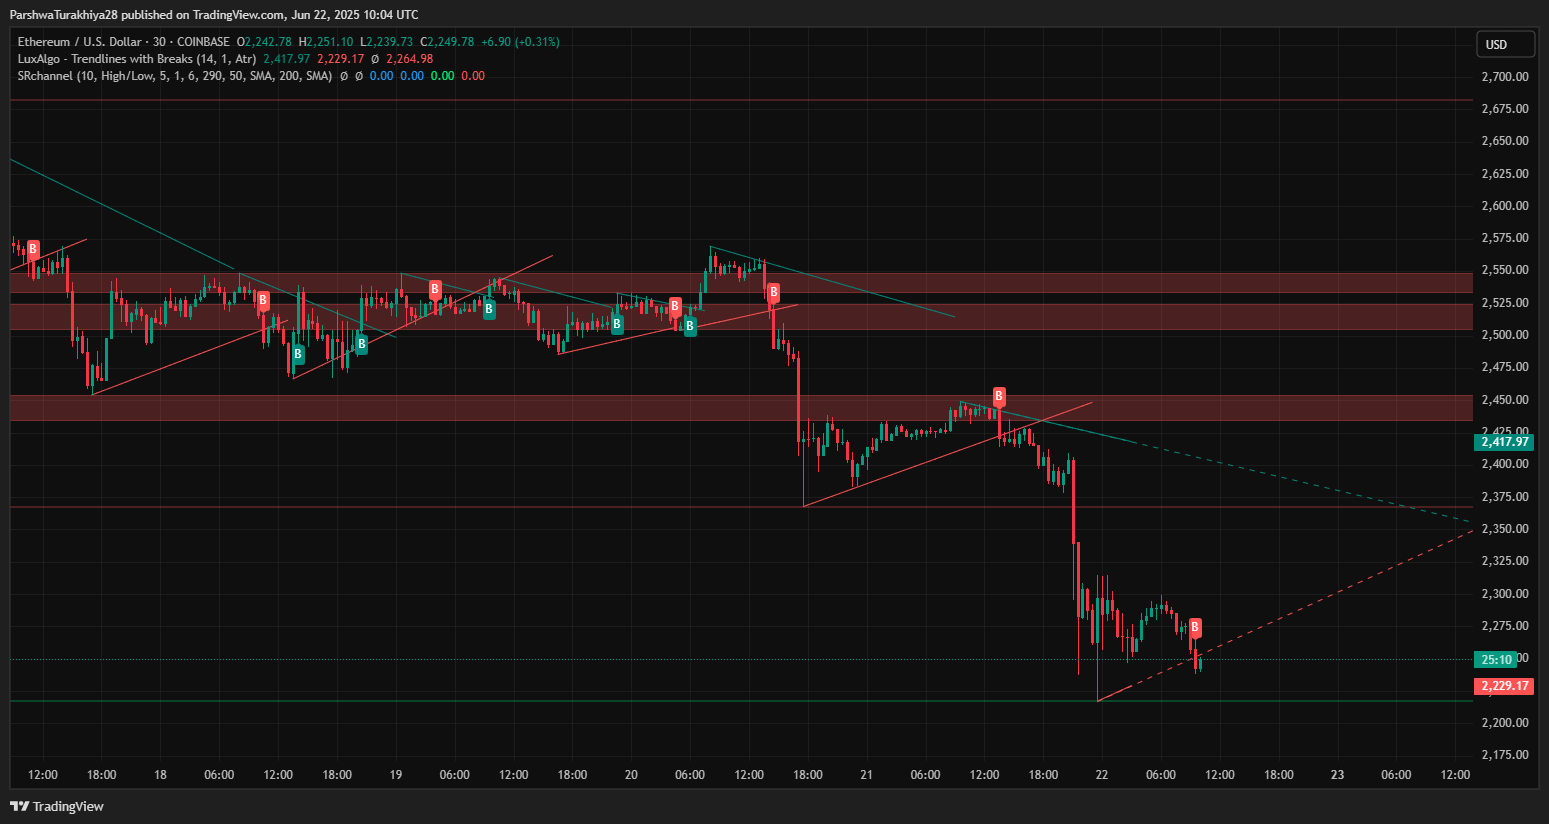
The structure shows ETH trading below key moving averages, including the 20/50/100/200 EMAs on the 4-hour chart. The next immediate support lies at $2,230 — the lower trendline zone from the broader daily channel. If this fails, a move toward $2,100 is likely.
On the upside, reclaiming $2,310 (VWAP and Bollinger mid-line) could open the path toward $2,434 (BB basis) and $2,483 (EMA50). However, volume is thinning, and volatility is expanding, increasing the risk of another leg down before any meaningful recovery attempt.
The Ethereum price update remains bearish while short-term indicators reflect momentum loss. Only a strong push above $2,425 would invalidate the current structure.
Ethereum Price Forecast Table: June 23, 2025
| Indicator / Zone | Level (USD) | Signal |
| Resistance 1 | 2,310 | VWAP / Minor rejection zone |
| Resistance 2 | 2,434–2,483 | EMA50 / BB midline |
| Support 1 | 2,230 | Daily trendline / breakdown edge |
| Support 2 | 2,070–2,100 | Demand zone / prior swing low |
| RSI (4H) | 29.85 | Oversold, bearish |
| MACD (30-min) | Weak Bullish | Momentum fading |
| Bollinger Bands (4H) | Expanding | High volatility |
| Netflow (21 Jun) | -$140.76M | Bearish outflow |
| Supertrend (4H) | Red | Downtrend bias |
Disclaimer: The information presented in this article is for informational and educational purposes only. The article does not constitute financial advice or advice of any kind. Coin Edition is not responsible for any losses incurred as a result of the utilization of content, products, or services mentioned. Readers are advised to exercise caution before taking any action related to the company.


