 Price Prediction For June 25")
After dipping to the $2,200 zone last week, the Ethereum price today has rebounded sharply to trade near $2,417. This recovery follows a bounce from the Bull Market Support Band and a reclaim of the long-term trendline, as buyers re-entered near oversold levels. The current structure shows early signs of bullish intent, but Ethereum still faces considerable resistance from moving average clusters and dynamic volatility bands.
What’s Happening With Ethereum’s Price?
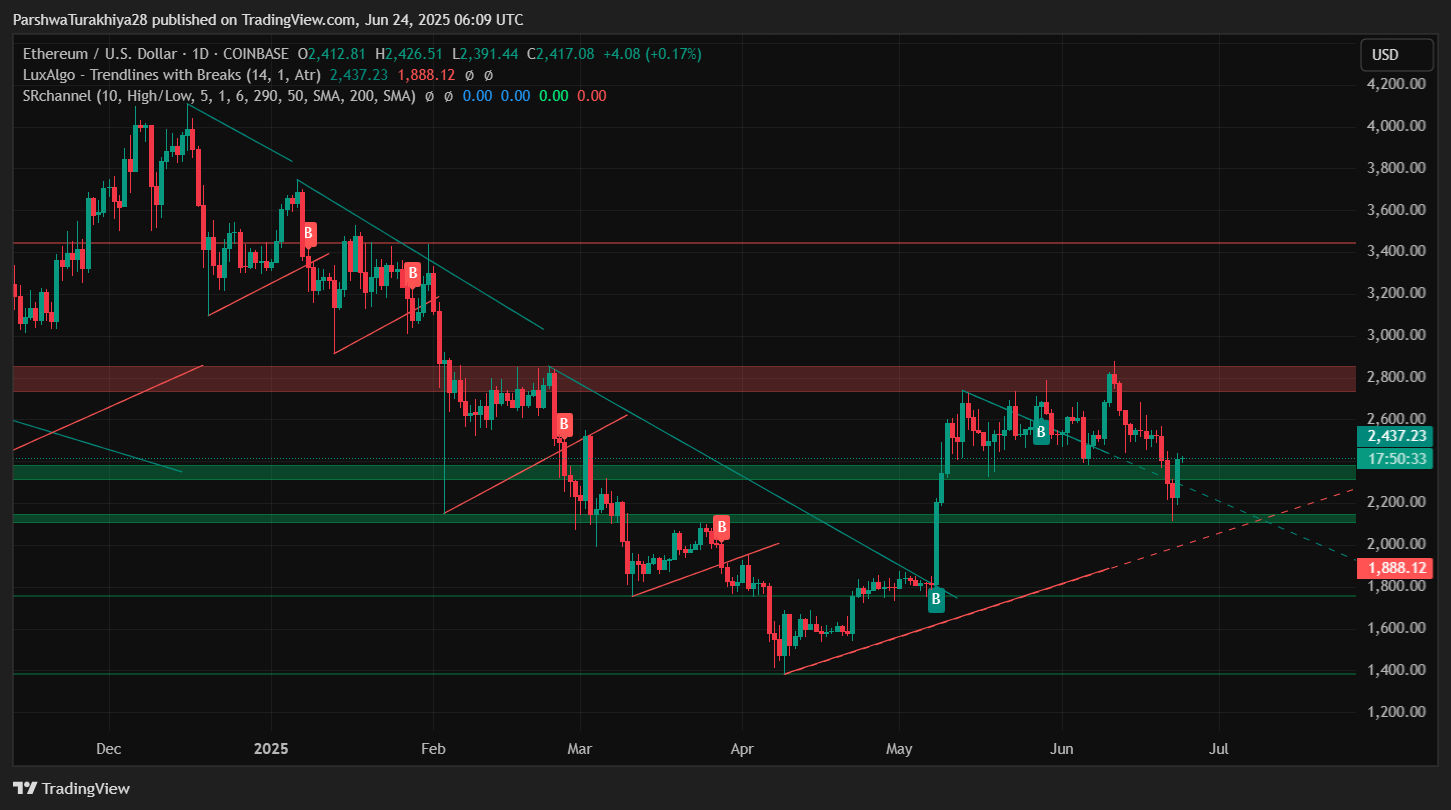
The Ethereum price action over the past two sessions reflects a swift reversal from the $2,200 area, where price intersected the Bull Market Support Band and bounced from the weekly trendline. The daily chart shows ETH reclaiming its long-term diagonal trend support just above $2,205, with the broader structure still leaning bullish as long as the price holds above this zone.
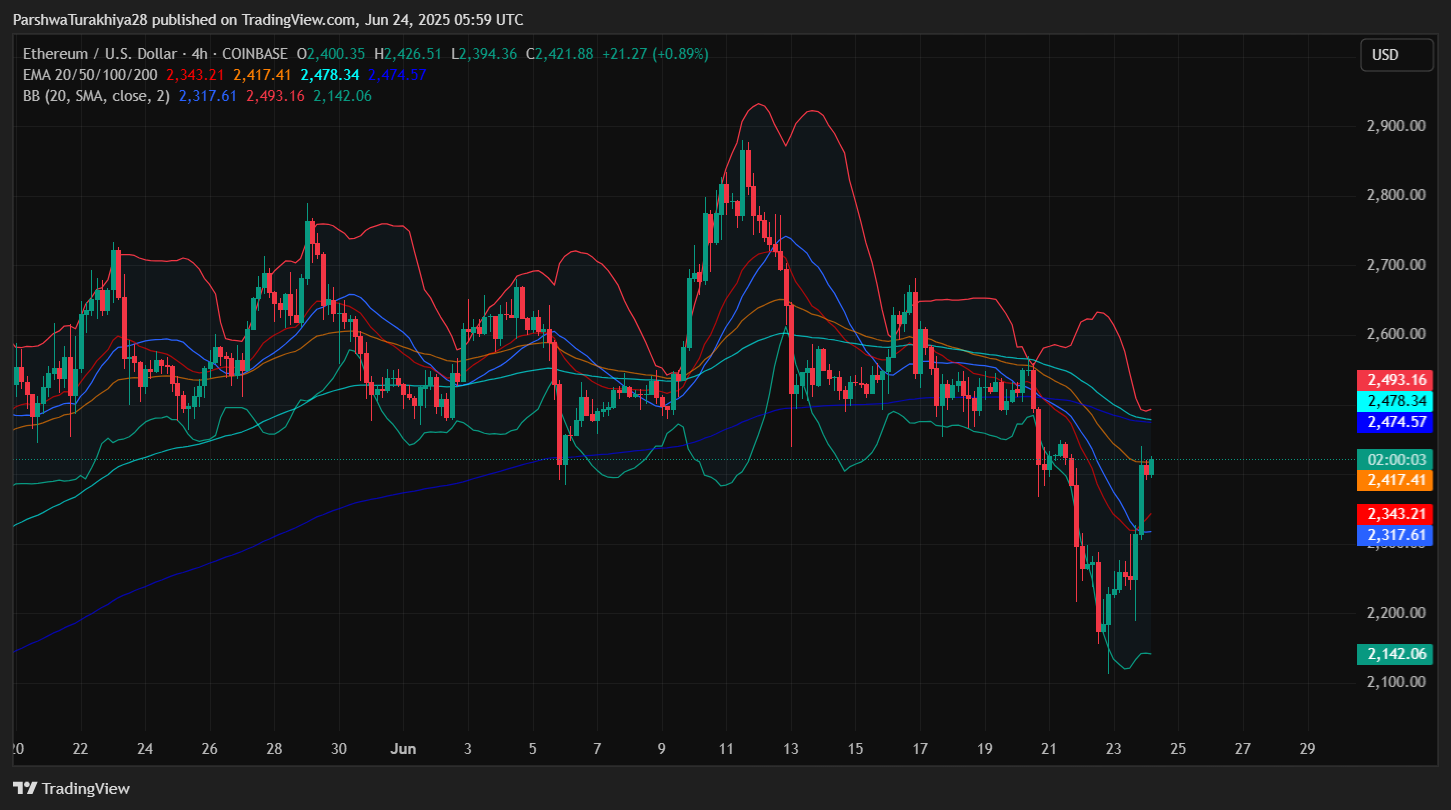
On the 4-hour chart, price is now testing resistance from the EMA 20/50/100 cluster, between $2,343 and $2,478. The upper Bollinger Band sits near $2,493, forming a key confluence resistance. Meanwhile, the Donchian Channel upper bound aligns near $2,449, adding to the overhead barrier.
Why is the Ethereum Price Going Up Today?
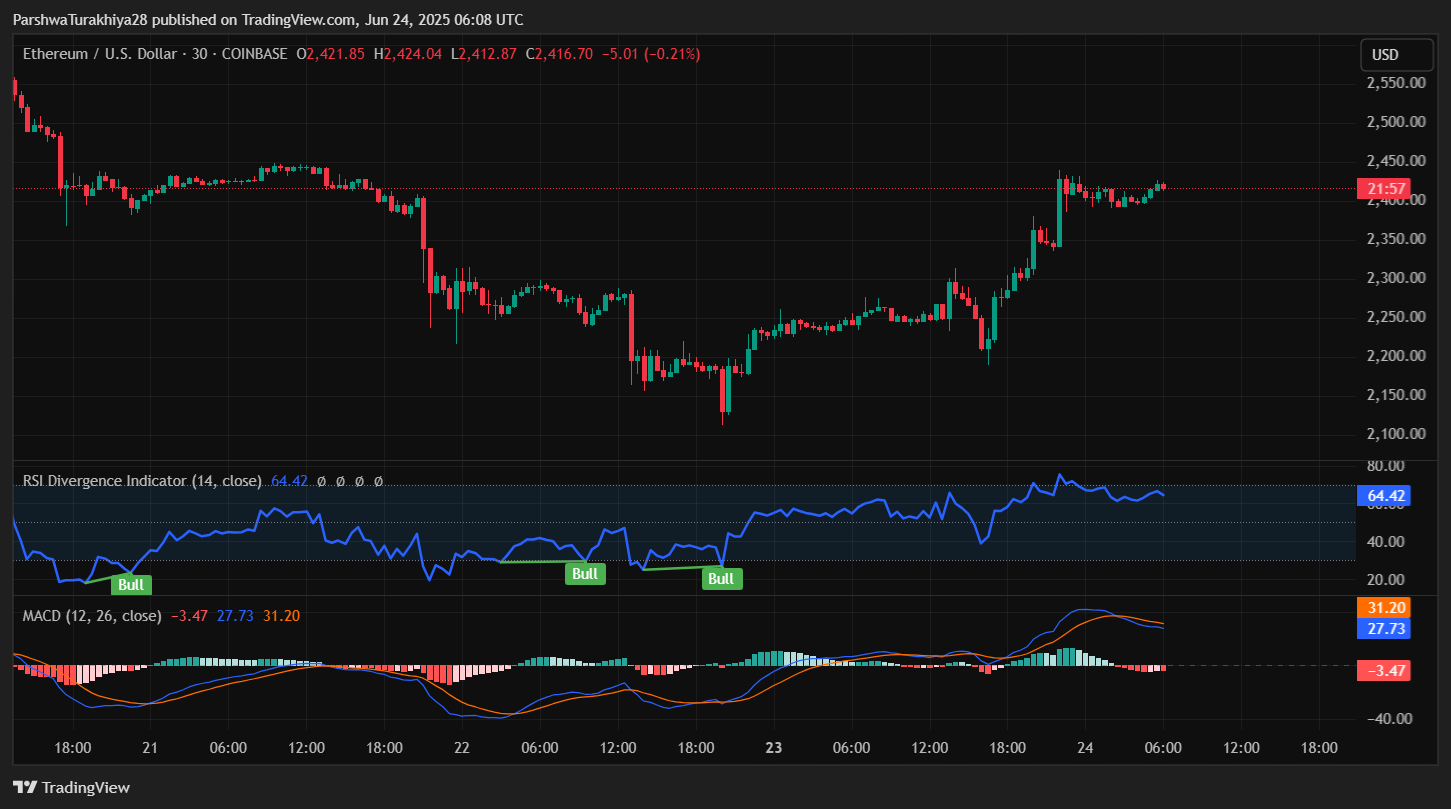
The current move higher in Ethereum price is supported by a cluster of bullish signals across multiple indicators. On the 30-minute chart, the RSI stands at 64.42, indicating strong momentum, although it is nearing overbought territory. MACD remains in bullish territory but is beginning to flatten, suggesting short-term caution.
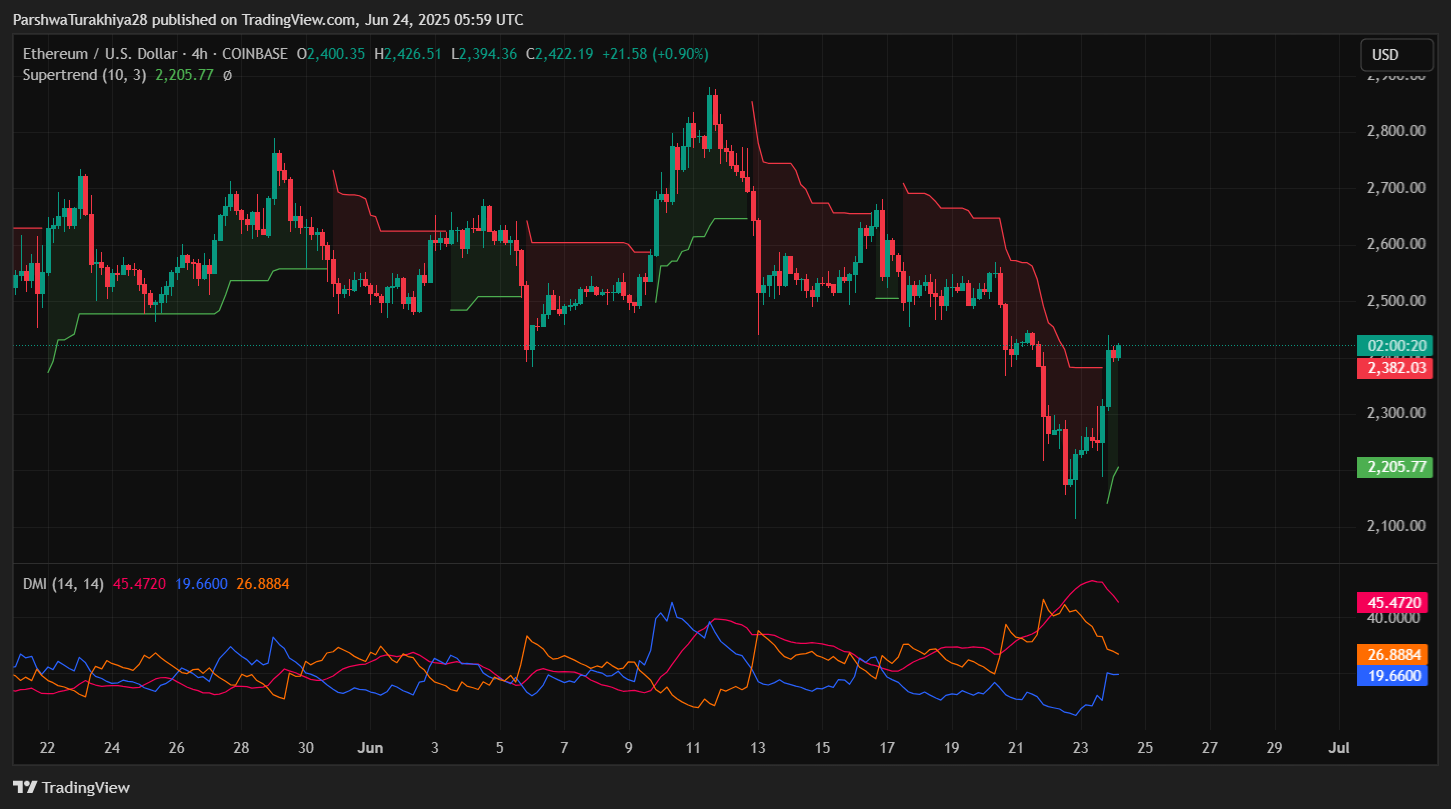
The Supertrend indicator has flipped bullish again on the 4-hour chart, with trendline support positioned near $2,205. Directional momentum is improving. The DMI shows a rising +DI (26.88) while -DI remains elevated at 45.47, indicating that bulls are regaining strength but haven’t fully taken control yet.
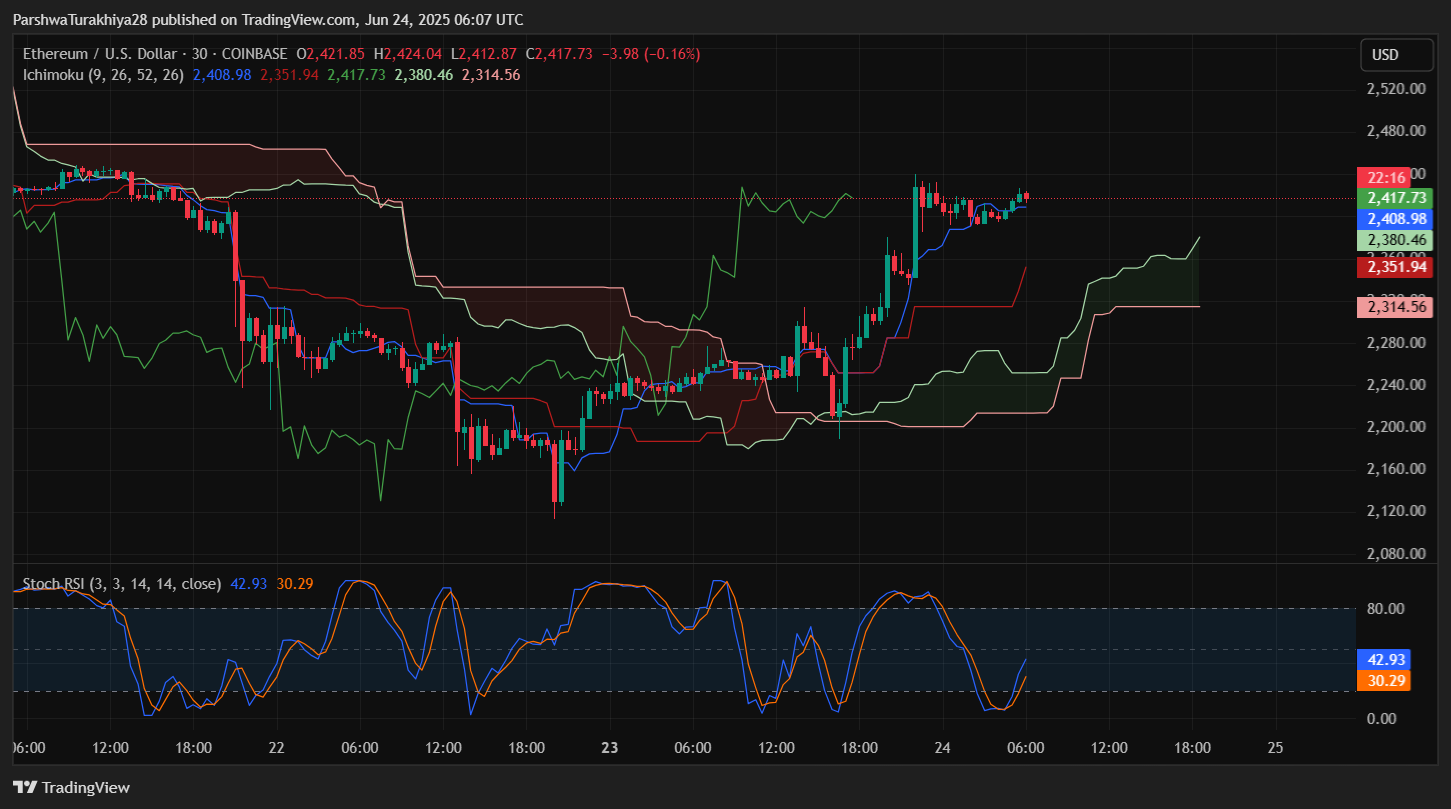
Ichimoku Cloud readings also confirm improving sentiment, as ETH trades above the Tenkan-sen and Kijun-sen lines, with the Chikou Span attempting to rise past price structure. Stochastic RSI, Fisher, and Klinger Oscillator are all curving upward, supporting the probability of further upside if price maintains above $2,380.
Ethereum Price Volatility Rises As Momentum Rebuilds
Volatility is returning to the Ethereum chart. The Bollinger Band Width is expanding after a squeeze, which usually precedes strong directional movement. Ethereum is currently hovering just below the mid-band resistance, with the next breakout zone lying between $2,449 and $2,493.
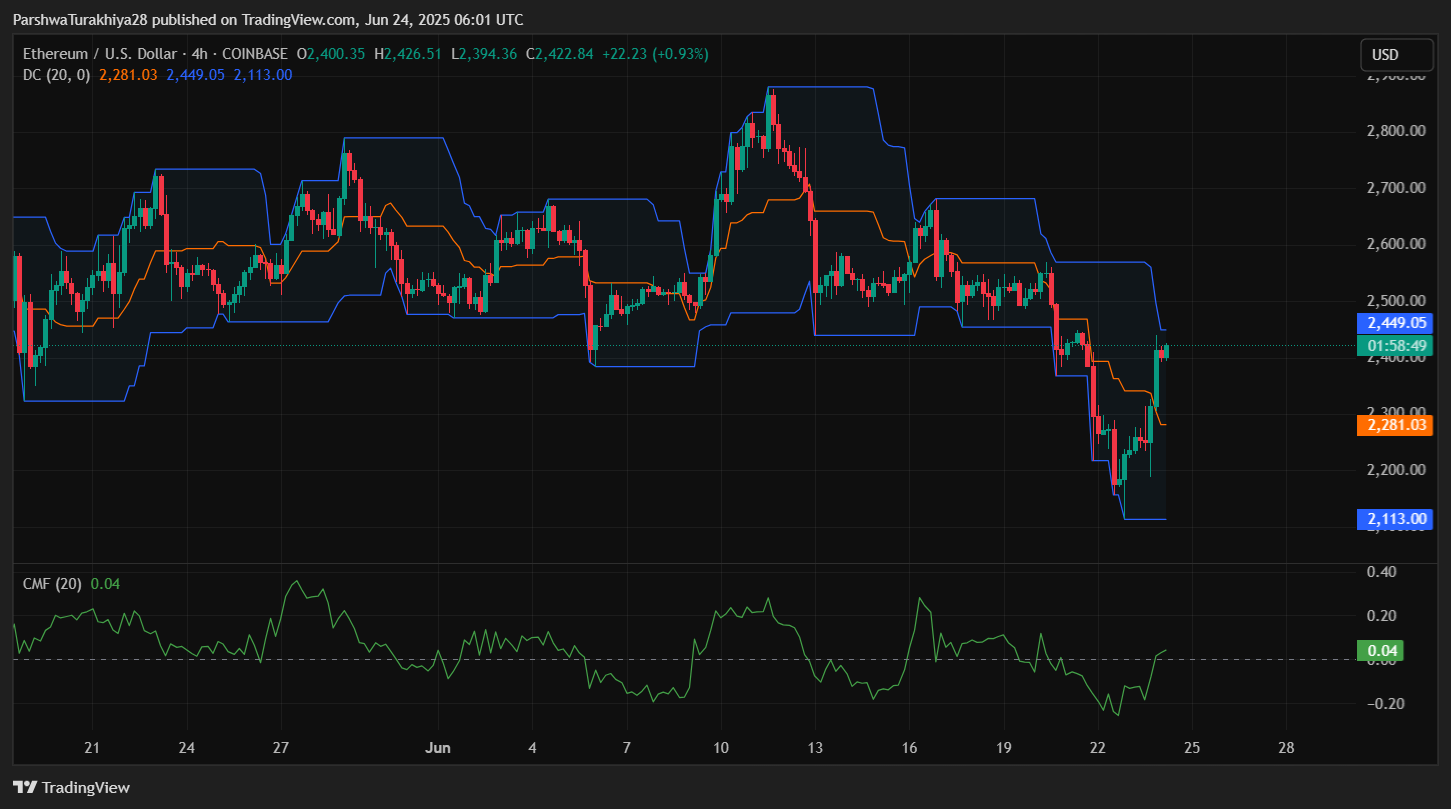
The price is also re-entering the upper boundary of the Donchian Channel, reinforcing this region as a short-term decision point. On the daily chart, the price must clear the $2,437–$2,478 resistance zone with strong volume to trigger a larger move toward $2,600 and $2,745. Chaikin Money Flow (CMF) sits marginally positive at 0.04, hinting at weak but stabilizing inflows.
Should Ethereum face rejection from these bands, support levels to watch include $2,343 (EMA20), followed by the dynamic confluence around $2,281–$2,317, which includes prior consolidation and Bollinger base support.
Short-Term Outlook: Can Ethereum Price Sustain Its Recovery?
The short-term trend for ETH has shifted bullish, but key tests lie immediately ahead. A clear breakout above $2,450 with volume support could lead to a measured move toward $2,600. Conversely, a rejection and retracement below $2,343 would suggest consolidation or a possible retest of $2,281 and $2,205 levels.
The Ethereum price volatility is expanding, and the combination of higher lows and momentum recovery suggests upside potential remains intact — but price must clear multiple technical barriers for further continuation.
Ethereum Price Forecast Table
| Indicator/Zone | Level (USD) | Signal Description |
| Ethereum price today | $2,417 | Current spot price |
| Resistance 1 | $2,449 | Donchian upper band |
| Resistance 2 | $2,493 | Upper Bollinger Band |
| Support 1 | $2,343 | EMA20 short-term support |
| Support 2 | $2,281 | Mid-zone consolidation base |
| Supertrend (4H) | $2,205 | Trend support flipped bullish |
| RSI (30-min) | 64.42 | Bullish but nearing overbought |
| MACD (30-min) | Bullish | Momentum strong but flattening |
| DMI (+DI/-DI) | 26.88 / 45.47 | Improving buyer interest |
| CMF (20) | 0.04 | Weak inflows |
| Bollinger Band Width | Expanding | Volatility increase underway |
Disclaimer: The information presented in this article is for informational and educational purposes only. The article does not constitute financial advice or advice of any kind. Coin Edition is not responsible for any losses incurred as a result of the utilization of content, products, or services mentioned. Readers are advised to exercise caution before taking any action related to the company.


