
- Ethereum falls below the 20/50/100/200-day EMAs, trading near $2,103 despite ETF inflows returning after three days of redemptions.
- $57 million in institutional inflows fail to halt the breakdown as open interest rises 1.48% and long/short ratios remain elevated at 2.39.
- Sellers target $2,000 psychological support with next demand zone sitting at $1,900 to $1,850 if the floor breaks.
Ethereum price today trades near $2,103, down over 4% in the past 24 hours after breaking below critical support that held since late January. The move places technical pressure on buyers despite improving institutional flows, suggesting the chart structure is driving the sell program rather than fundamental positioning.
ETF Inflows Return But Fail To Reverse Price Action
Ethereum spot ETFs recorded $57.05 million in net inflows on February 9, according to SoSoValue data. The reversal marks the first positive flow session after three consecutive days of outflows totaling over $176 million.
BlackRock’s ETHA led with $12.04 million in fresh capital, while Grayscale’s products saw flat to minor activity.
Derivatives Positioning Shows Elevated Leverage Into Breakdown
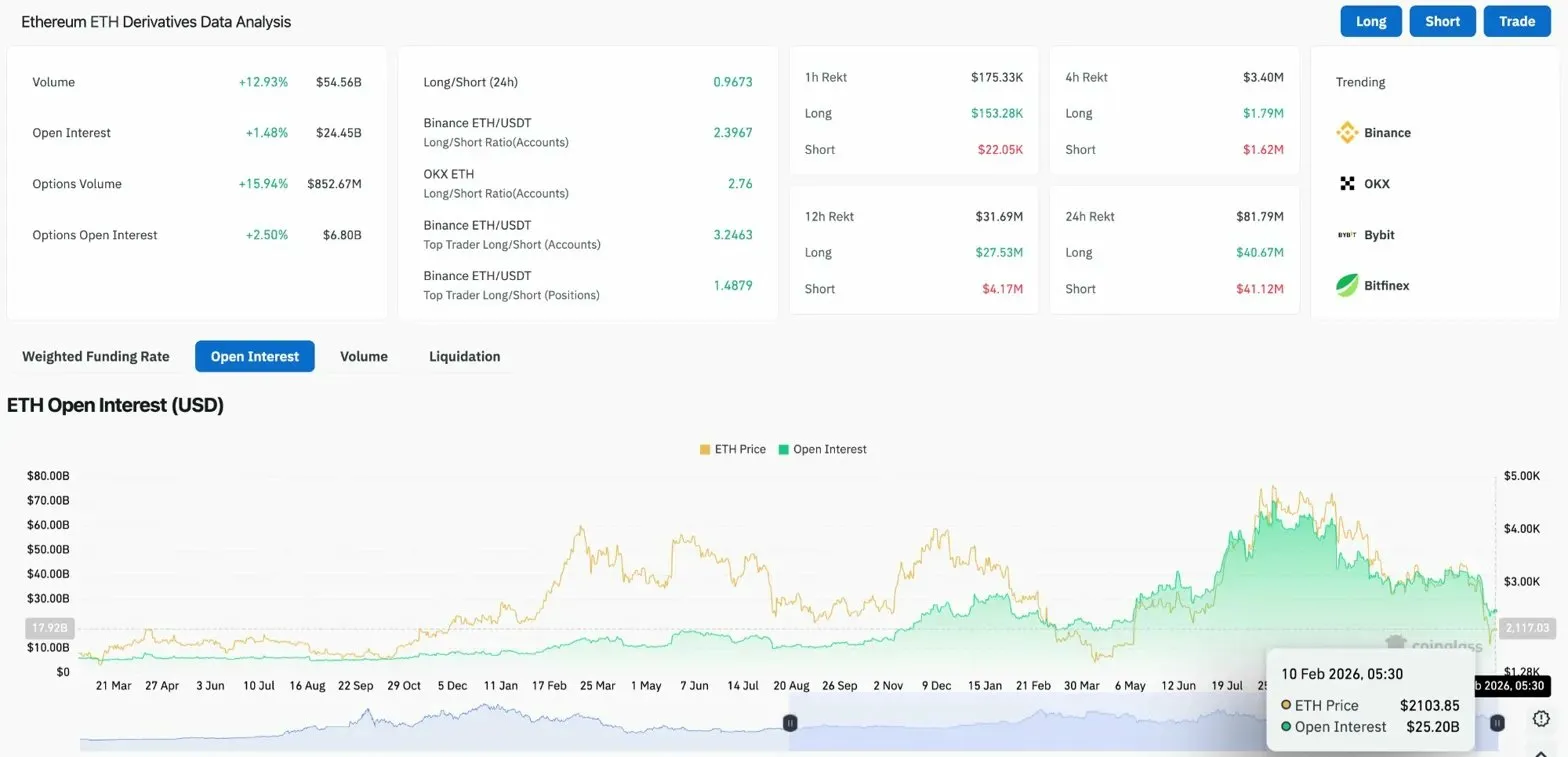
Open interest climbed 1.48% to $24.45 billion as Ethereum broke support, signaling that traders are adding positions into volatility rather than closing them. Volume surged 12.93% to $54.56 billion, confirming active participation on both sides.
The long/short ratio on Binance sits at 2.39 for accounts and 3.24 for top traders, meaning leverage remains heavily skewed toward longs. When positioning is this imbalanced and price breaks key support, liquidations accelerate the move as stop-losses trigger in sequence. That dynamic is playing out across the derivatives complex as Ethereum tests deeper zones.
Options volume jumped 15.94% to $852.67 million while options open interest rose 2.50% to $6.80 billion. The spike in options activity reflects traders either hedging downside risk or betting on a reversal from oversold conditions.
All EMAs Flip Into Resistance After Multi-Week Breakdown
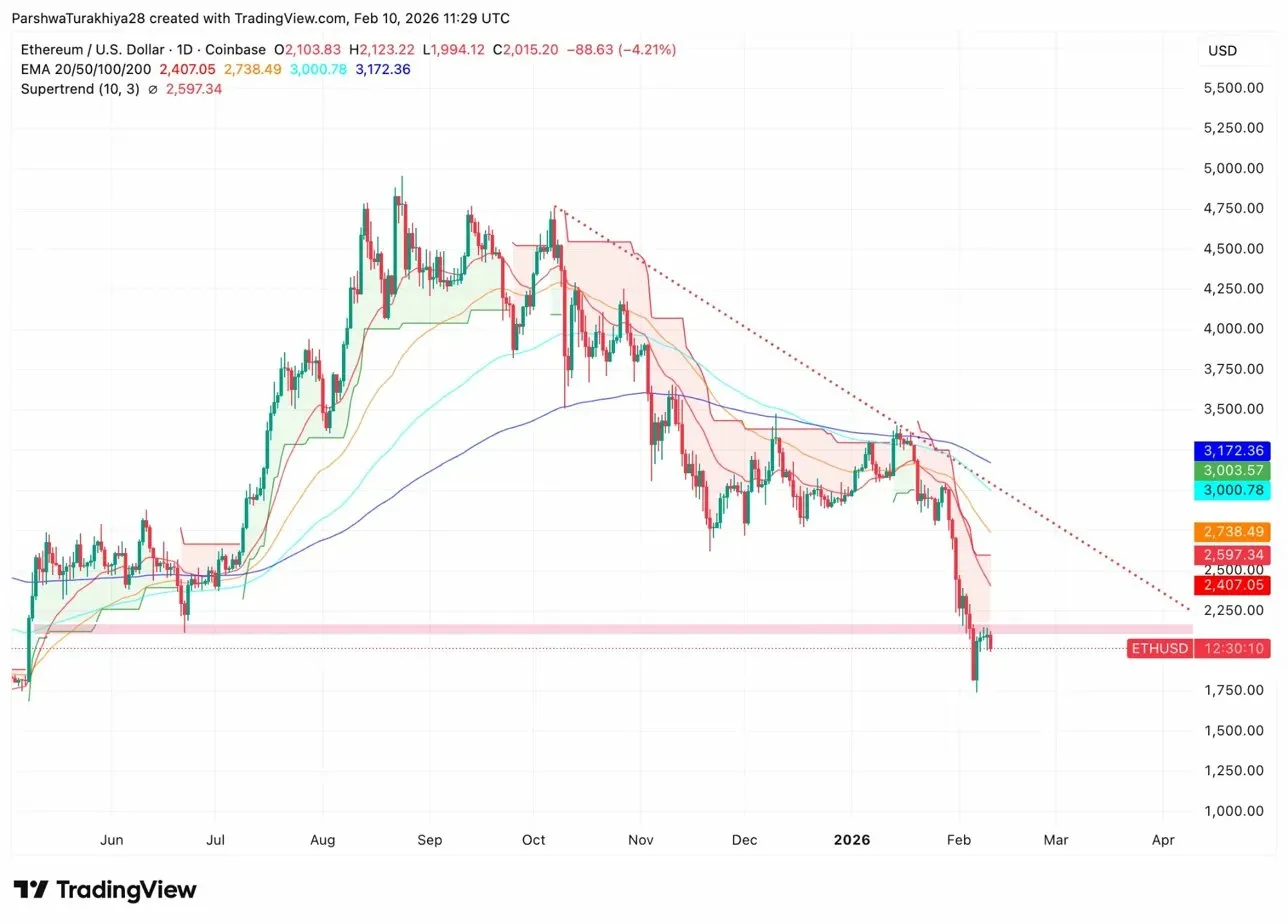
Ethereum price today sits below all four major moving averages for the first time since early January. The 20-day EMA at $2,407, the 50-day EMA at $2,738, the 100-day EMA at $3,000, and the 200-day EMA at $3,172 now form a stacked resistance ceiling that buyers must reclaim to shift momentum.
The daily chart shows a clean break below multi-week consolidation and the loss of trendline support that guided price higher since the start of the year. Sellers defended $2,500 repeatedly over the past week before forcing a decisive close below it, opening the door to the current leg lower.
Key levels now:
- Immediate support: $2,000
- Major demand zone: $1,900 to $1,850
- First resistance: $2,407 (20-day EMA)
- Major resistance cluster: $2,738 to $3,000
The Supertrend indicator flipped red at $2,597 on the daily timeframe, confirming the trend has shifted bearish in the short term. Until Ethereum reclaims that level with volume, every bounce remains reactionary rather than trend-changing.
Intraday Charts Show Stabilization Attempts At $2,000
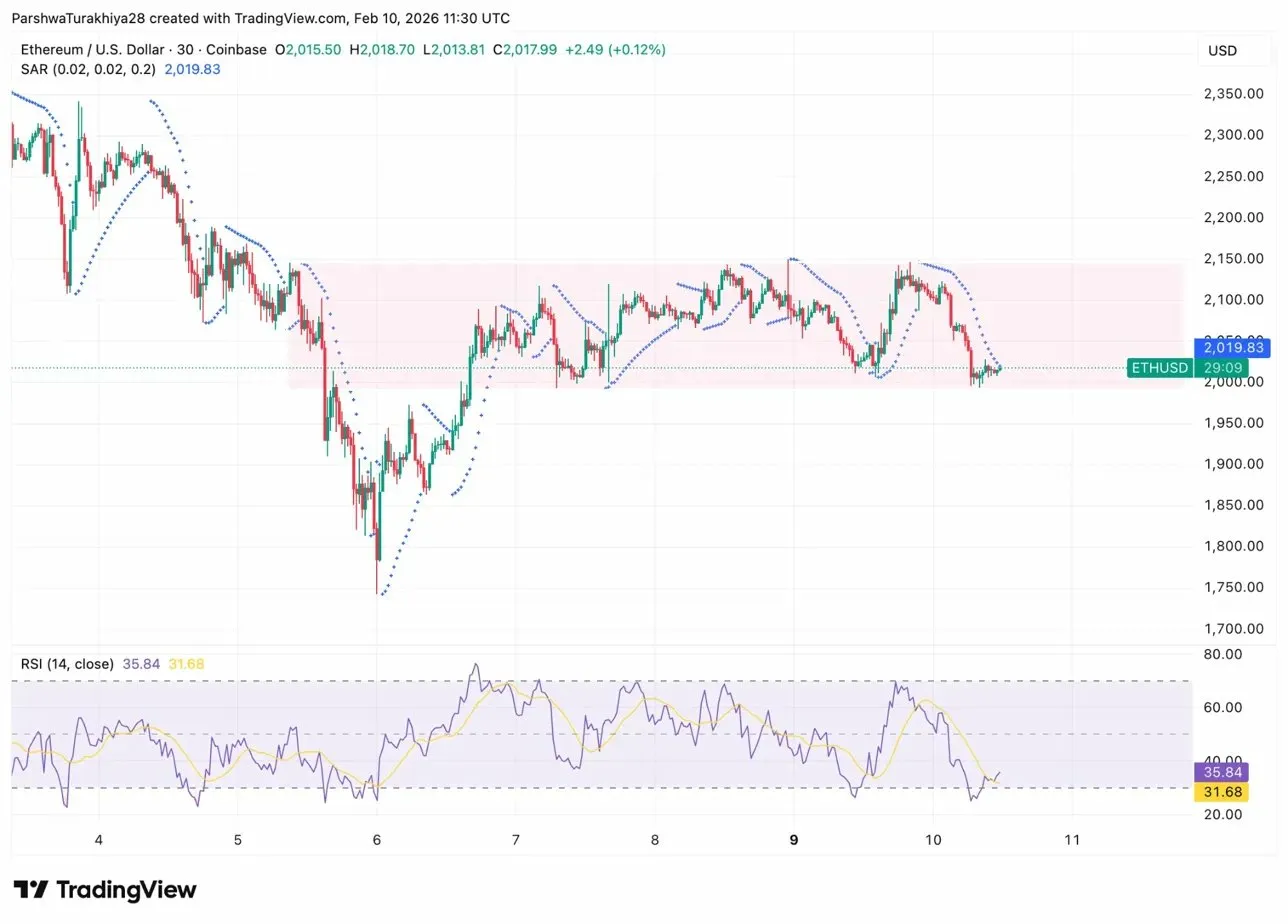
On the 30-minute chart, Ethereum is attempting to hold the $2,000 to $2,019 zone. The RSI recovered from 31 to 35 after the initial flush, showing some relief from oversold conditions. However, the Parabolic SAR remains above price at $2,019, keeping downside pressure intact.
Bulls need a close above $2,050 to flip the immediate bearish structure on lower timeframes. That move would shift the Supertrend and give buyers room to test $2,100 resistance. Without follow-through above that level, the bounce stays technical rather than directional.
The tension between improving ETF flows and deteriorating technicals creates a decision point. Either institutional demand accelerates and absorbs selling pressure, or technical sellers push through $2,000 and force a deeper reset before buyers return.
Outlook: Will Ethereum Go Up?
The next move depends on whether Ethereum can hold $2,000, a psychological level that has acted as a pivot during previous corrections.
- Bullish case: Ethereum defends $2,000 and closes above $2,407 with rising volume. That reclaims the 20-day EMA and signals the first step toward reversing the breakdown.
- Bearish case: A daily close below $2,000 confirms the break and exposes $1,900 to $1,850. Losing that zone opens the door to $1,750.
Disclaimer: The information presented in this article is for informational and educational purposes only. The article does not constitute financial advice or advice of any kind. Coin Edition is not responsible for any losses incurred as a result of the utilization of content, products, or services mentioned. Readers are advised to exercise caution before taking any action related to the company.


