
- Ethereum holds $4,182 support, eyeing breakout at $4,300 toward higher Fib targets
- Persistent exchange outflows highlight strong accumulation and reduced selling pressure
- Failure to defend $4,182 risks bearish momentum, with $3,820 as critical demand zone
Ethereum has regained strength in recent sessions, bouncing off key support levels and displaying resilience across technical and on-chain metrics. After a sharp defense near $3,820, buyers quickly stepped in to establish a solid base. This recovery has positioned ETH to challenge new resistance zones while exchange activity suggests growing confidence among long-term holders.
Technical Structure Strengthens Around $4,300
On the 4-hour chart, Ethereum reclaimed the $4,182 level, which coincides with the 0.382 Fibonacci retracement. This area now acts as immediate support and will be crucial for maintaining momentum.
Currently, ETH is testing resistance between $4,293 and $4,300, aligning with the 0.5 Fib zone. A decisive breakout could open the path to $4,406, and further to $4,565 at the 0.786 level.
On the downside, support levels rest at $4,182 and $4,043. A drop below these levels would bring $3,820 back into focus as the major demand zone.
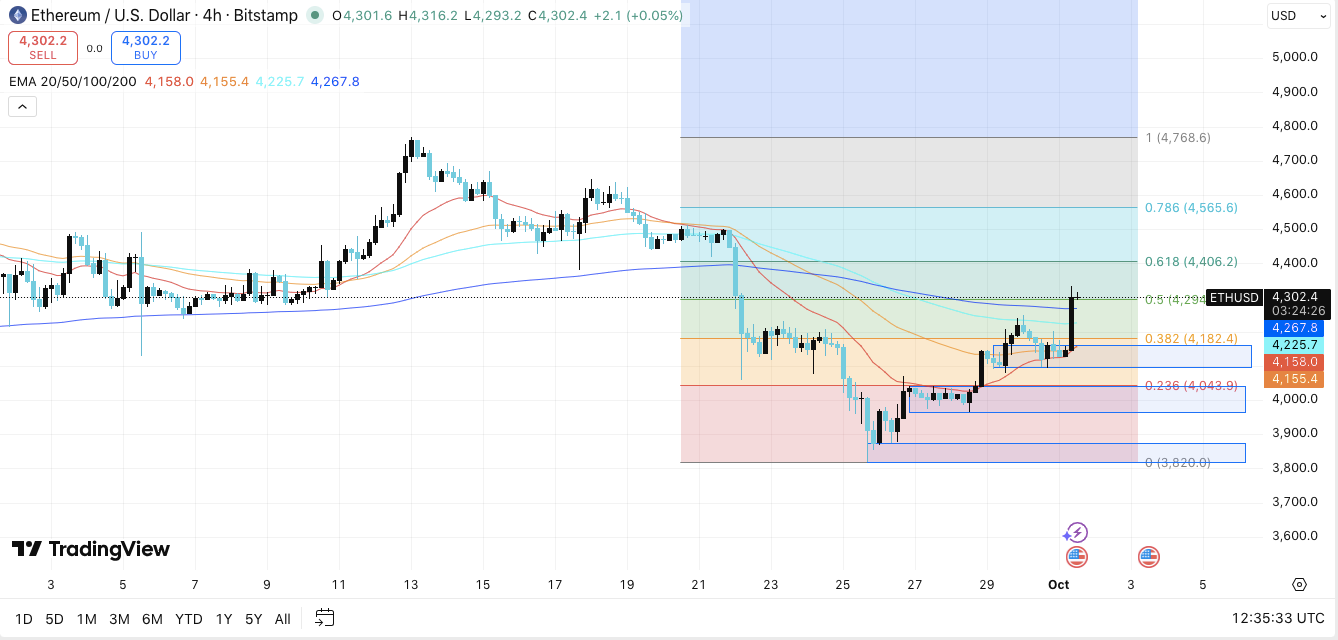
Moving averages across 20, 50, 100, and 200 periods are flattening, suggesting the market is at a potential turning point. Hence, price action around $4,300 may determine Ethereum’s direction in the short term.
Related: Ethereum Price Prediction: Analysts Watch $4,359 Level As Short Squeeze Threatens Bears
Exchange Flows Highlight Investor Behavior
Beyond chart levels, on-chain flows provide valuable insights. Netflows have remained mostly negative over recent months, reflecting consistent outflows from exchanges. This trend suggests that investors prefer holding ETH in private wallets or staking environments, which typically reduces available supply for trading.
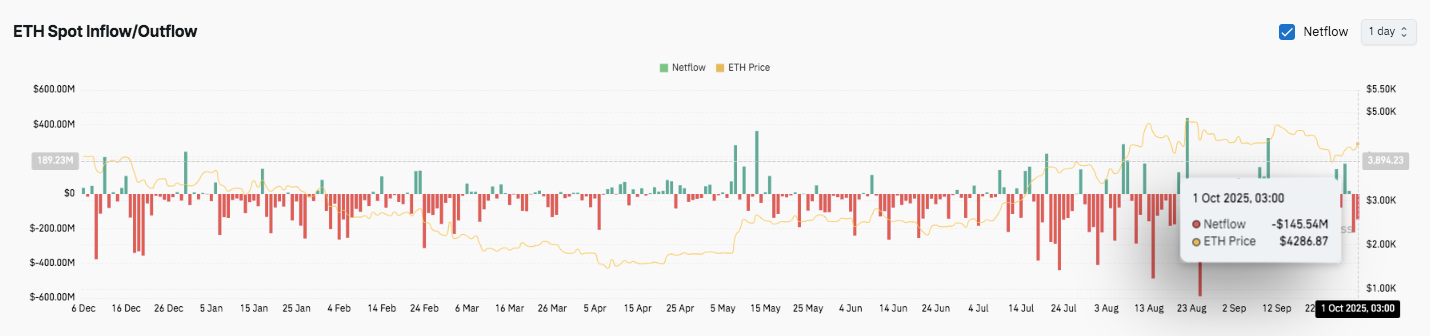
Significantly, a large withdrawal of $145.54 million occurred on October 1 when ETH traded near $4,286.87. Such spikes often reduce selling pressure, aligning with bullish undertones. Occasional inflows did occur, but they carried less impact compared to persistent outflows. Consequently, the balance continues to tilt toward accumulation.
Technical Outlook For Ethereum Price
Ethereum price prediction in the short term remains tied to a few key levels:
- Upside levels: $4,300, $4,406, and $4,565.
- Downside levels: $4,182, $4,043, and $3,820.
- Trend pivots: 20/50 EMA cluster around $4,200, with the 200 EMA deeper near $3,900.
A sustained close above $4,300 would confirm bullish continuation, targeting $4,406 and later $4,565. On the other hand, a breakdown below $4,182 risks retesting $4,043, with $3,820 acting as the critical demand zone.
Related: ETH Price Analysis: Can Ethereum Break $4,500 to Target $10,000?
Will Ethereum Push Higher?
The direction for Ethereum hinges on its ability to hold the $4,182–$4,200 band. As long as this support cluster remains intact, analysts expect another push toward $4,300 and $4,406.
Exchange flows add weight to the bullish case. Persistent outflows suggest accumulation and reduced selling pressure, aligning with investor confidence at higher prices.
However, failure to defend $4,182 could shift momentum back to bears and trigger a drop toward $3,820. For now, Ethereum remains at a decisive crossroad, reclaiming $4,300 could unlock further upside, while losing support risks a deeper retracement.
Disclaimer: The information presented in this article is for informational and educational purposes only. The article does not constitute financial advice or advice of any kind. Coin Edition is not responsible for any losses incurred as a result of the utilization of content, products, or services mentioned. Readers are advised to exercise caution before taking any action related to the company.


