
- Ethereum trades at $2,030, up 0.31%, holding above the 4-hour BB midline at $2,029 as OBV trends higher.
- Open interest rises 2.36% to $27.28B while volume pulls back 11.76% to $45.18B, with shorts absorbing $24M in 24-hour liquidations.
- US Ethereum spot ETFs recorded $57.01M in net inflows on March 11, with all nine ETFs reporting zero outflows.
Ethereum price today trades near $2,030, up 0.31%, as buyers hold the Bollinger Band midline at $2,029 on the 4-hour chart following two days of steady recovery from the March 9 lows near $1,920.
4-Hour Chart: OBV Confirms Buying Pressure As Trendline Holds
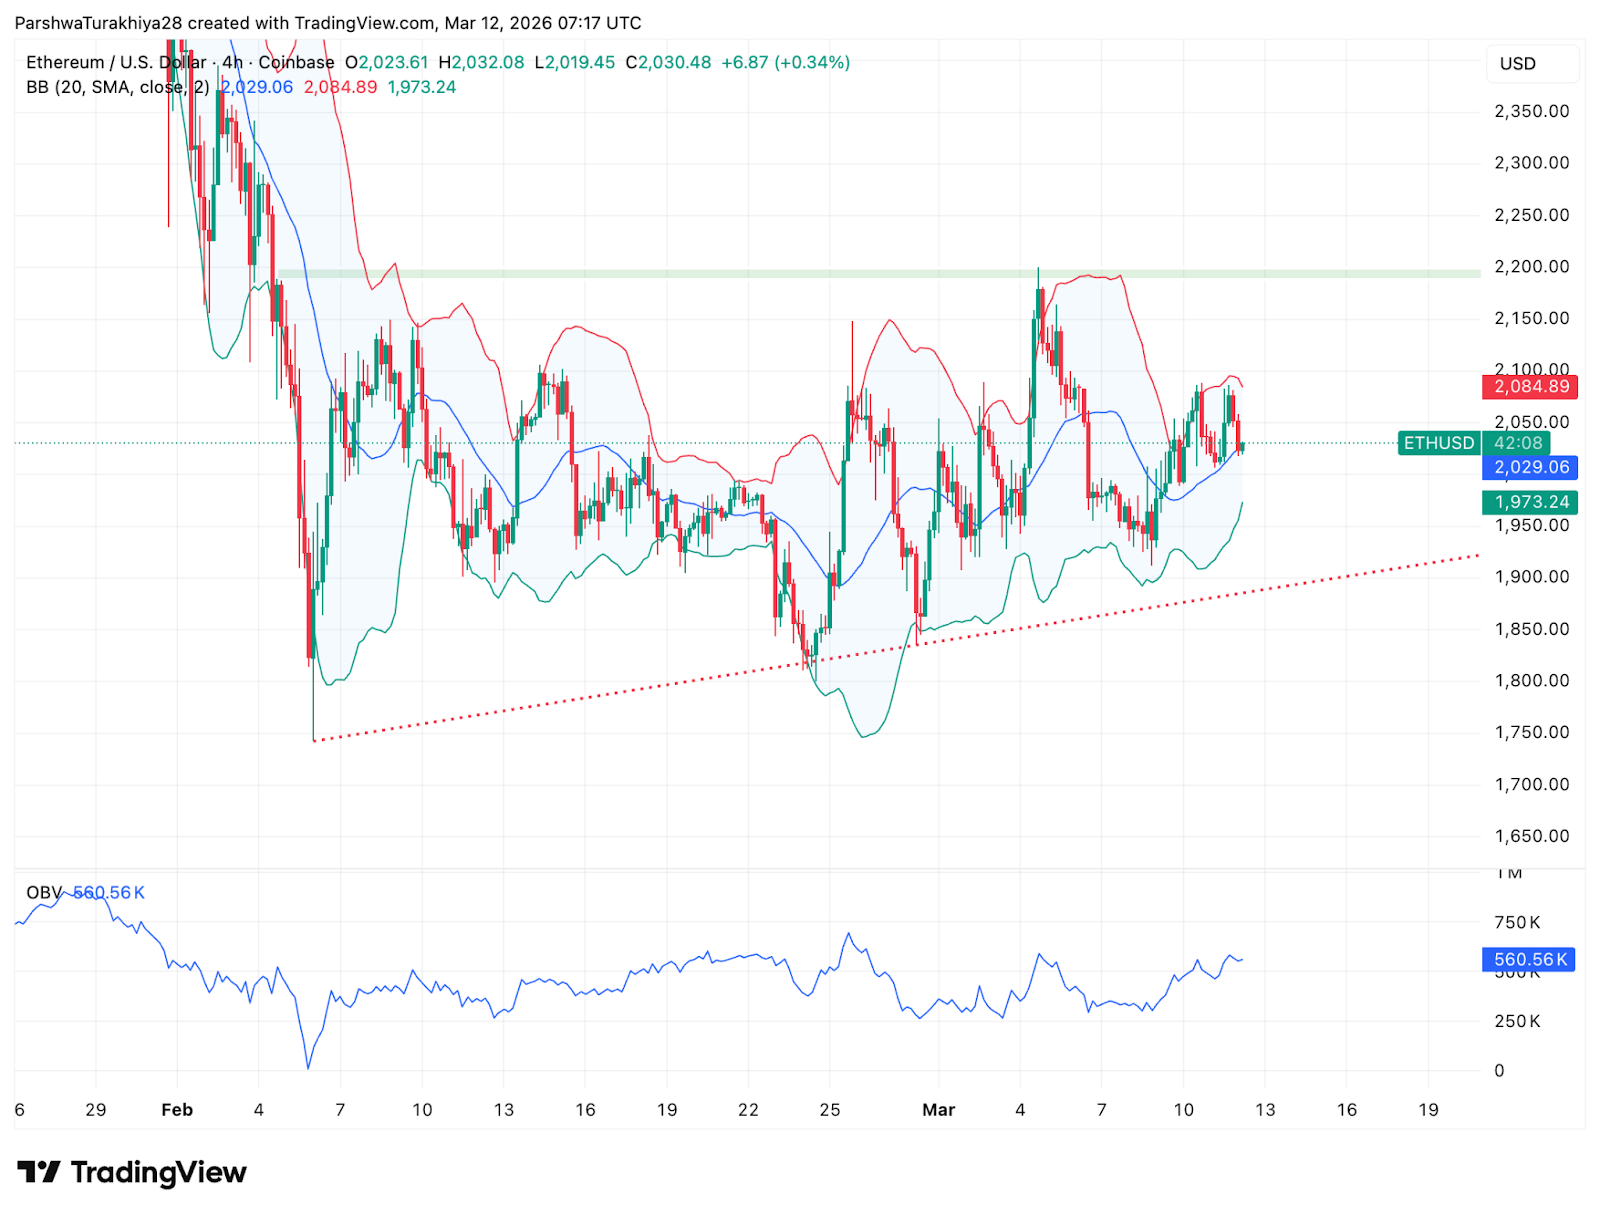
The 4-hour chart shows Ethereum respecting an ascending trendline from the February lows near $1,750, with price currently pressing against the BB midline at $2,029 and upper band at $2,084. OBV has been trending higher alongside each price recovery, confirming that volume is flowing into rather than out of the market on up moves. That positive divergence between OBV and price during the recent range suggests accumulation rather than distribution.
The $2,200 horizontal resistance zone visible on the 4-hour chart has rejected price three times since February. A clean break above the upper Bollinger Band at $2,084 would be the first step toward retesting that level. Below, the lower BB at $1,973 and the ascending trendline near $1,900 define the support structure.
Key levels:
- Ascending trendline support: ~$1,900 rising
- Lower BB support: $1,973
- BB midline: $2,029
- Upper BB resistance: $2,084
- Key resistance zone: $2,200
1-Hour Chart: Rising Wedge With SAR Overhead
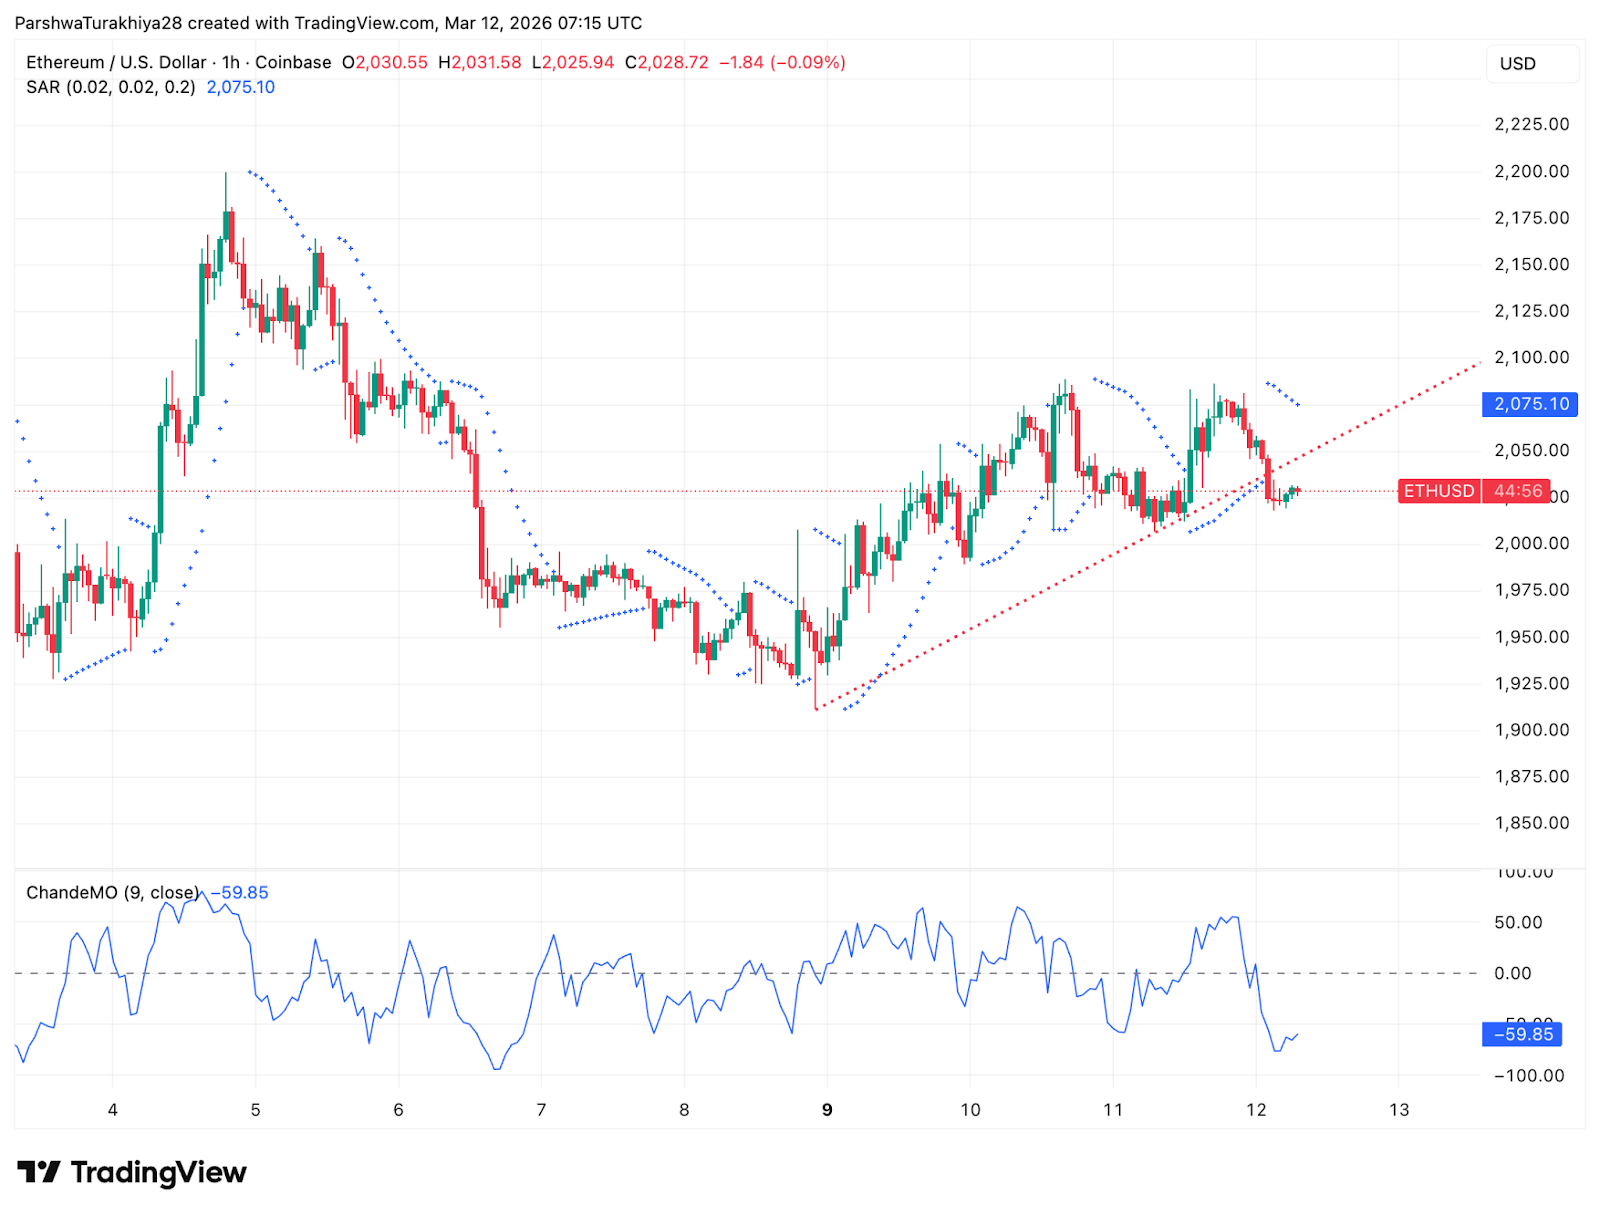
The 1-hour chart shows a rising wedge forming from the March 9 lows, with price pushing toward the Parabolic SAR at $2,077 that currently sits above as resistance. The Chande Momentum Oscillator reads -66.40, deeply negative and sitting near levels that have historically preceded short-term bounces rather than further acceleration lower.
Related: Hyperliquid Price Prediction: HYPE Shows Early Bullish Recovery, $51 Target in Sight
Price is compressing between the wedge boundaries with the lower support near $2,010 and the SAR resistance at $2,077. A flip of the SAR to support would be the short-term signal that momentum has shifted, targeting the $2,084 BB upper band on the 4-hour chart as the next meaningful resistance.
Key 1-hour levels:
- Wedge lower support: ~$2,010
- SAR resistance: $2,077
- Target on SAR flip: $2,084 to $2,100
Derivatives: OI Rises As Shorts Cover
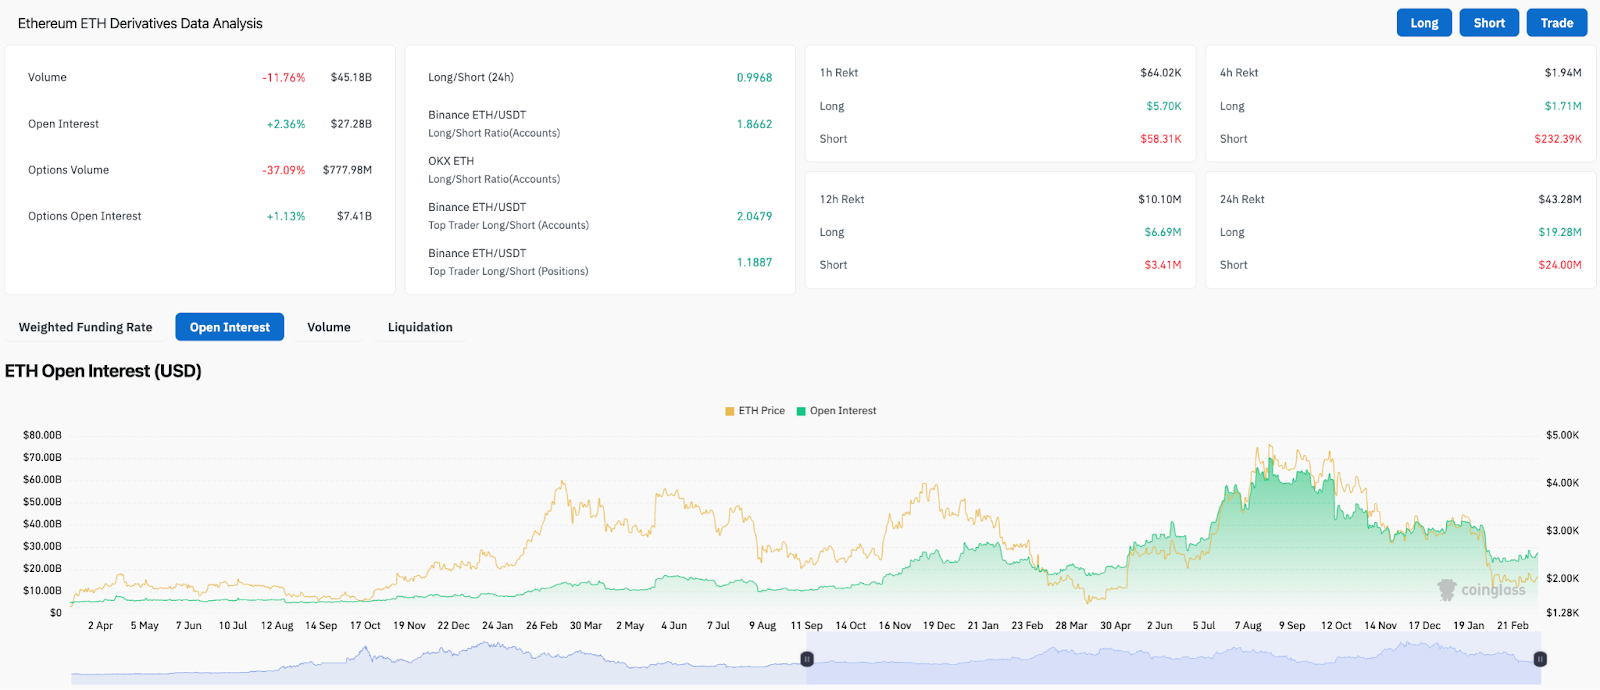
Open interest climbed 2.36% to $27.28B while volume declined 11.76% to $45.18B, a combination that points to fresh positioning being built at current levels rather than elevated trading activity. The Binance long/short ratio sits at 1.8662 for accounts and 2.0479 for top trader accounts, with top trader positions at 1.1887, a setup where retail and institutional accounts are both leaning long but institutional sizing remains conservative.
The liquidation data tells the key story. Over 24 hours, shorts absorbed $24M against $19.28M for longs, confirming that the short side continues to face pressure as price holds above $2,000. Options open interest rose 1.13% to $7.41B while options volume fell 37.09% to $777.98M, reflecting steady hedging demand without the kind of panic options buying that would signal genuine fear in the market.
ETF Inflows Return As All Nine Funds Post Zero Outflows
US Ethereum spot ETFs recorded $57.01M in net inflows on March 11, with all nine ETFs reporting no outflows for the session. BlackRock’s ETHA led with $18.80M, followed by Grayscale’s ETH with $19.08M and Fidelity’s FETH with $19.13M. Cumulative net inflows now stand at $11.65B with total net assets at $11.85B, representing 4.75% of Ethereum’s total market cap.
The back-to-back positive flow days after a streak of heavy outflows in early March, including $90.94M leaving on March 5 and $82.85M on March 6, marks a meaningful shift in institutional sentiment. Two consecutive days where every single ETF avoids outflows is not noise. It suggests the institutional base is stabilizing at current price levels, adding a demand floor beneath the technical structure that the chart alone does not fully reflect.
Outlook: Will Ethereum Go Up?
- Bullish case: ETH holds the ascending trendline and BB midline at $2,029, flips the 1-hour SAR at $2,077 to support, and breaks the upper Bollinger Band at $2,084 on the 4-hour chart. Continued ETF inflows with zero outflows across all nine funds would reinforce the move toward the $2,200 resistance zone.
- Bearish case: Rejection at the SAR and upper BB drops price back below the $2,029 midline and toward the lower BB at $1,973. A break of the ascending trendline near $1,950 to $1,900 would erase the recovery structure and expose the $1,800 to $1,750 range lows from February.
Related: Across Protocol (ACX) Price Prediction 2026–2030: Governance Overhaul And Bridge Adoption Eyes $1
Disclaimer: The information presented in this article is for informational and educational purposes only. The article does not constitute financial advice or advice of any kind. Coin Edition is not responsible for any losses incurred as a result of the utilization of content, products, or services mentioned. Readers are advised to exercise caution before taking any action related to the company.


