
- ETH remains capped below a dense EMA resistance cluster near $3,130–$3,350, keeping the broader structure corrective rather than trend-recovering.
- Persistent spot outflows continue to undermine rebounds, suggesting rallies are being sold into rather than accumulated.
- Short-term price action stays confined within a descending channel, with momentum indicators failing to confirm upside continuation.
Ethereum price today trades near $3,115, slipping modestly after failing to extend its early January rebound. Price remains trapped inside a descending channel on lower timeframes while the daily chart shows ETH struggling beneath key moving averages, keeping sellers in control despite improving long-term institutional signals.
Spot Outflows Keep Pressure On Price
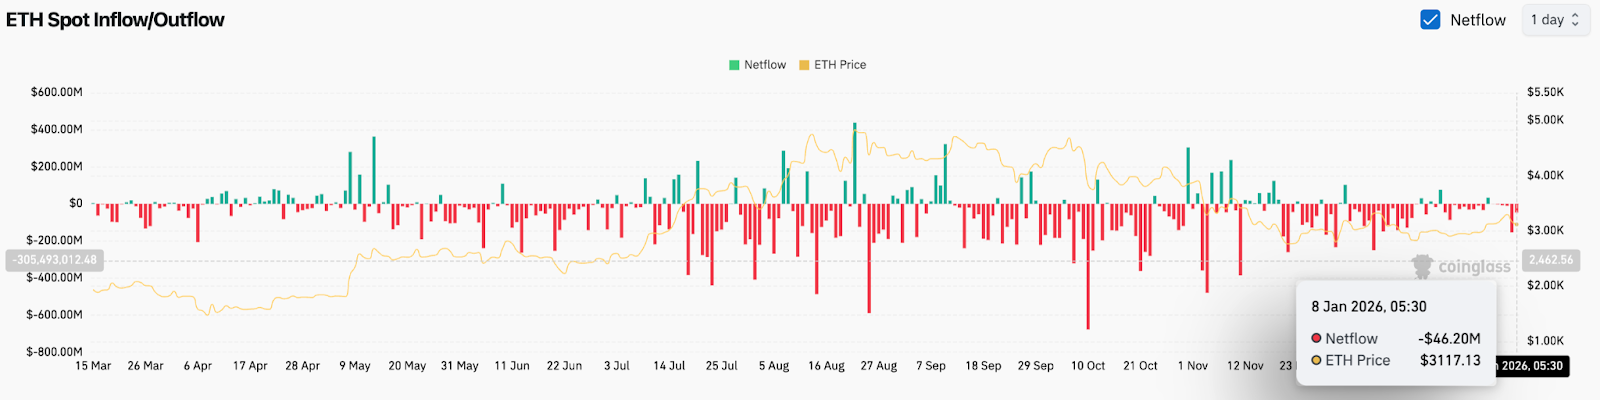
Spot flow data continues to weigh on Ethereum’s recovery. On January 8, ETH recorded a $46.2 million net spot outflow, extending a multi-week pattern of capital leaving exchanges during rallies rather than accumulating on pullbacks.
This behavior matters. ETH has bounced from December lows, but each advance has lacked sustained inflows. When price rises without spot participation, moves tend to stall as sellers use strength to exit positions.
EMA Cluster Acts As Overhead Resistance
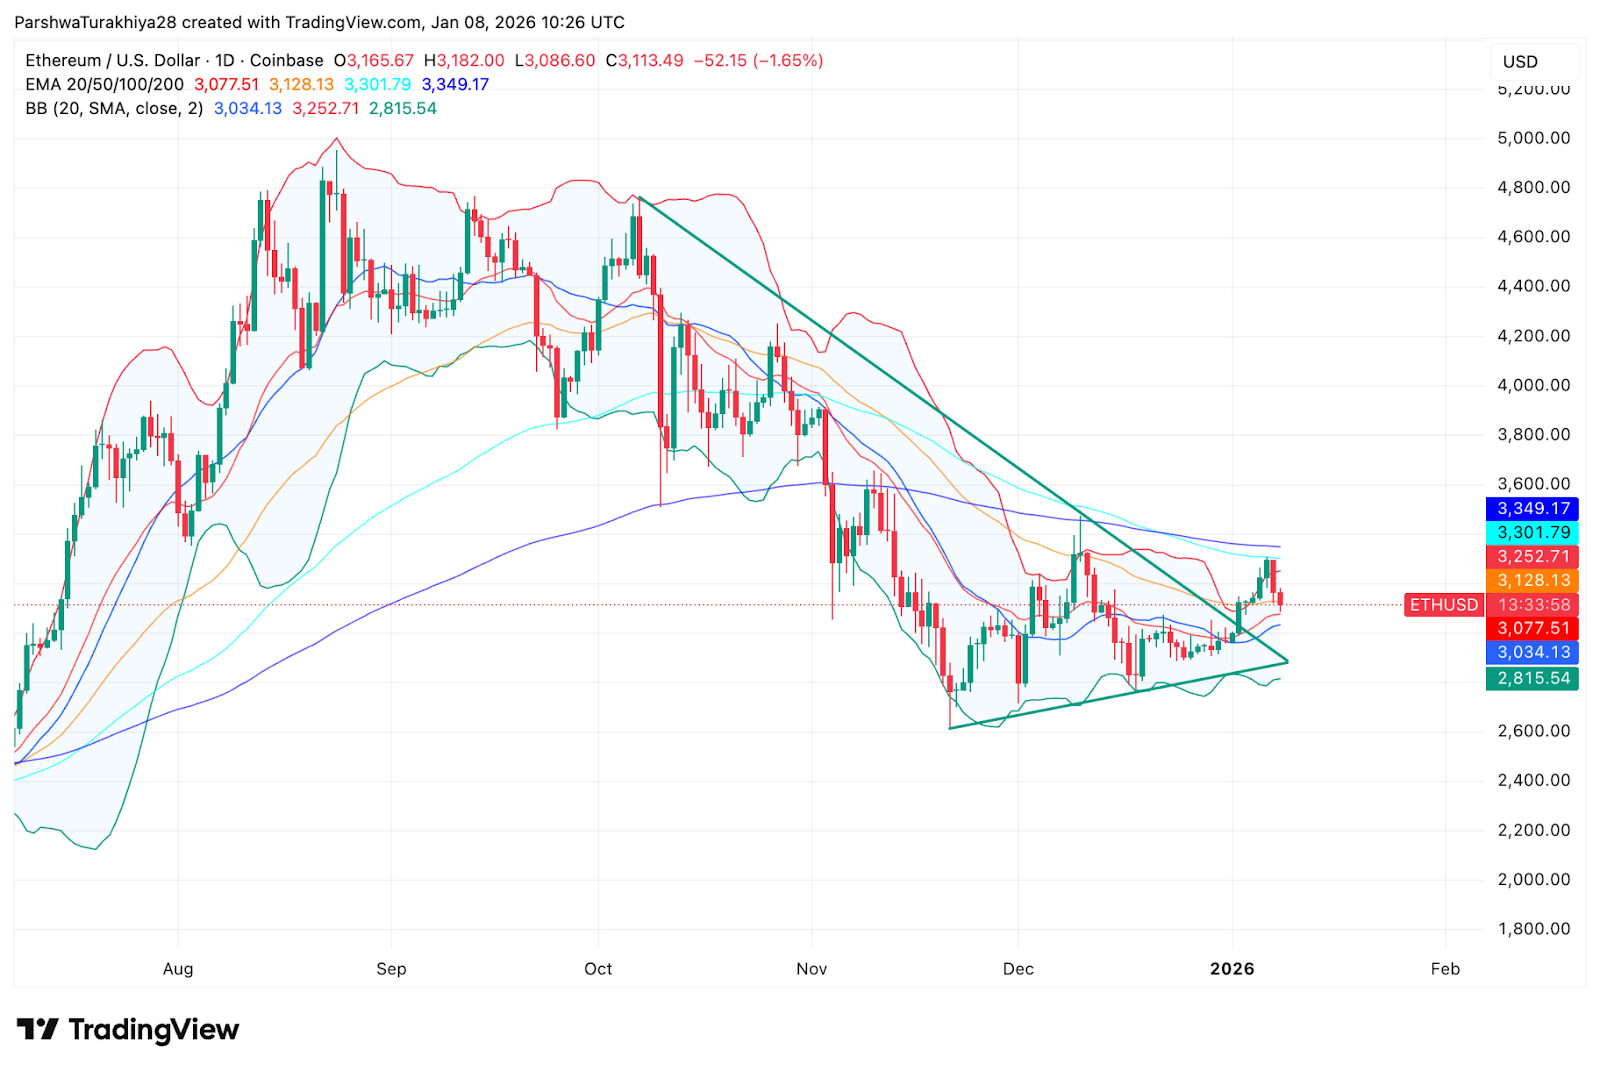
On the daily chart, Ethereum trades below all major moving averages. The 20-day EMA near $3,078 has flattened, while the 50-day EMA around $3,128, the 100-day EMA near $3,302, and the 200-day EMA close to $3,349 form a dense resistance zone above price.
Related: Bitcoin Price Prediction: BTC Maintains Bullish Bias Despite Cooling Momentum
ETH has tested this cluster multiple times since mid-December and failed each time. That repeated rejection confirms the market is still in a corrective phase rather than a trend recovery.
Bollinger Bands reinforce that view. Price remains compressed near the lower half of the band range, signaling consolidation under pressure rather than expansion.
Descending Channel Defines Short-Term Control
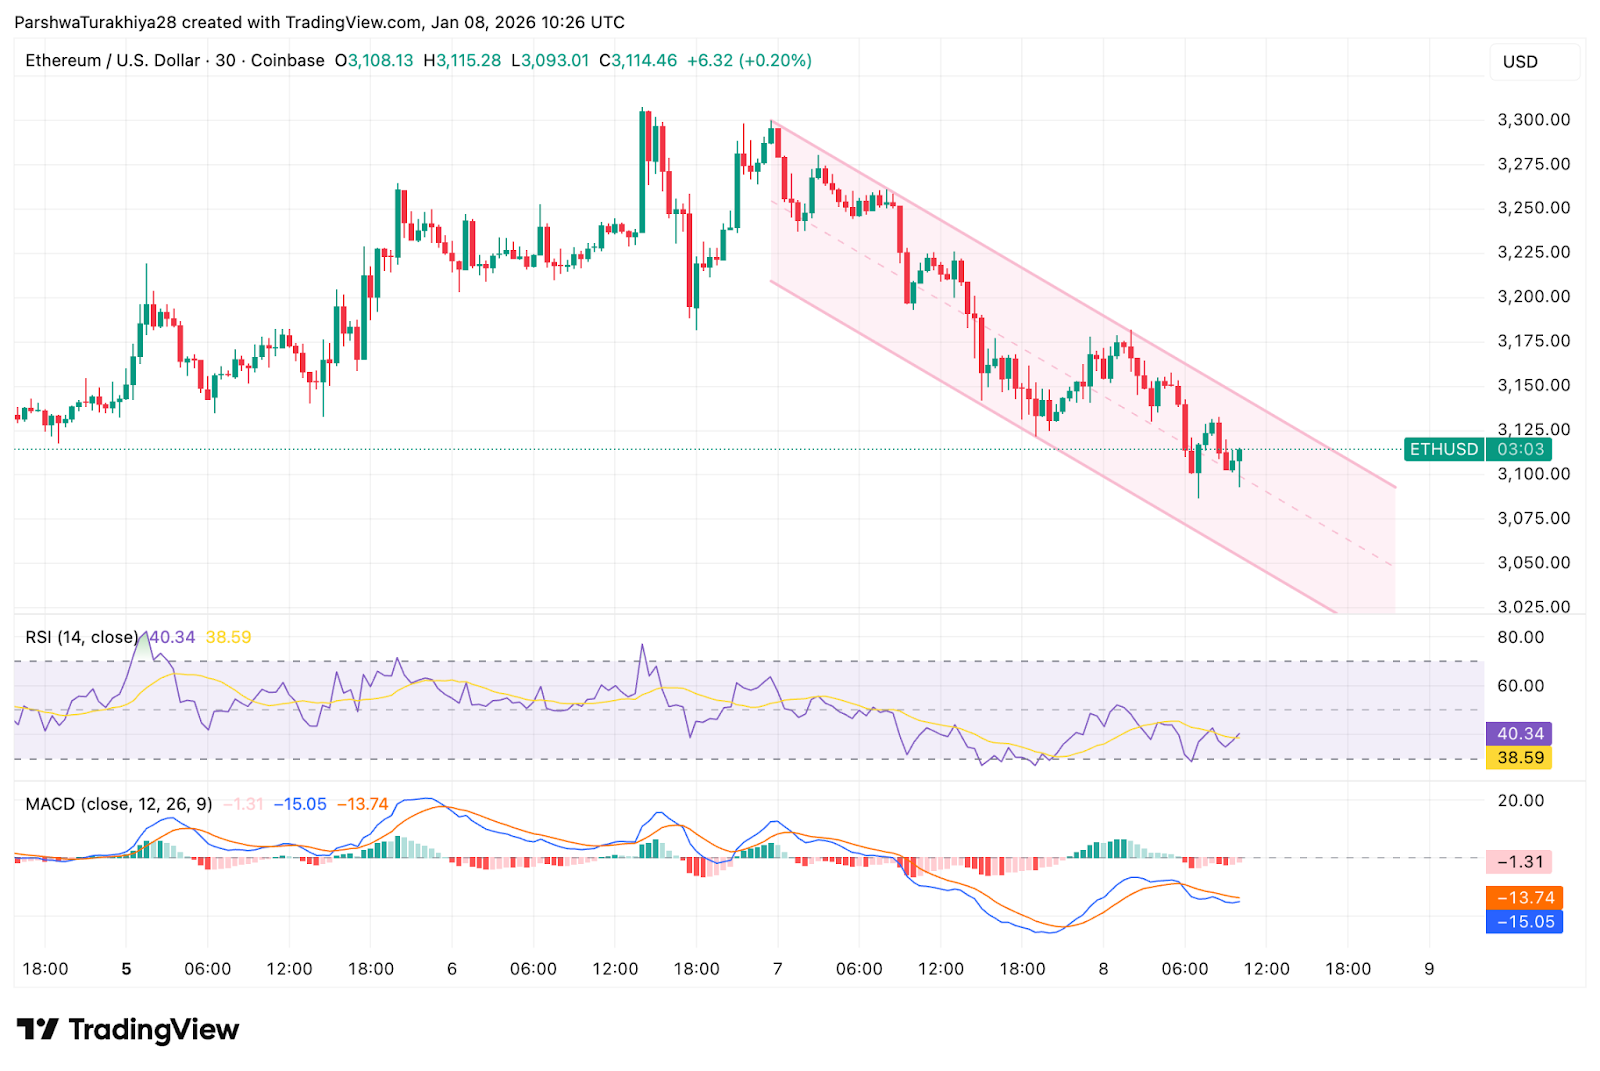
Lower timeframes show sellers maintaining structure. On the 30-minute chart, Ethereum trades inside a clearly defined descending channel, with lower highs and consistent supply near the upper boundary.
Momentum indicators align with that trend. RSI remains below 45, reflecting weak buying pressure, while MACD stays negative despite a mild histogram recovery. Each bounce has lacked follow-through once ETH approaches channel resistance.
Institutional Signals Build Beneath Price
On January 7, Morgan Stanley filed for SEC approval of an Ethereum Trust, following closely behind its Bitcoin and Solana filings. The move signals growing institutional comfort with ETH as a yield-bearing asset, particularly through staking.
Related: Cardano Price Prediction: Support At $0.39 Faces Breakdown Risk As Sellers Retain Control
At the same time, Bitmine is seeking shareholder approval to dramatically expand its share count to fund Ethereum acquisitions. The firm already holds 4.14 million ETH, worth roughly $13.3 billion, and plans to launch its MAVAN validator network in 2026, targeting $374 million in annual staking revenue.
These developments strengthen Ethereum’s long-term demand narrative, but they have not yet translated into immediate spot buying.
Network Upgrades Add Efficiency, Raise Debate
Ethereum’s Fusaka upgrade, which went live in December, introduced PeerDAS to improve Layer-2 data handling. Early results show transaction fees on major rollups dropping sharply, easing network congestion and improving user economics.
However, debate around Ethereum’s scaling roadmap persists. Critics argue that the rising hardware costs required for advanced ZK-EVM implementations could introduce centralization risks over time.
That debate has not impacted price directly, but it remains part of the broader narrative investors are weighing.
Outlook. Will Ethereum Go Up?
Ethereum is caught between improving fundamentals and weak short-term structure.
- Bullish case: A decisive close above $3,350, supported by rising volume and improving spot flows, would signal trend recovery and reopen upside toward $3,600.
- Bearish case: Failure to hold $3,000 would keep ETH inside the descending structure and expose the $2,800 region.
Until price breaks above its EMA cluster and spot flows turn positive, Ethereum remains in consolidation. Institutional interest is building, but the chart still demands patience.
Related: Dogecoin Price Prediction: DOGE Holds Ground as Market Enters a Critical Consolidation Phase
Disclaimer: The information presented in this article is for informational and educational purposes only. The article does not constitute financial advice or advice of any kind. Coin Edition is not responsible for any losses incurred as a result of the utilization of content, products, or services mentioned. Readers are advised to exercise caution before taking any action related to the company.
 Price Prediction: Weak Momentum Signals Possible Drop to $62K")

 Price Prediction for April 2026: Will Chainlink Move Higher?")
 Price Prediction: Can Bulls Sustain the $0.045 Push?")
