
- Ethereum ETFs saw $246M inflows on Oct 28, with BlackRock adding $76.4M.
- ETH trades at $4,013 inside triangle, with resistance at $4,400–$4,550.
- Analysts project $8K–$10K if breakout validates in current cycle.
Ethereum price today trades near $4,013, holding above a critical cluster of exponential moving averages (EMAs) that continue to define the near-term trading range. After briefly testing $3,964 earlier in the session, ETH regained the $4,000 handle, signaling that buyers are defending the ascending trendline that has guided the asset’s recovery since April.
ETF inflows revive sentiment across Ethereum markets
Data from recent ETF flow trackers show renewed institutional appetite for Ethereum. On October 28, spot ETH exchange-traded funds (ETFs) recorded $246 million in total inflows, with BlackRock contributing $76.4 million of net buying. The move marked one of the strongest single-day inflows in October, offsetting the prior week’s muted figures. These inflows indicate growing investor confidence in Ethereum’s mid-cycle setup, particularly as the broader crypto market stabilizes following recent volatility in Bitcoin.
Such ETF accumulation has often preceded short-term momentum expansions. The steady inflows from large asset managers like BlackRock provide a foundation for liquidity support, reducing downside pressure as traders anticipate the next breakout attempt above $4,400.
Derivatives data confirm bullish positioning
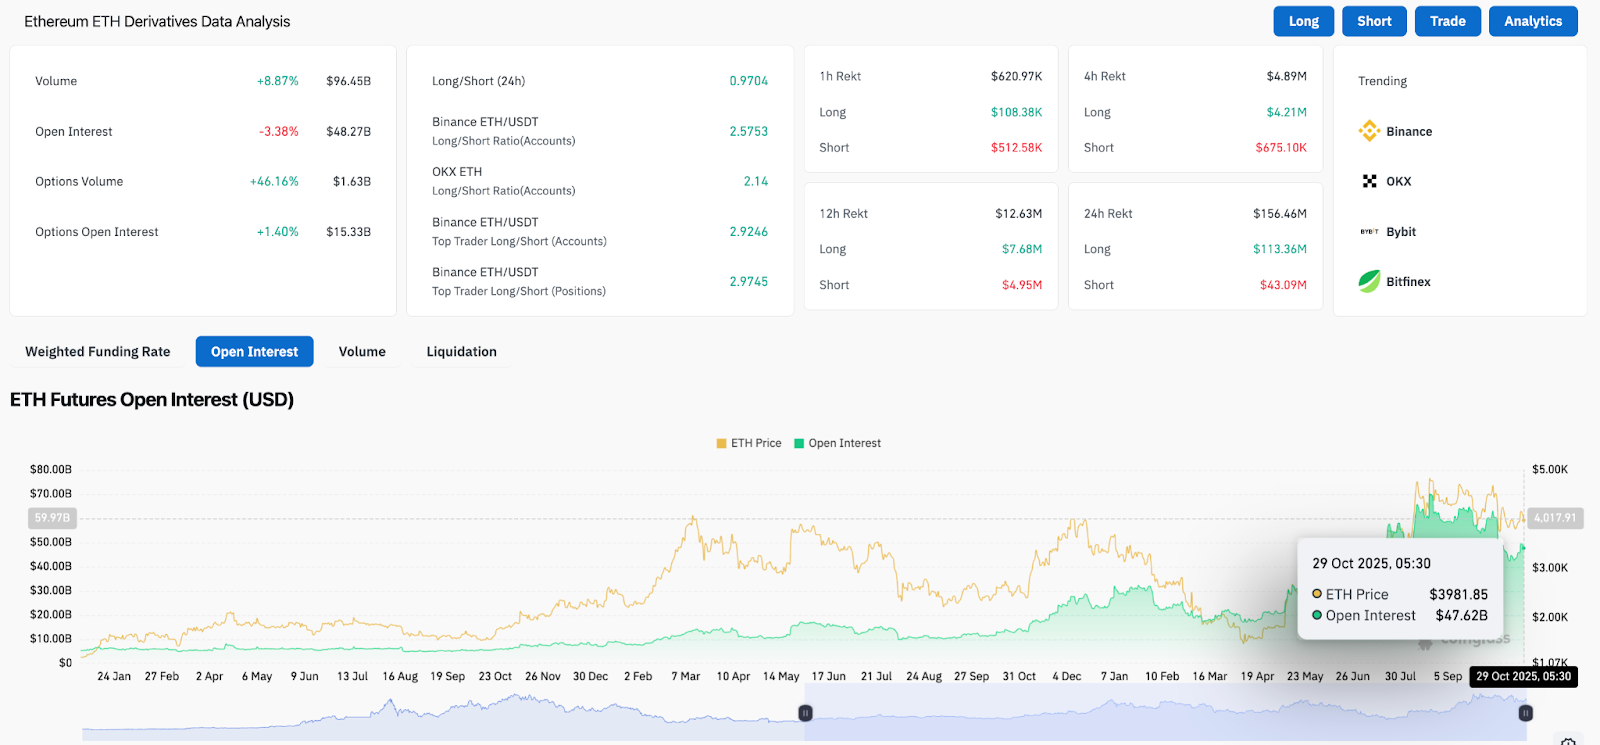
Ethereum’s derivatives metrics show a modest improvement in speculative positioning. Total futures open interest sits near $48.27 billion, down 3.38% from the prior session, while options volume surged more than 46% to $1.63 billion, indicating renewed hedging and directional positioning.
Related: XRP Price Prediction: Bulls Eye Recovery as Futures Interest Surges
The long/short ratio on Binance stands around 2.57, suggesting that long exposure continues to dominate retail and professional accounts. Top traders’ positions are even more skewed, with a 2.97 long-to-short ratio, implying conviction that the current consolidation may resolve higher. Despite a slight decline in open interest, this concentration of leveraged longs underscores that market participants expect continuation toward the $4,400–$4,550 resistance region.
Price structure tightens near symmetrical triangle apex
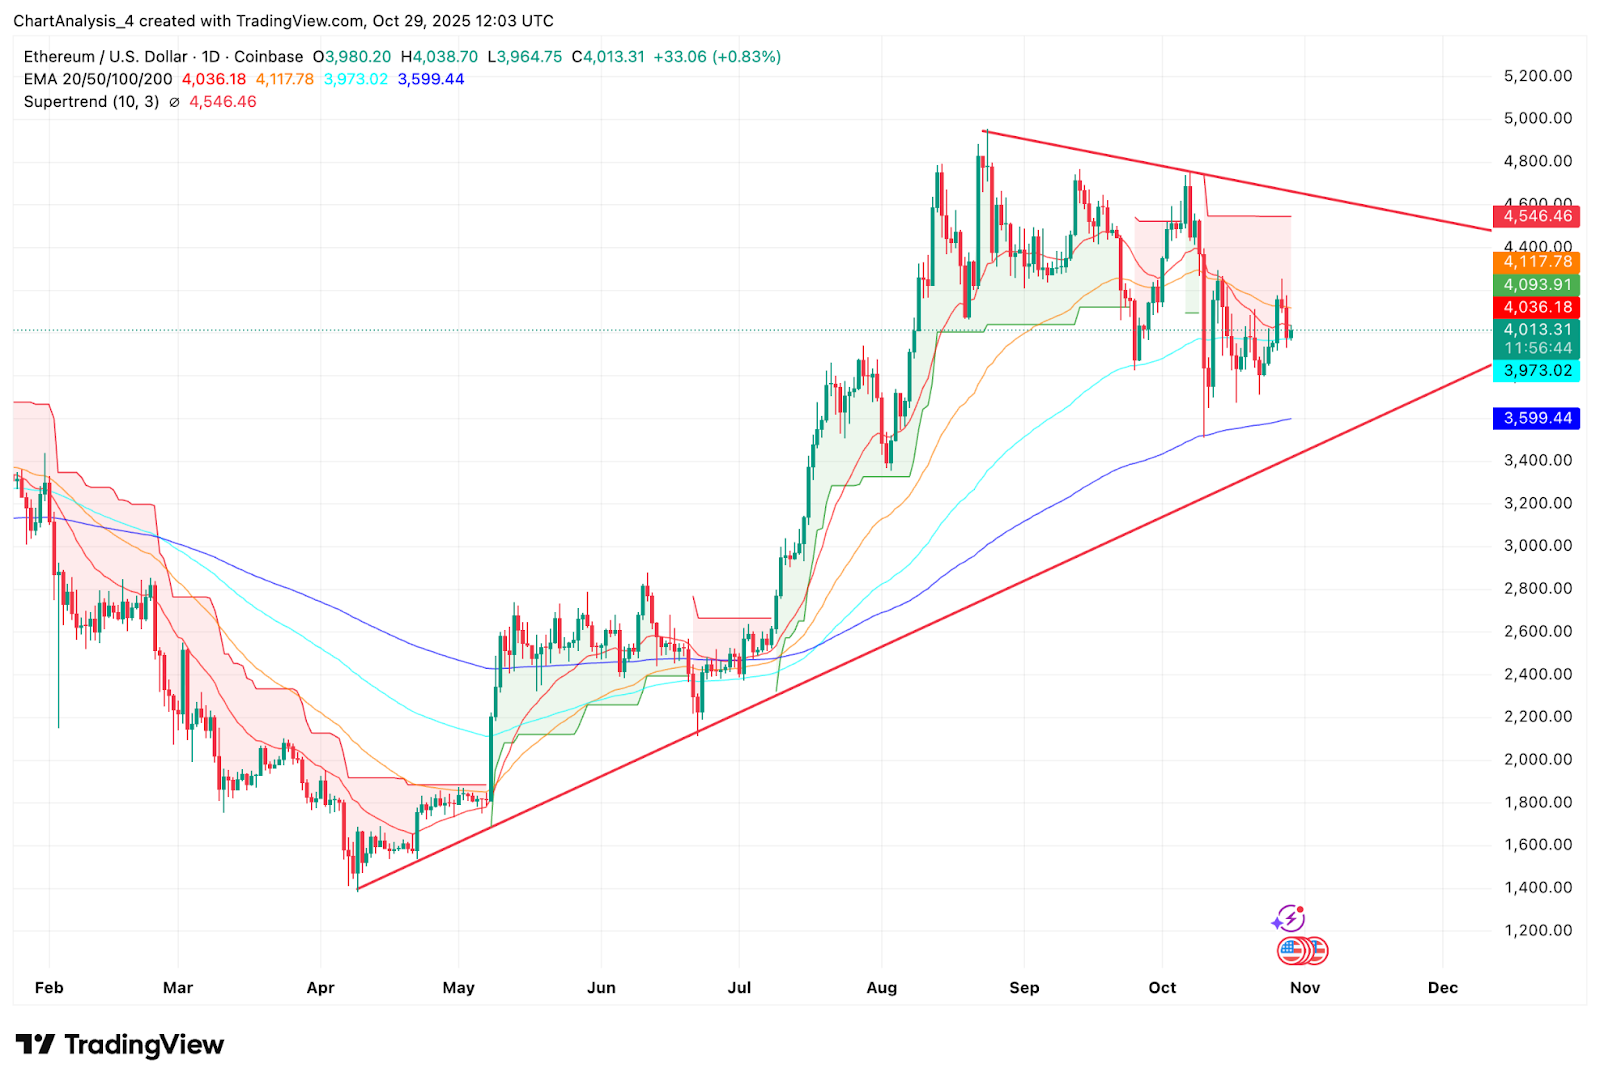
On the daily chart, Ethereum price action continues to compress within a well-defined symmetrical triangle. The upper resistance zone aligns near $4,400–$4,550, while ascending support traces from the $3,600 region. The 20-day EMA at $4,036 and 50-day EMA near $4,118 now serve as intraday pivots, with the 100-day EMA at $3,973 providing structural support.
This setup suggests that ETH remains in the later stages of consolidation before a directional breakout. The Supertrend indicator, currently near $4,546, reinforces that bulls must reclaim this level to confirm a trend reversal toward higher highs. Until that breakout materializes, traders are likely to observe continued coiling behavior between the converging trendlines.
Related: Solana Price Prediction: SEC ETF Approval Sets Stage For $225 Breakout
Analysts expect $8,000–$10,000 targets if breakout holds
Market analyst Ted Pillows noted that Ethereum has been in a four-year consolidation phase, historically followed by exponential expansions. His chart analysis implies that if the triangle breakout validates, ETH could target $8,000–$10,000 within the ongoing market cycle.
This projection aligns with Ethereum’s structural rhythm seen in prior bull phases, where prolonged base formations have preceded multi-fold rallies. While such targets remain speculative, they provide context for institutional positioning and long-horizon accumulation trends visible in ETF data and on-chain flows.
Outlook: Will Ethereum go up?
For now, Ethereum price prediction remains cautiously bullish. A daily close above $4,400 would confirm the breakout from the triangle and invite follow-through toward $4,800 and $5,050. Sustained ETF inflows, especially from BlackRock and Fidelity, would further validate institutional confidence and reinforce upside momentum.
On the downside, failure to hold $3,970 could open a retest of the $3,600 support trendline, where the 200-day EMA at $3,599 converges. A breakdown below that zone would shift short-term sentiment to bearish, exposing ETH to potential declines toward $3,300–$3,200.
Related: Bitcoin Price Prediction: BTC Price Consolidates as Open Interest Hits $73B
Disclaimer: The information presented in this article is for informational and educational purposes only. The article does not constitute financial advice or advice of any kind. Coin Edition is not responsible for any losses incurred as a result of the utilization of content, products, or services mentioned. Readers are advised to exercise caution before taking any action related to the company.


