
- Ethereum falls below the 200-day EMA after $355 million in liquidations and heavy ETF redemptions led by BlackRock.
- $240 million in spot outflows confirm sellers are exiting both ETF and exchange positions, shifting momentum bearish.
- Recovery requires reclaiming $3,607, with downside support at $3,350–$3,000 if flows and volume do not improve.
Ethereum price today trades near $3,485, sliding over 3 percent in the past 24 hours after breaking below the rising trendline that has guided the 2025 rally. The drop follows a surge in ETF redemptions and spot outflows, putting pressure on sentiment and forcing leveraged positions to unwind.
ETF Outflows Spark Risk Reduction
The selling pressure began with aggressive institutional withdrawals. Fresh ETF data shows $135.7 million in outflows yesterday, including $81.7 million sold by BlackRock. These redemptions mark one of the largest exit days since launch, signaling that funds are reducing exposure rather than rotating elsewhere.
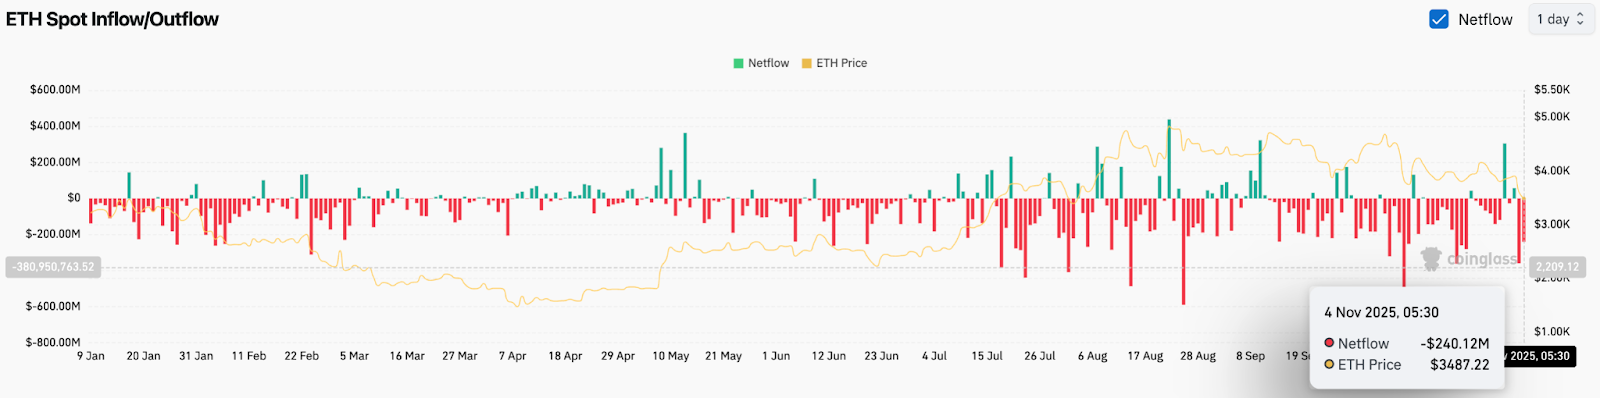
Spot exchange flows confirm that trend. Coinglass recorded $240 million in net outflows on November 4. When both spot and ETF flows move lower at the same time, price usually follows, which explains the sudden shift in the Ethereum price action over the past two sessions.
Futures Market Shows Capitulation
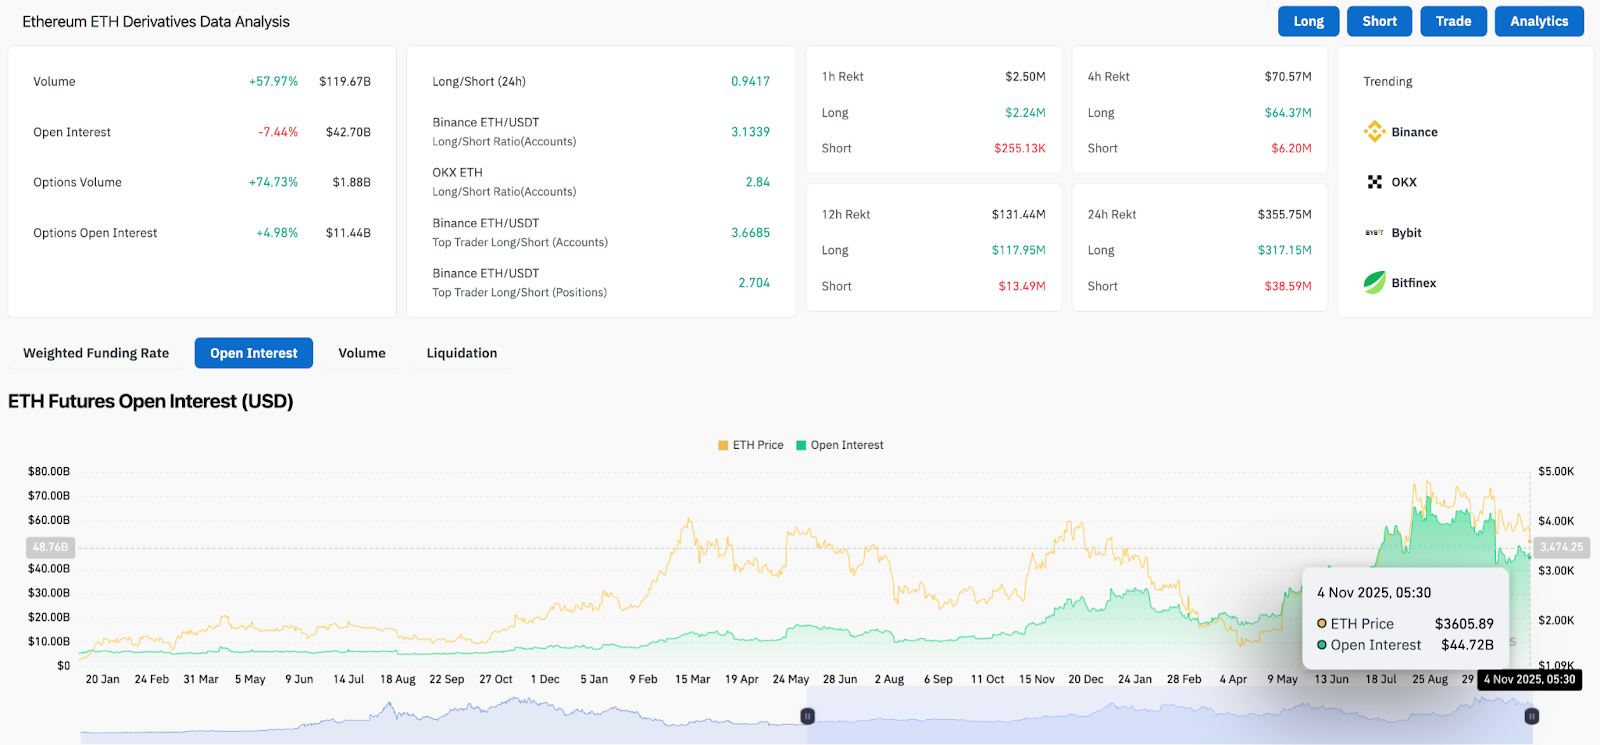
On derivatives, open interest dropped 7.44 percent, signaling that leveraged positions are being closed. Nearly $355 million in liquidations hit the market over the past 24 hours. That flush cleared over-leveraged long positions, which previously supported the narrow trading range above the 200 day EMA.
Top trader positioning still shows long bias, meaning leverage was skewed bullish into the breakdown. When price breaks key support with leverage stacked on one side, the follow-through is usually stronger. The Ethereum price volatility this week reflects that imbalance.
Breakdown Below 200 Day EMA Turns Structure Bearish
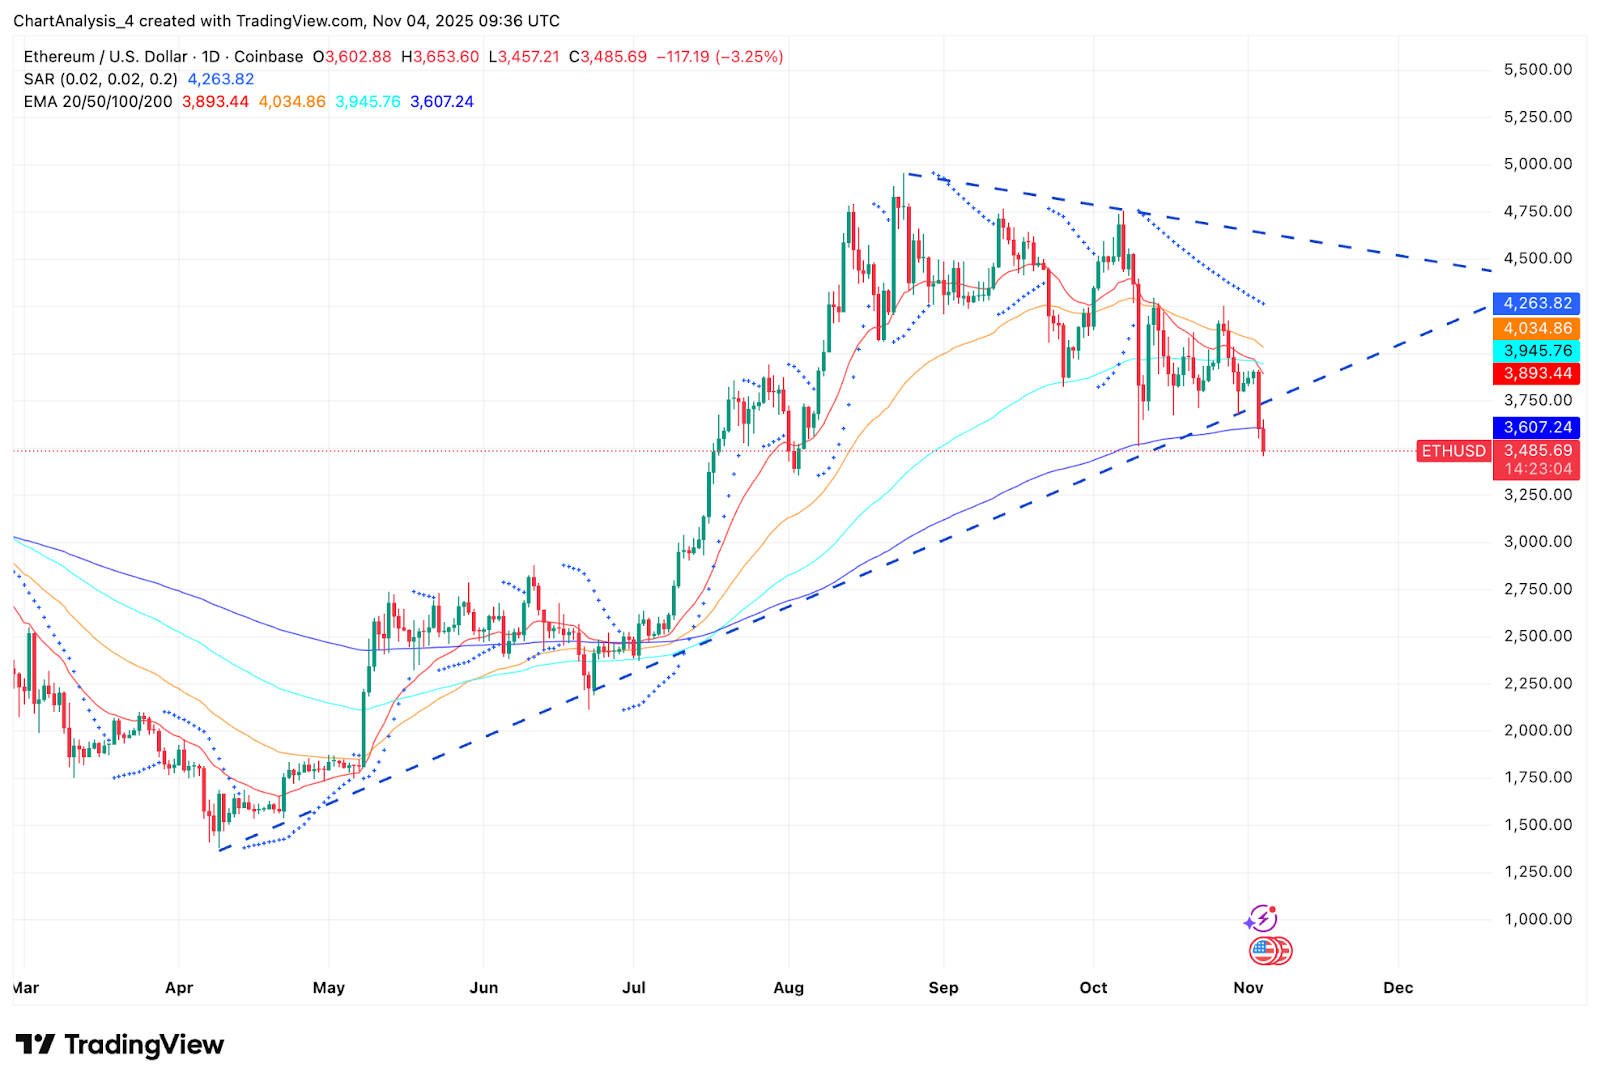
Ethereum price today sits below the 200 day EMA at $3,607, breaking trendline support for the first time since April. Sellers defended the EMA cluster at $3,893 to $4,034, where the 20 and 50 EMAs converge. That cluster has now turned into resistance.
On the daily chart, the structure has shifted from higher lows to a wedge breakdown. Repeated failures near the $4,030 range and the loss of the 200 day EMA show exhaustion from buyers.
Key levels now:
- Immediate resistance: $3,607
- Major resistance zone: $3,893 to $4,034
- Support to defend: $3,350 to $3,250
- Main demand zone: $3,000
The RSI remains neutral, but price action tells the real story. The market is no longer forming higher lows. Until Ethereum reclaims lost levels, sellers maintain control.
Outlook. Will Ethereum Recover in November
The trend has shifted short term, but it has not yet turned into a full macro reversal. Ethereum will need to reclaim the 200 day EMA and show improving flows to shift momentum back toward the upside.
Staying below $3,607 keeps the corrective phase active, and traders will continue to treat bounces as reactionary rather than trend forming. A recovery remains possible, but it requires clear confirmation, not just temporary relief.
Disclaimer: The information presented in this article is for informational and educational purposes only. The article does not constitute financial advice or advice of any kind. Coin Edition is not responsible for any losses incurred as a result of the utilization of content, products, or services mentioned. Readers are advised to exercise caution before taking any action related to the company.
 Price Prediction: Weak Momentum Signals Possible Drop to $62K")

 Price Prediction for April 2026: Will Chainlink Move Higher?")
 Price Prediction: Can Bulls Sustain the $0.045 Push?")
