
- ETH consolidates near $3,884 below key EMAs, signaling cautious trader sentiment.
- Futures open interest surged above $43B, hinting at potential sharp price swings.
- Ethereum Foundation moves 160K ETH, reflecting security upgrades and treasury planning.
Ethereum (ETH) continues to trade near $3,884, showing limited momentum after repeated failures to stay above the $3,900 resistance zone. The price action reflects consolidation within a tight range, as traders await a clear breakout signal. Moreover, technical indicators reveal a cautious sentiment, with ETH trading below its major exponential moving averages (EMAs).
Consolidation Phase Amid Technical Barriers
The 4-hour chart shows ETH struggling beneath key EMAs 20, 50, 100, and 200 clustered between $3,890 and $4,134. This alignment highlights persistent bearish pressure. Immediate resistance sits at $3,944, followed by $4,033 and $4,134. A clean breakout above the $4,254 Fibonacci level could restore bullish momentum. In that case, potential upside targets include $4,476 and $4,758.
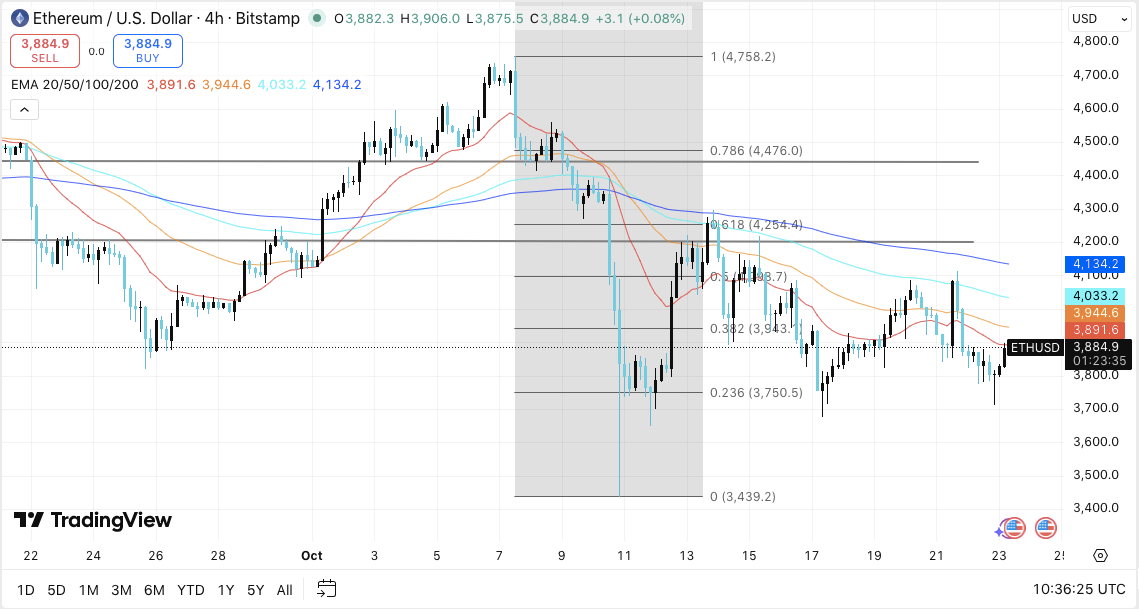
On the downside, Ethereum faces crucial support near $3,750, aligned with the 0.236 Fibonacci retracement. Further weakness could expose $3,443, marking the 0.382 retracement zone, where previous buying reactions emerged. A sustained drop below $3,750 may signal an extended corrective phase toward the $3,440 region.
Related: Dogecoin Price Prediction: Traders Eye Breakout as Momentum Builds
Open Interest Signals Active Market Participation
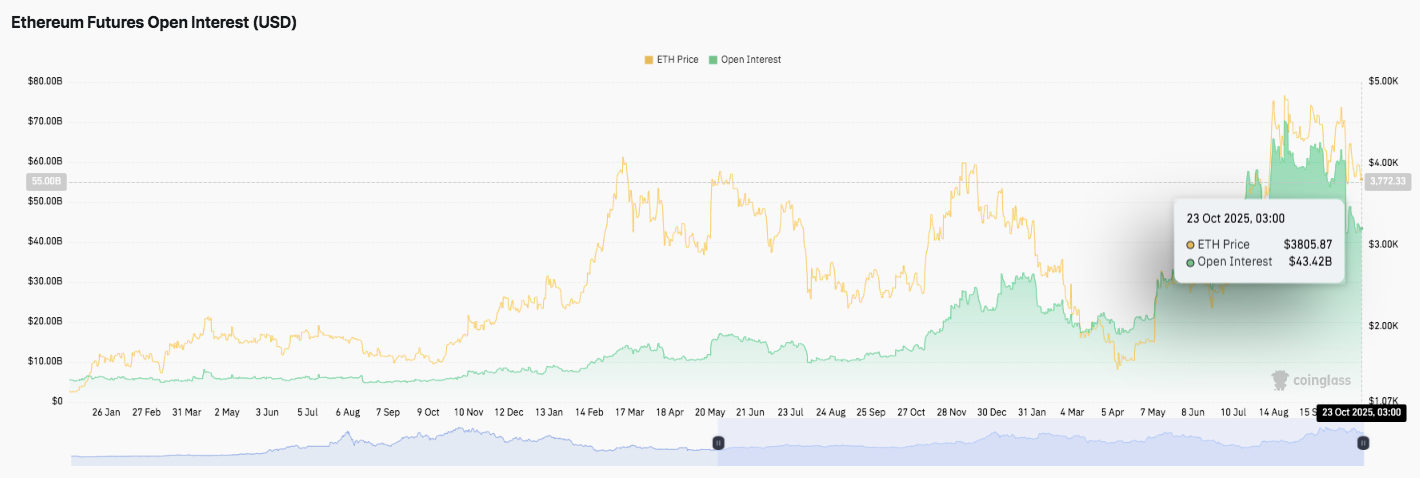
Ethereum’s futures market reflects growing speculative interest. Open interest climbed from under $10 billion in February to more than $43 billion by October 23, 2025.
This steady rise suggests high leverage participation and consistent engagement from both institutional and retail traders. As of the latest data, ETH trades near $3,805 while open interest remains elevated, pointing to potential volatility.
Besides, strong open interest combined with sideways price movement often precedes sharp directional swings. If ETH gains traction above $4,100, traders could see rapid short covering. However, failure to reclaim this zone might trigger long liquidations, intensifying short-term volatility.
Exchange Flows and Foundation Wallet Movement
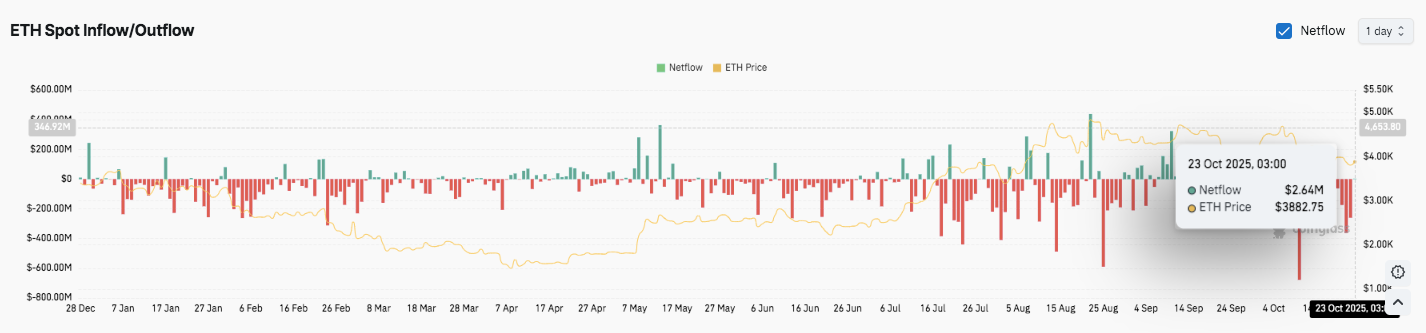
Ethereum’s on-chain data shows declining outflows since July, suggesting reduced selling pressure. October’s modest inflow of $2.64 million indicates cooling bearish momentum as investors monitor liquidity conditions. Historically, extended outflow periods have aligned with accumulation and price recoveries, while inflows signal possible corrections.
Significantly, the Ethereum Foundation recently transferred about 160,000 ETH, worth roughly $610 million, into a new multi-signature Safe Wallet. The move, described as a scheduled treasury migration, underscores ongoing security enhancements within the ecosystem.
Related: Bitcoin Price Prediction: BlackRock Adds $73M To Holdings
Technical Outlook for Ethereum (ETH) Price
Key levels remain clearly defined heading into late October, as Ethereum consolidates within a narrowing range.
- Upside levels: $3,944 (50 EMA), $4,033 (100 EMA), and $4,134 (200 EMA) form immediate resistance barriers. A decisive breakout above the $4,254 Fibonacci level could open the path toward $4,476 and $4,758 in the short term.
- Downside levels: $3,750 acts as the first support aligned with the 0.236 Fib retracement, followed by $3,443 at the 0.382 level, marking the key demand zone.
The technical setup suggests ETH is compressing within a symmetrical consolidation phase after retracing from the $4,758 swing high. Price remains capped below clustered EMAs, signaling that bulls must reclaim the $4,100–$4,200 zone to reverse the current lower-high structure. A sustained close above this region would confirm renewed bullish control.
Will Ethereum Resume Its Uptrend?
Ethereum’s next directional move depends on how long buyers can defend the $3,750–$3,440 support corridor. A clean breakout above $4,254 would likely trigger volatility expansion and attract fresh leverage interest, targeting $4,758 and beyond. However, failure to maintain support could lead to a deeper correction before any recovery attempt.
Historically, Ethereum has shown strong rebounds after prolonged consolidations near key Fibonacci levels. With open interest and trading volumes remaining high, volatility is expected to increase into November. For now, ETH sits in a pivotal zone, where reclaiming $4,100 will decide whether the next leg favors bulls or extends the correction phase.
Related: Chainlink Price Prediction: LINK Eyes Recovery as Accumulation Trends Strengthen
Disclaimer: The information presented in this article is for informational and educational purposes only. The article does not constitute financial advice or advice of any kind. Coin Edition is not responsible for any losses incurred as a result of the utilization of content, products, or services mentioned. Readers are advised to exercise caution before taking any action related to the company.
 Price Prediction: ZBCN Jumps 21% After Breakout as Bulls Eye $0.003")
 Price Prediction: Can QNT Break $80 After Extended Rally?")
 Price Prediction: FET Climbs 26%—Is a Break Above $0.23 Sustainable?")

