
- Ethereum holds near $2,000 as buyers defend support while sellers cap rallies.
- Tight Bollinger Bands signal volatility surge as ETH compresses in a range.
- Derivatives growth and exchange outflows highlight cautious institutional positioning.
Ethereum continues to trade in a fragile consolidation phase after months of heavy selling pressure. The cryptocurrency lost significant ground after falling from roughly $3,400 to about $1,745 during a steep correction. Since that sharp decline, price activity has slowed and shifted into a narrow trading range.
Market participants now watch key support and resistance zones closely as Ethereum attempts to stabilize near the $2,000 level. This consolidation reflects a balance between cautious buyers and persistent sellers. However, several technical signals suggest that a decisive move could soon emerge.
Ethereum Trades in a Tight Range
Ethereum currently moves between roughly $1,850 and $2,150, forming a clear short-term trading corridor. This range developed after the dramatic drop that erased earlier bullish momentum. Traders now treat $2,000 as a critical psychological support level. Buyers continue defending this zone despite repeated tests in recent sessions.
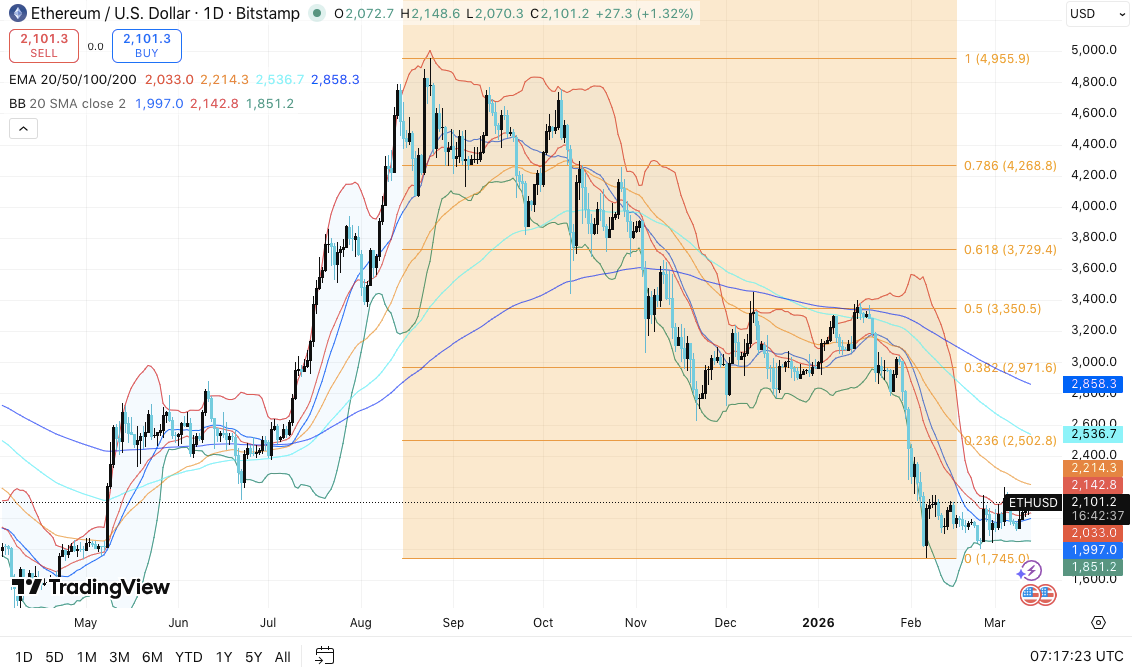
However, the broader trend still favors bears. Ethereum remains below major exponential moving averages, including the 100-day and 200-day indicators.
Consequently, the market has not confirmed a meaningful long-term recovery. Short-term indicators show some stabilization, yet they do not signal a complete reversal.
Related: Pi Network Price Prediction: PI Jumps Toward $0.3 Ahead Of PiDEX Launch
Immediate resistance stands near $2,150, where previous rallies stalled. A breakout above this level could shift sentiment and trigger renewed buying activity. Besides that, technical retracement zones around $2,350 may present another barrier for upward momentum.
Technical Indicators Point to Potential Volatility
Several indicators suggest the market may soon experience stronger price movement. Bollinger Bands have tightened noticeably, indicating a volatility squeeze across the current range. Traders often interpret this pattern as a precursor to a sharp directional move.
Additionally, Ethereum trades near its 20-day exponential moving average around $2,033. This level reflects short-term equilibrium between buyers and sellers. However, higher averages remain far above current price levels. The 50-day average sits near $2,214, while the 100-day and 200-day averages stand near $2,536 and $2,858.
Consequently, Ethereum must reclaim the $2,500 to $2,900 region before a broader trend reversal becomes credible. Until that happens, the larger market structure remains bearish.
Derivatives Activity and Capital Flows
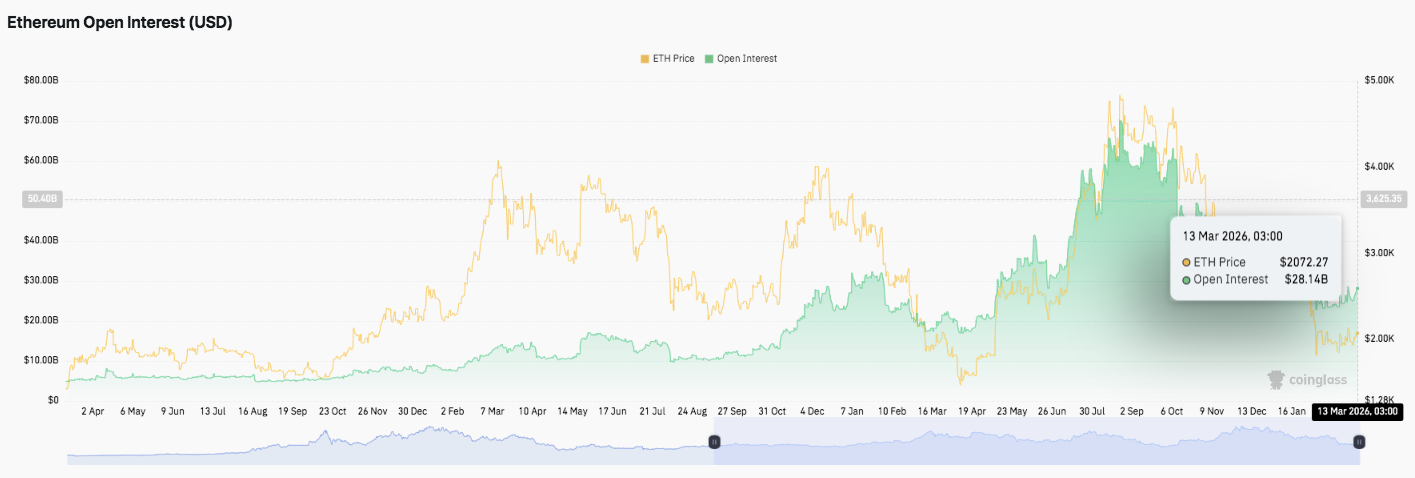
Market participation in derivatives markets has expanded steadily despite recent volatility. Ethereum open interest has climbed dramatically over time, surpassing $50 billion during recent price peaks. This growth reflects rising institutional and speculative activity.
Related: Solana Price Prediction: SOL Targets $94 Supertrend After Mastercard Partnership
However, periodic pullbacks in open interest followed price corrections. These declines likely reflect liquidations or risk reduction after leveraged positions unwind.
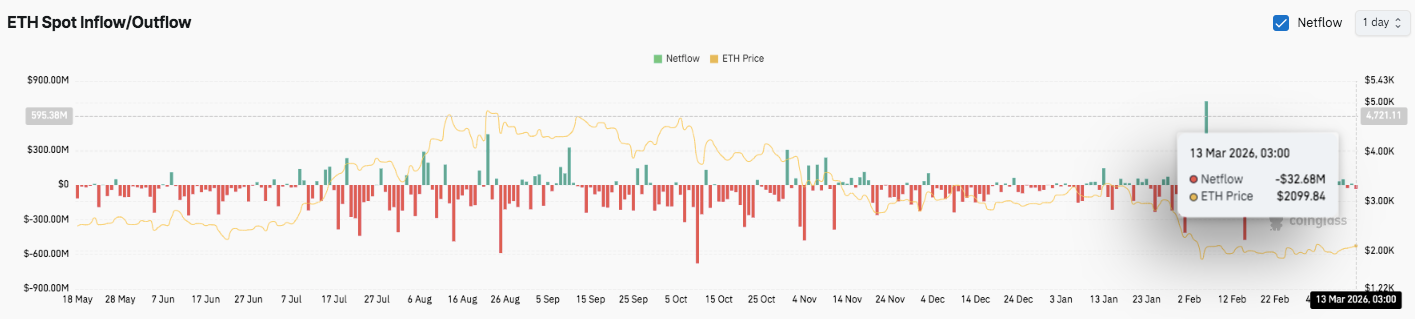
Spot market flows reveal another important trend. Exchanges have recorded extended periods of capital leaving Ethereum markets. Outflows dominate the overall pattern, which signals distribution and cautious investor sentiment.
Short bursts of inflows appear during brief rallies. However, those inflows rarely sustain momentum for long. Consequently, the balance between accumulation and selling remains unstable.
Technical Outlook for Ethereum Price
Key Ethereum levels remain clearly defined as the market consolidates around the $2,000 zone. Price currently moves within a tight range after the earlier correction from the $3,400 area. This consolidation suggests that traders are preparing for a potential volatility expansion.
Upside levels: $2,150 remains the immediate breakout level that buyers must clear. A successful push above this resistance could open the path toward $2,350 and $2,600. If bullish momentum strengthens further, Ethereum may attempt a move toward $2,970 and the $3,350 region.
Downside levels: $2,000 acts as the primary psychological support. A breakdown below this level could trigger selling pressure toward $1,850. If that zone fails to hold, the next downside targets appear near $1,745 and the $1,650 macro support area.
Resistance ceiling: The $2,850 region, which aligns closely with the 200-day EMA, remains the critical level to flip for a medium-term trend reversal. Reclaiming this level would signal a structural shift in momentum and restore bullish sentiment across the broader market.
The current technical structure suggests Ethereum is compressing within a consolidation range after a strong downtrend. Additionally, Bollinger Bands continue to tighten, which often signals an incoming volatility expansion. A decisive move outside the $1,850–$2,150 range will likely determine the next major trend.
Will Ethereum Move Higher?
Ethereum’s near-term outlook depends largely on whether buyers can defend the $2,000 support long enough to challenge the $2,150–$2,350 resistance cluster. Sustained buying pressure and stronger market participation could drive a recovery toward $2,600 and potentially $2,970.
However, failure to hold the $2,000 support may weaken market confidence. In that case, Ethereum could revisit $1,850 and possibly retest the cycle low near $1,745.
For now, Ethereum remains in a pivotal consolidation phase. Market sentiment shows signs of stabilization, yet confirmation from price action will determine the next directional move.
Disclaimer: The information presented in this article is for informational and educational purposes only. The article does not constitute financial advice or advice of any kind. Coin Edition is not responsible for any losses incurred as a result of the utilization of content, products, or services mentioned. Readers are advised to exercise caution before taking any action related to the company.


 Price Prediction: Bulls Drive Rally Toward $1 After 967% Surge")

