
- ETH remains under pressure as lower highs and lows confirm sustained bearish control.
- Key support lies at $1,960–$1,900, with $1,740 critical for further downside risk.
- Derivatives show deleveraging and mixed spot flows, signaling trader caution and indecision.
Ethereum continues to trade under heavy pressure as the daily chart reflects a clear bearish trend. Market structure shows consistent lower highs and lower lows, which signals sustained seller dominance. Besides weaker price action, technical indicators and derivatives data also point to reduced confidence among traders.
Technical Structure Signals Ongoing Downside Risk
Price action shows a strong rejection near the 0.5 Fibonacci area around $3,347, which reinforced a macro resistance zone. However, sellers quickly regained control and drove ETH below the $2,512 region, accelerating bearish momentum. The breakdown confirmed trend continuation and pushed price toward the lower range.
Additionally, the Ichimoku cloud remains overhead, highlighting persistent resistance and limiting bullish attempts. Current support sits between $1,960 and $1,900, where buyers have shown early reactions.
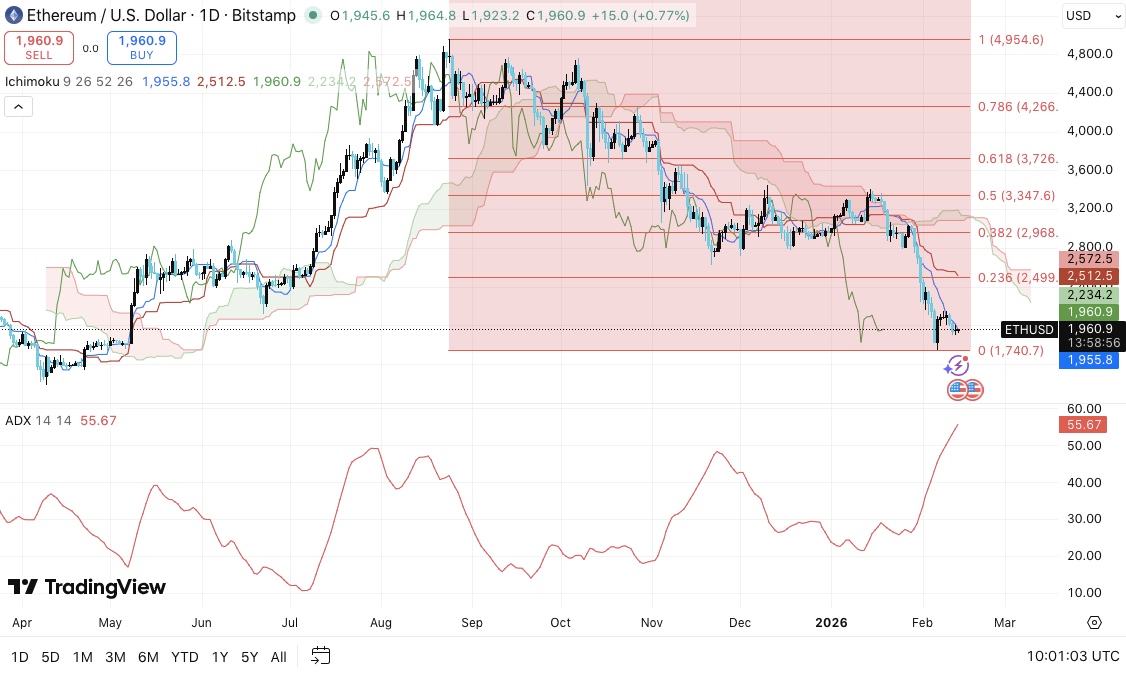
However, analysts highlight $1,740 as the critical structural floor. Consequently, a break below that level could open a path toward the $1,600 to $1,500 demand zone.
On the upside, resistance appears layered and difficult to reclaim. The $2,234 to $2,512 range forms the first barrier, combining Fibonacci levels and cloud resistance. Moreover, $2,968 remains a mid-range ceiling where previous rallies failed.
Related: Bitcoin Price Prediction: BTC Trend Weakens as $60K Emerges as the Last Defense
Significantly, ETH must reclaim $3,347 to shift the broader trend toward a bullish outlook. Momentum indicators support the bearish view, as ADX near 55 signals a strong trend environment. Since price declines while ADX rises, sellers maintain directional strength.
Open Interest and Spot Flows Reveal Caution
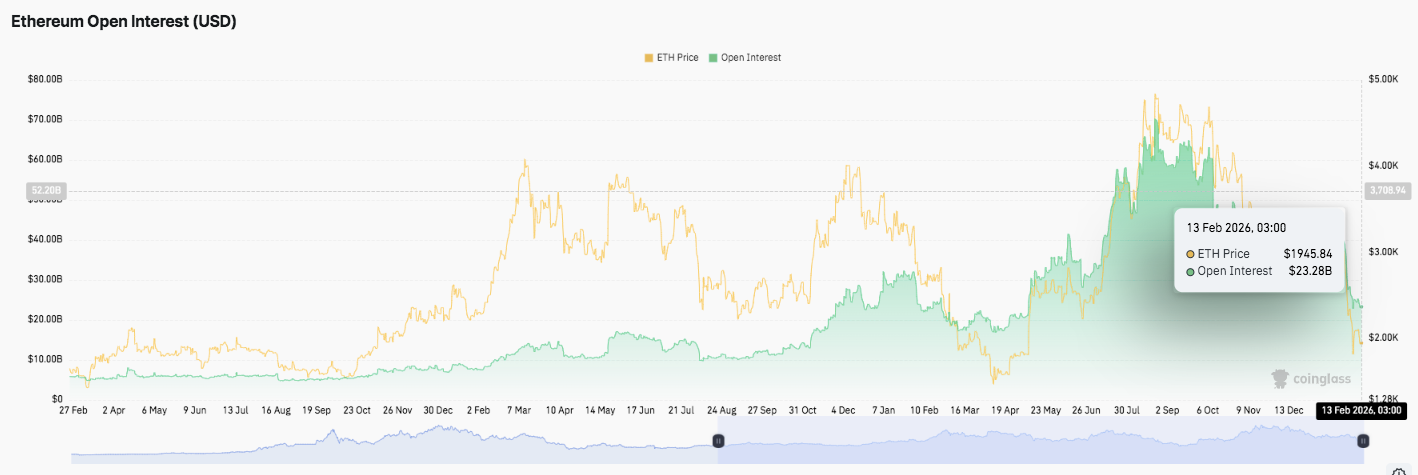
Derivatives activity offers additional insight into market sentiment. Open interest followed ETH’s earlier expansion, climbing steadily as traders increased leveraged exposure.
However, recent price weakness triggered deleveraging, reducing open interest toward $23 billion. Hence, traders appear more cautious and less willing to hold aggressive positions. This cooling trend often reflects uncertainty rather than renewed confidence.
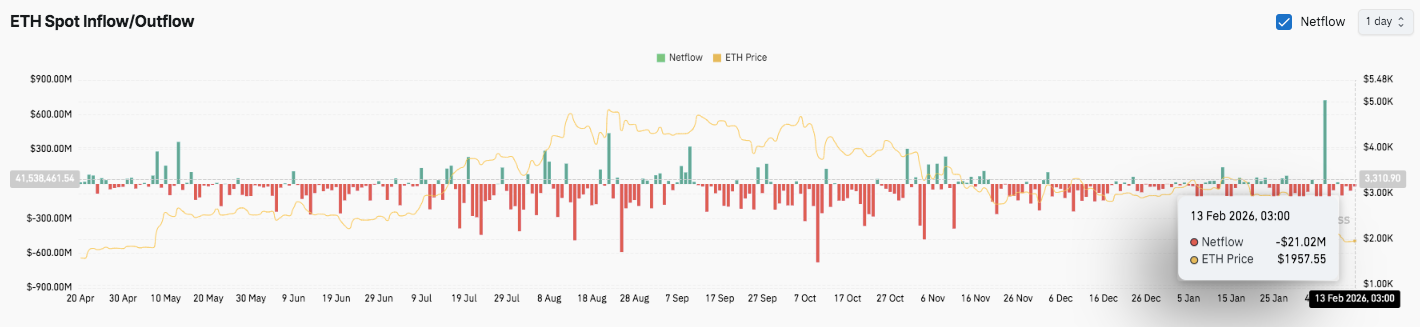
Spot flow data also shows mixed behavior. Earlier inflow spikes suggested exchange deposits and short-term selling pressure. However, prolonged outflows later indicated investors moved coins off exchanges, reducing immediate sell supply.
Additionally, intermittent inflow bursts signaled profit-taking during rebounds. Recently, flows stabilized near neutral levels, which points to indecision. Consequently, the market now waits for clearer direction as participants balance accumulation against risk reduction.
Related: XRP Price Prediction: XRP Weakens at $1.35 Support Despite CEO’s $1T Ripple Target
Technical Outlook for Ethereum Price
Key levels remain clearly defined for Ethereum as the market navigates a strong bearish structure.
Upside Levels: $2,234–$2,512 stands as the immediate resistance cluster, aligned with prior breakdown structure and Fibonacci confluence. A sustained move above this zone could open room toward $2,968. Beyond that, $3,347 marks the macro resistance level that must break to confirm a broader trend reversal.
Downside Levels: $1,960–$1,900 serves as the first support band and current reaction zone. Below that, $1,740 represents major structural support on the daily chart. A breakdown under $1,740 could accelerate selling toward the $1,600–$1,500 demand area.
Resistance Ceiling: The $2,512 level, reinforced by the Ichimoku cloud overhead, acts as the key barrier to flip for medium-term recovery momentum.
The technical structure shows Ethereum trading firmly within a downward channel, reinforced by rising ADX near 55. This setup signals strong trend conditions rather than consolidation. Until buyers reclaim the $2,234–$2,512 range, rallies may face selling pressure.
Will Ethereum Recover?
Ethereum’s near-term direction hinges on whether bulls can defend the $1,900 zone and prevent a breakdown toward $1,740. A successful defense could allow price to challenge the lower resistance cluster again. However, failure to hold support risks extending the decline into deeper demand zones near $1,600.
For now, Ethereum trades in a decisive area. Momentum favors sellers, but support remains within reach. The next leg will depend on whether buyers step in with conviction or allow the broader downtrend to continue.
Related: Cardano Price Prediction: ADA Slips Toward $0.25 As LayerZero Integration Fails To Lift Price
Disclaimer: The information presented in this article is for informational and educational purposes only. The article does not constitute financial advice or advice of any kind. Coin Edition is not responsible for any losses incurred as a result of the utilization of content, products, or services mentioned. Readers are advised to exercise caution before taking any action related to the company.


