
- Ethereum trades near $3,060–$3,080 as short-term support faces persistent selling pressure.
- Futures open interest remains high at $38.62B, signaling strong speculative participation.
- Long-term Ethereum upgrades focus on quantum resistance and Layer 2 innovation trends.
Ethereum continues to trade under heavy pressure as the market struggles to regain momentum after weeks of steady declines. The asset trades near the $3,060–$3,080 region, which now serves as the main short-term support.
Besides this immediate zone, traders monitor structural weakness forming on the lower timeframes. The four-hour chart shows repeated failures at declining resistance, consistent sell signals, and persistent trading below the 9-EMA. Consequently, market sentiment remains defensive as Ethereum attempts to stabilize near its current levels.
Market Structure Reflects Sustained Bearish Control
Ethereum maintains a clear pattern of lower highs and lower lows. Each rebound attempt fades quickly as sellers dominate every recovery. Price action remains trapped inside a declining channel that has guided the downtrend for several weeks.
Additionally, the $3,200–$3,250 region forms the first major obstacle. This zone aligns with SuperTrend resistance and has capped multiple recovery attempts. Above that, the 23.6% Fibonacci level at $3,373 marks a crucial pivot.
Price has struggled at this point throughout the month, reinforcing its importance for any trend reversal. Moreover, higher resistance around $3,637 continues to limit stronger breakouts.
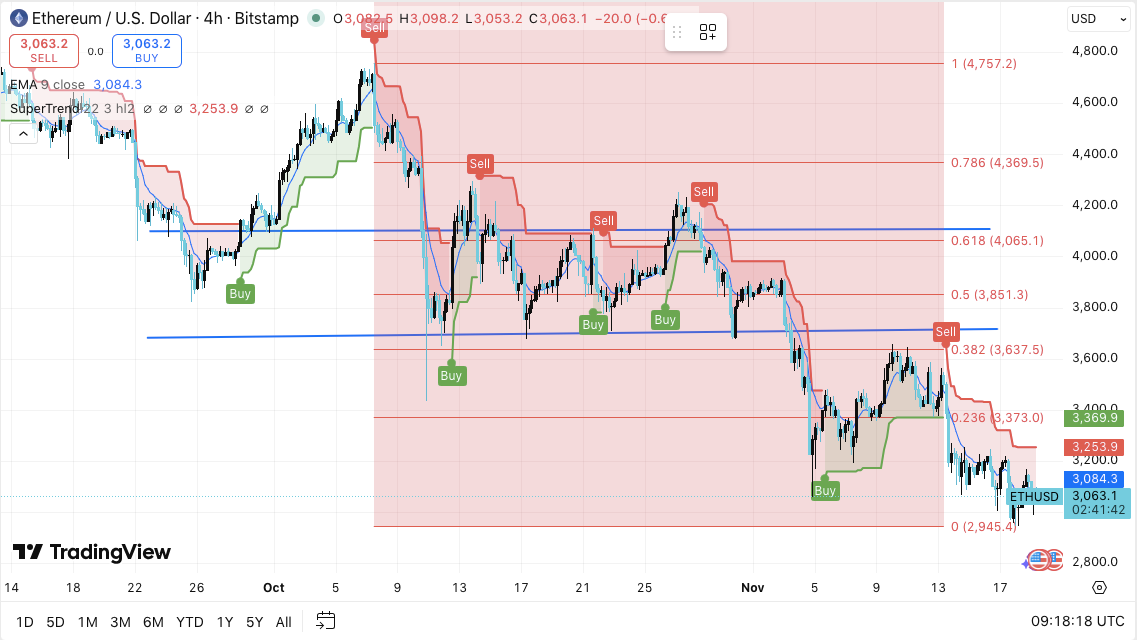
The immediate concern is the support area at $3,060–$3,080. A clear breakdown below this region exposes the 0% Fibonacci level at $2,945. This point represents the lowest swing level in the current structure. Hence, losing this area may accelerate downside movement.
Derivatives Data Shows Strong Participation Despite Pullbacks
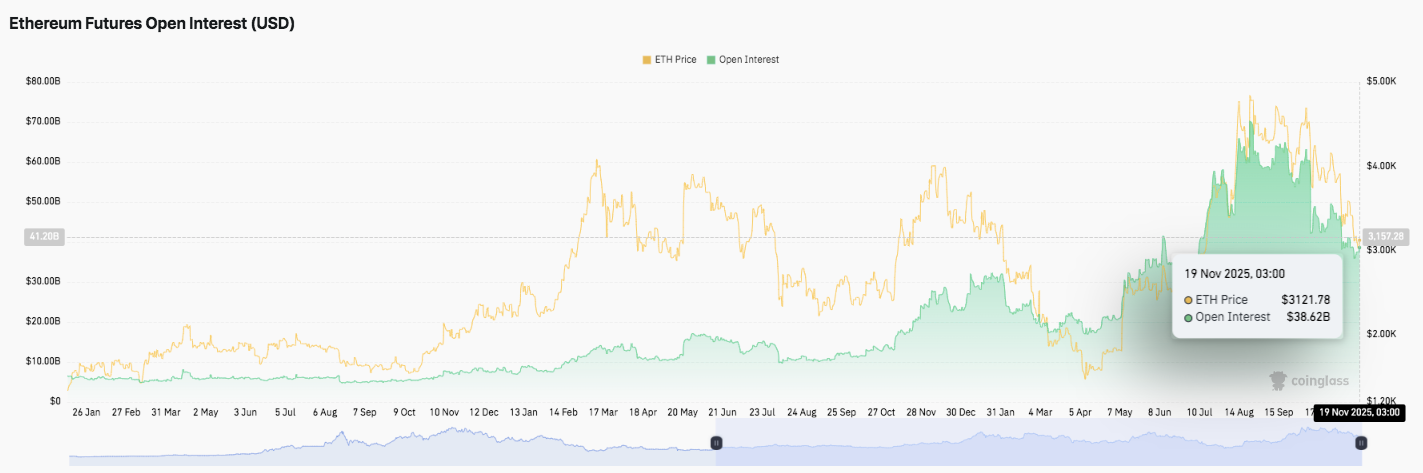
Ethereum futures open interest remains elevated despite ongoing volatility. Open interest climbed sharply from late July through September. Levels peaked above $40 billion as leveraged activity increased. Furthermore, traders kept positions open even during recent declines.
Related: Pi Price Prediction: PI Price Holds Mid-Range as Traders Track Upcoming Unlocks
Open interest stood at $38.62 billion on November 19 while price traded near $3,121. This trend suggests that speculative involvement remains strong. Market participants continue to position for future moves despite the broader corrective environment.
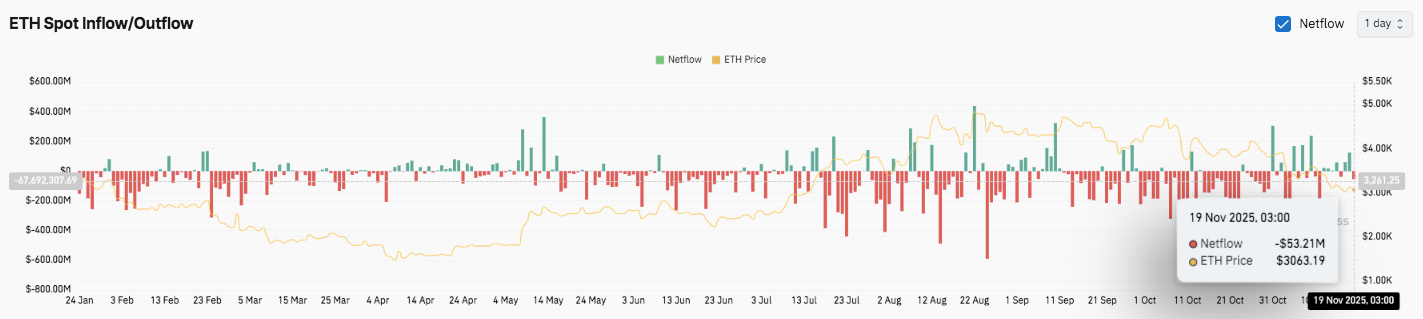
Besides futures activity, spot flows reflect cautious sentiment. Outflows dominated the trend from August through November, often aligning with price weakness.
The most recent reading shows a $53.21 million net outflow. This pattern signals distribution by large holders. However, occasional inflow spikes created brief periods of stability and hinted at selective accumulation.
Ethereum Community Considers Long-Term Protocol Shifts
Away from price action, discussions around Ethereum’s long-term security continue to grow. Vitalik Buterin recently emphasized the need for quantum-resistant upgrades within four years. He also encouraged a shift toward ossifying core protocol features.
Hence, innovation may increasingly move to Layer 2 networks, wallets, and privacy tools. This direction introduces a new debate about Ethereum’s evolution as the network prepares for future technical challenges.
Technical Outlook for Ethereum Price
Key levels for Ethereum remain clearly defined as the asset trades within a persistent declining structure.
Upside levels include $3,200, $3,250, and $3,373, which form immediate hurdles for any recovery attempt. A breakout above $3,373 could extend toward $3,637, where the 38.2% Fibonacci level capped previous reversals.
Downside zones remain equally important. The $3,060–$3,080 band serves as short-term support, while a breakdown exposes the $2,945 level, which aligns with the current swing low and the 0% Fibonacci marker. This region represents the strongest structural floor on the chart.
Price action shows Ethereum trading inside a steady declining channel, with lower highs and lower lows guiding momentum. Sell signals on the SuperTrend and persistent rejection at the 9-EMA reinforce the bearish environment. Hence, ETH continues to compress against the lower boundary of the pattern, where a decisive move could trigger significant volatility expansion in either direction.
Will Ethereum Hold This Zone?
Ethereum’s near-term direction depends on whether buyers can defend the $3,060 support pocket long enough to challenge the $3,200–$3,250 zone. Sustained inflows and a reclaim of the 9-EMA would strengthen bullish attempts toward $3,373 and $3,637. Additionally, elevated open interest suggests strong participation, which could amplify moves once price escapes the channel.
Related: Starknet Price Prediction: STRK Holds Breakout Zone As Buyers React To $3M Spot Inflows
However, failure to hold $3,060 risks pulling ETH toward $2,945, where the broader accumulation base sits. A breakdown there would weaken the structure further and may encourage deeper corrective pressure. For now, Ethereum trades at a pivotal point. Market flows and trend confirmation remain the deciding factors for the next meaningful leg.
Disclaimer: The information presented in this article is for informational and educational purposes only. The article does not constitute financial advice or advice of any kind. Coin Edition is not responsible for any losses incurred as a result of the utilization of content, products, or services mentioned. Readers are advised to exercise caution before taking any action related to the company.


